

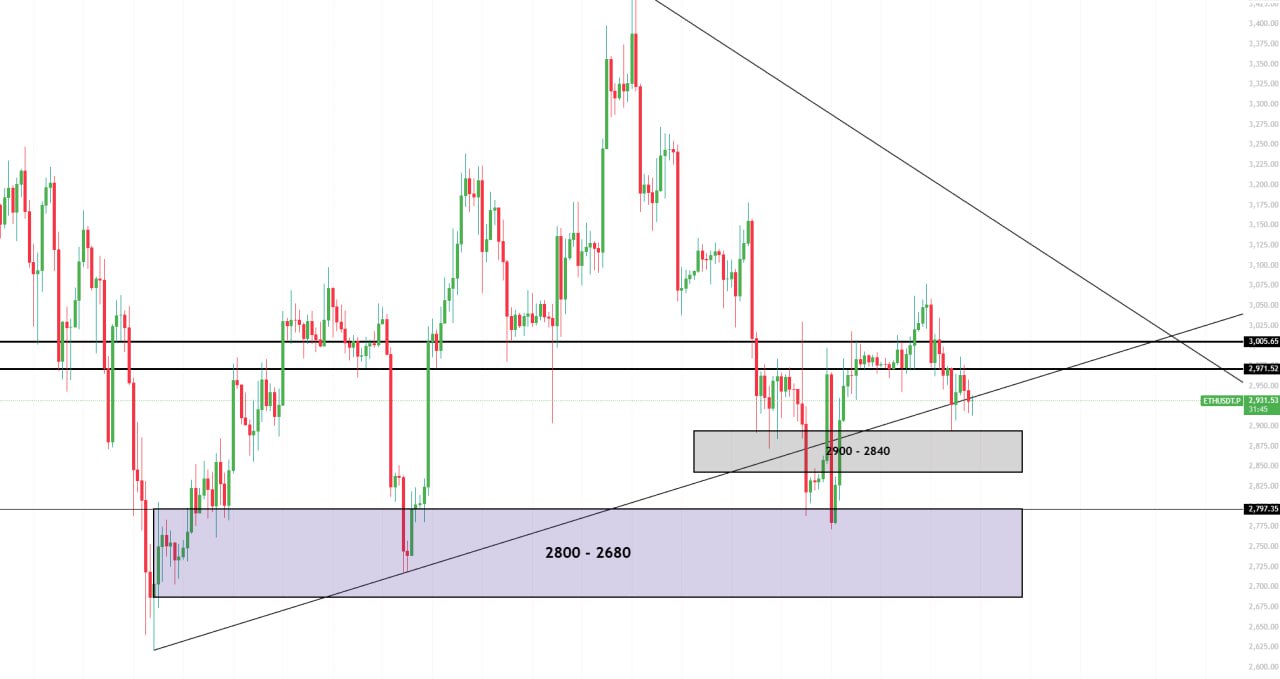
#ETH This is the Ethereum chart. Looking at the chart alone, unfortunately, it appears to have a higher downside potential than BTC. Let's look at the facts: 1. It's still within the downtrend line. 2. It broke through the support line again, but has yet to re-enter. 3. It failed to find support at the key 3003-2970 level. At present, it seems likely that it will re-enter the trend line, or at least, it needs to find support at 3003-2970 to be able to make an aggressive bullish bet. Realistically, we should carefully watch the two-stage box range. In particular, What about the 2800-2680 range? This has been overlapping since the beginning of the July uptrend. If this level breaks, the only way to go is to wait and see. First, among the two trading ranges, the 2800-2680 range has not yet been broken through, as confirmed by the chart. If it falls back to that range, assuming it holds, then it seems advisable to make a full-scale purchase. Please check back regularly. *This is not an investment recommendation. Your own judgment is yours.
This article is machine translated
Show original

Telegram
Disclaimer: The content above is only the author's opinion which does not represent any position of Followin, and is not intended as, and shall not be understood or construed as, investment advice from Followin.
Like
Add to Favorites
Comments
Share
Relevant content


