Ethereum's price has remained relatively flat over the past week, showing little change despite conflicting predictions. While the market appears calm on the surface, charts and on-chain data tell a completely different story. A clear breakout pattern is forming, and selling pressure from long-term holder has significantly decreased.
This scenario is quite rare. If it holds, the next major surge in Ethereum may be in the making.
The inverse Vai and shoulders breakout pattern coincides with a sell-off in on-chain market.
On the daily chart, Ethereum is forming a fairly clear inverse Vai-and- Vai reversal pattern . The neckline area is relatively flat, located around $3,400 – this is a very important point. A flat neckline usually attracts strong capital inflows when the price breaks above it.
If Ethereum closes strongly above this neckline (around $3,400), the target from the reversal pattern could reach nearly $4,400. This target is derived from the height of the pattern's head and pushed upwards. Technically, this scenario looks very promising.
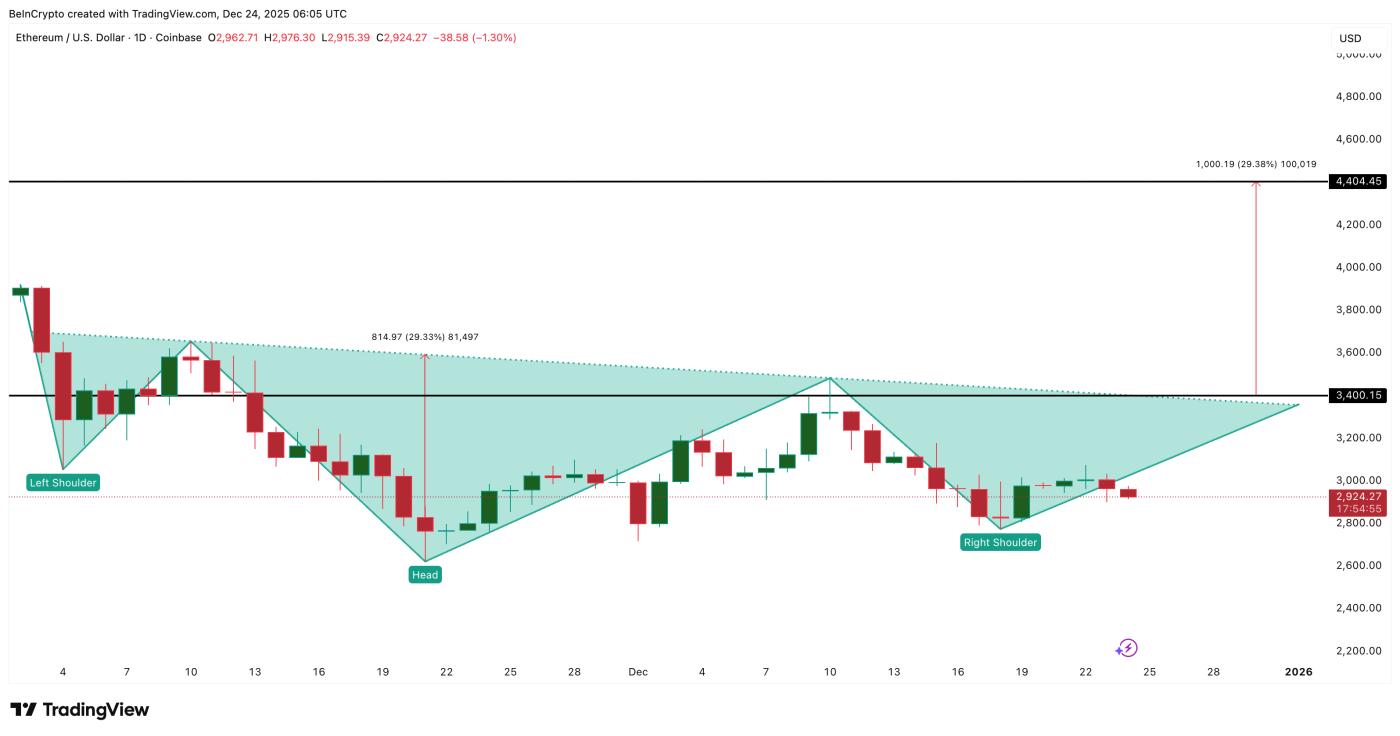 Ethereum breakout pattern: TradingView
Want to follow more Token analysis? Sign up for the daily Crypto newsletter compiled by editor Harsh Notariya here .
What makes this model even more attractive is that on-chain data is showing positive signs.
The Hodler Net Position Change index measures XEM long-term investors are selling or continuing to hold. Between November 26, 2023, and December 23, 2023, this index showed a significant change. On November 26, 2023, long-term holder had sold nearly 1,100,000 ETH. However, by December 23, 2023, this number had dropped to only 54,427 ETH.
Thus, selling pressure has decreased by more than 95% in a short period of time.
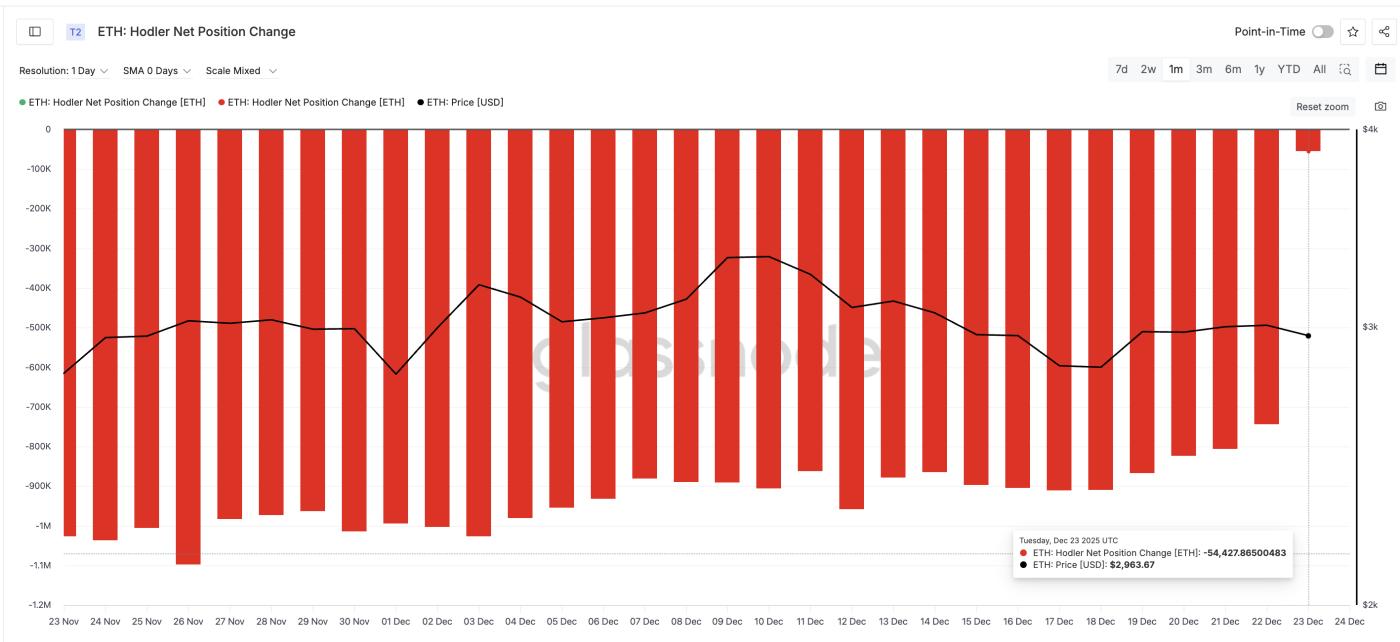 Number of holder sold dropped 95%: Glassnode
This is extremely important because long-term holder often reduce selling when the market is preparing for a reversal cycle. When a breakout pattern forms and selling pressure significantly decreases, it indicates that supply is drying up rather than increasing. This base will make it easier for the price to rise if it breaks above the neckline.
Simply put, the chart is signaling a breakout, while on-chain data shows fewer sellers than before.
Ethereum's Capital levels and key price ranges.
The next question is whether Ethereum will actually successfully break above this neckline?
Cost basis data will answer this. Cost basis indicates where large amounts of ETH were bought. These areas often become resistance when the price reverses, as many holder will choose to sell at break Capital.
With Ethereum , the most important cost basis range is between $3,150 and $3,173. Approximately 2,940,000 ETH were once accumulated in this range. This is the largest supply "wall" when the price rises.
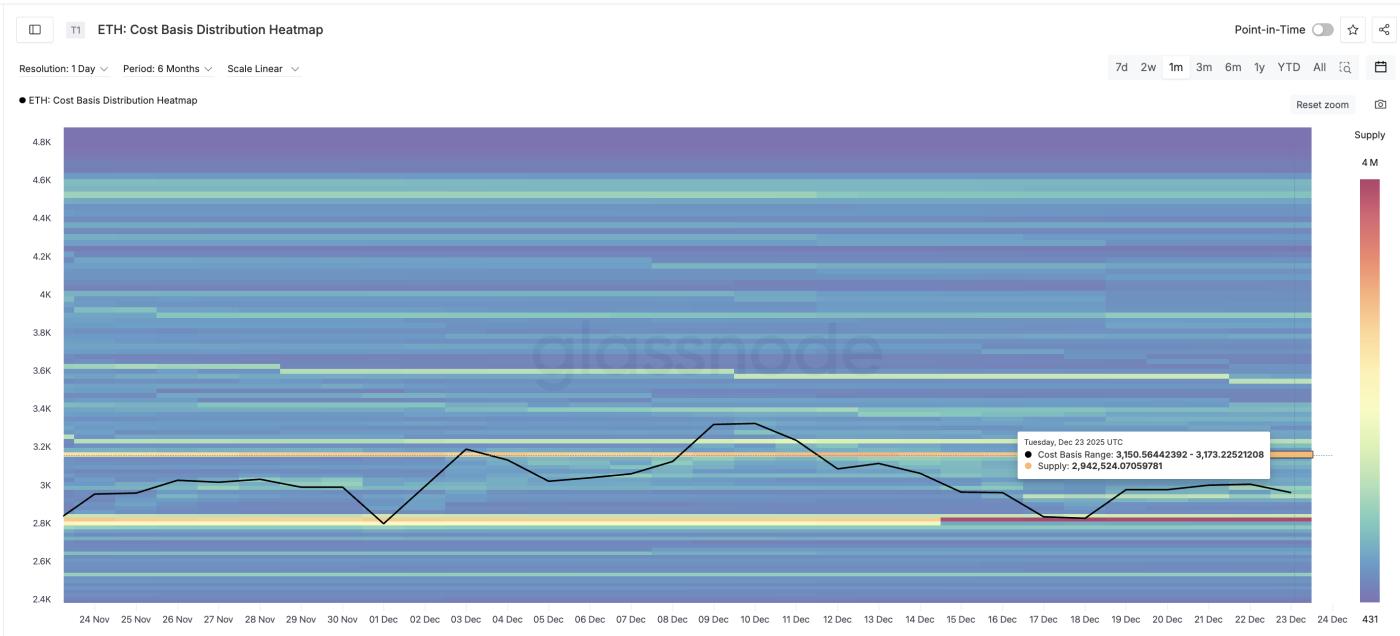 The most important ETH supply region: Glassnode
If the price rises steadily beyond this zone, the door to $3,400 will be wide open. Compared to the current price, this represents an increase of approximately 7%. In fact, $3,150 is also a significant milestone on the price chart – further confirming the Vai of this zone.
If it breaks above $3,400, the next resistance level will be around $3,480, followed by a relatively thin resistance zone before reaching $4,170.
If buying pressure continues to increase after the breakout, the target from the inverse Vai-and- Vai pattern at the $4,400 region is entirely achievable.
Of course, Ethereum still carries risks. If it falls below $2,800, the bullish structure will weaken. If it drops below $2,620, the bullish scenario will be completely broken, and the sellers will regain control.
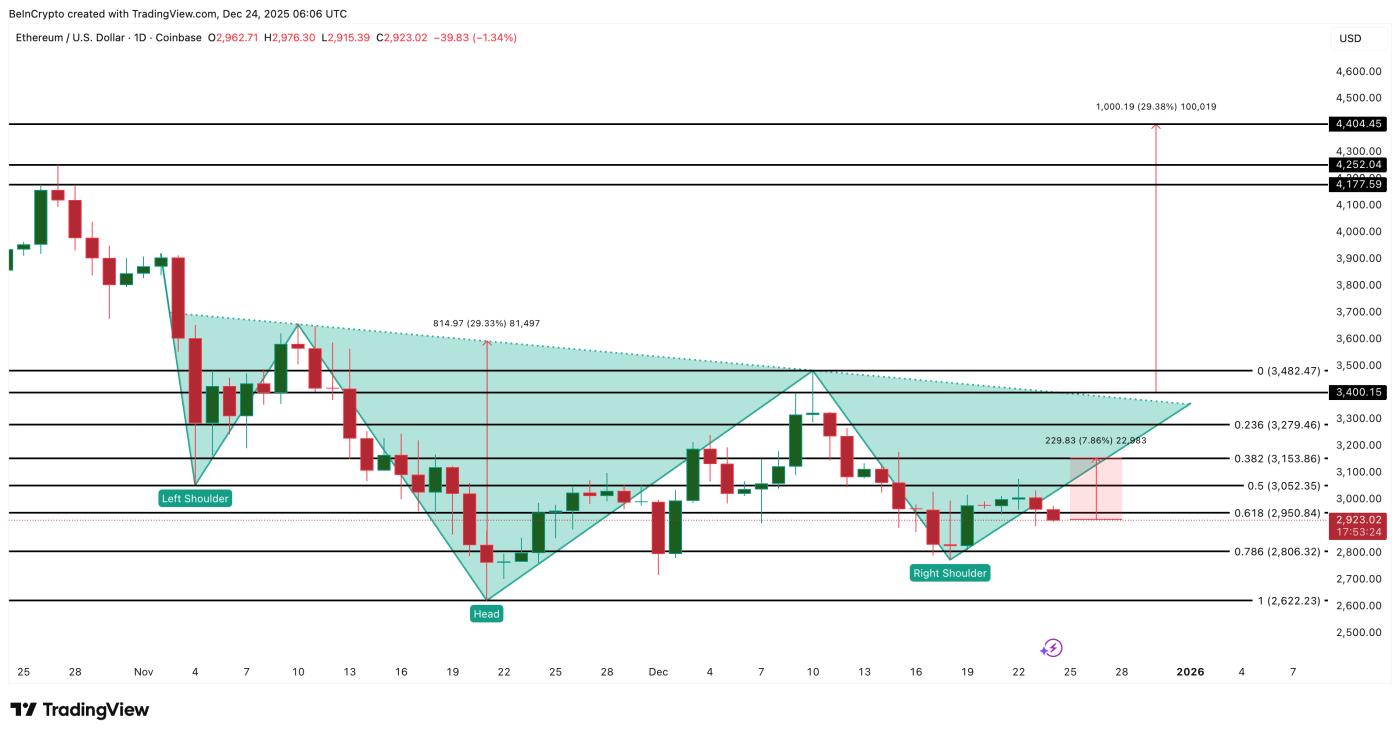 Ethereum Price Analysis: TradingView
Overall, the advantage still leans toward an uptrend. With a standard reversal pattern, significantly reduced long-term selling pressure, and a clear resistance map, the market is in a favorable position for an increase. However, this entire bullish scenario is only feasible if Ethereum closes firmly above the $3,150 mark – that is, breaking through the key supply barrier.