

XRP price remains trapped within a descending parallel channel, a negative technical pattern that began around mid-July.
However, this Token – which powers the Ripple ecosystem – bucked the trend as the entire crypto market experienced a net outflow of $446 million last week.
XRP bucked the trend as outflows from the crypto market reached $446 million.
According to the latest report from CoinShares, crypto investment funds recorded net Capital of $446 million last week, slightly lower than the $952 million net outflows recorded in the week ending December 20, 2023.
Despite continuous Capital outflows, XRP bucked the trend, recording positive inflows for both weeks, while major assets like Bitcoin and Ethereum were in the red.
After attracting $62.9 million in positive inflows in the week before Christmas , XRP continued to flow in, reaching $70.2 million in the most recent week. Meanwhile, Bitcoin and Ethereum recorded Capital of $443 million and $59.3 million, respectively.
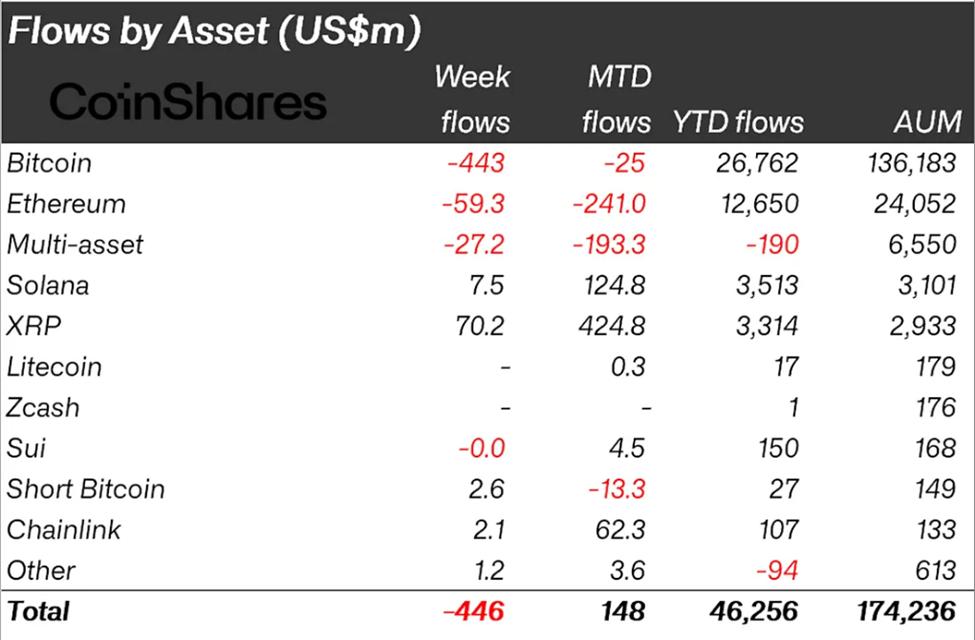 Crypto fund flows last week. Source: CoinShares
“This suggests investor sentiment has not fully recovered… XRP and Solana saw the highest inflows last week, reaching $70.2 million and $7.5 million respectively,” according to a new CoinShares report.
James Butterfill, head of research at CoinShares, believes that the positive sentiment towards XRP and Solana largely stems from the launch of ETFs for these two Token in mid-October.
"Since launching their ETFs in the US in mid-October, these two Token have attracted $1.07 billion and $1.34 billion in inflows, respectively, bucking the negative trend seen in other assets," Butterfill added.
Indeed, as BeInCrypto has reported, XRP ETFs have consistently attracted Capital chain , most likely the main reason XRP attracted an additional $70 million last week.
Technical pressure is increasing as XRP price consolidates in a bearish pattern.
Despite the increasing inflow of funds related to XRP , Ripple's price remains trapped in a bearish pattern, with many sellers waiting for opportunities to take profits whenever the price rebounds slightly. on-chain data and charts, however, paint a different picture.
As long as XRP price remains within this descending channel, the likelihood of further declines remains very high. If it breaks and closes below the $1.77 support level, the price could slide to $1.50 – nearly 20% lower than its current level.
How can XRP avoid this scenario when sellers are overwhelming buyers, even during slight rallies? The red horizontal bars represent areas where sellers are strong, while the green horizontal bars indicate where buyers are supporting the price.
The Relative Strength Index (RSI) – a momentum indicator – is currently also leaning towards the sell side as it is below 50. This reinforces the correction phase, as the RSI gradually moves sideways after a long downtrend, often signaling a period of compressed momentum.
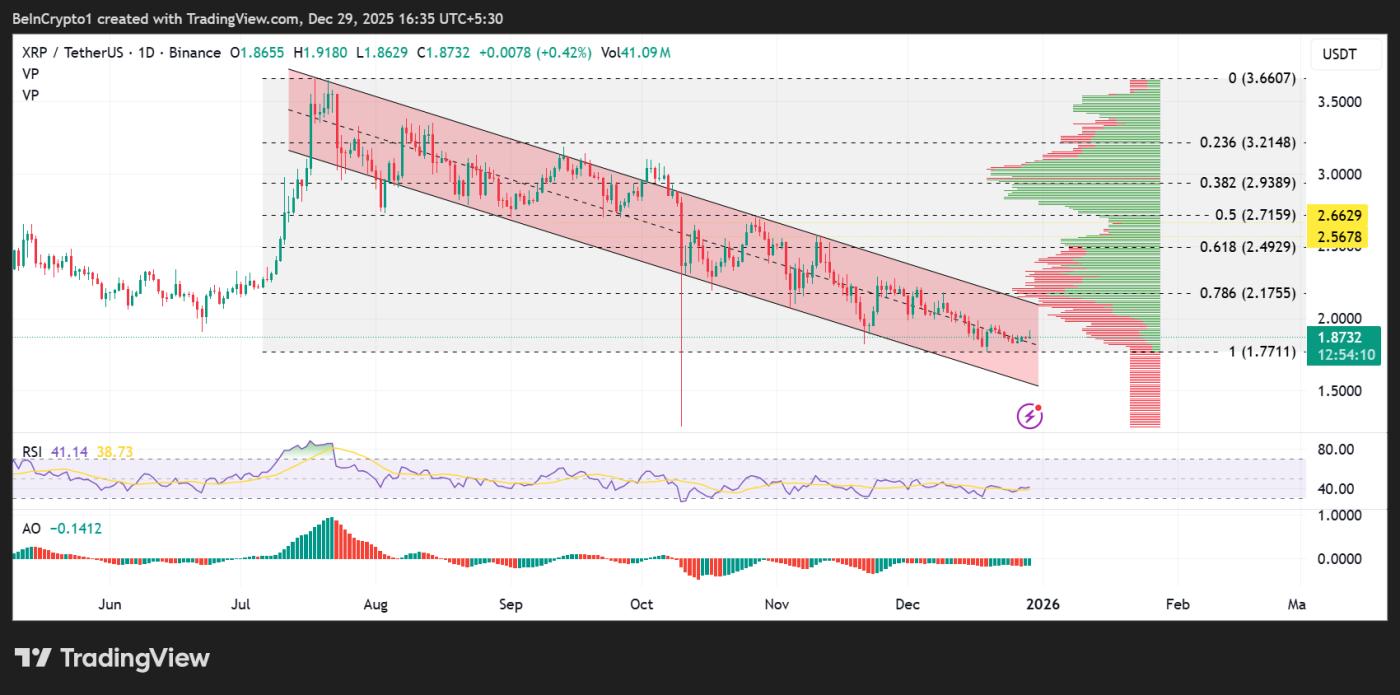 Ripple (XRP) price movement. Source: TradingView
At this time, the Awesome Oscillator indicator turned slightly green but remained in negative territory. This means that selling pressure is weakening, but buyers haven't yet entered the market strongly.
The slight RSI pullbacks have all failed to break above the middle line, and the price has consistently respected the upper boundary of the descending parallel channel – a sign that the downtrend remains in effect.
So what could change the course of the XRP price? The first signal would appear if the RSI breaks and stays above 50 – especially if the price simultaneously breaks out of the descending channel upwards.
Retail investors should patiently wait for the price to break out and confirm a move above the trend line of the downtrend channel. Before that, most rallies should only be considered temporary technical rebounds.


