

Cardano price has risen approximately 13% since its Dip on December 25, 2023. Currently, ADA is moving into a breakout zone within a Falling Wedge pattern. While ADA is still down nearly 10% this month, this week's rally is more than just a minor pullback.
The three current signals suggest that the trend may be about to reverse if the price confirms a breakout.
The Falling Wedge pattern has now shown signs of a reversal.
The Falling Wedge pattern has caused ADA price to continuously decline since the beginning of November 2023. ADA has tested the upper resistance line of the wedge near $0.69. If the price closes above this line on the daily chart, the estimated upside target is up to 79%, heading back towards the $0.69 region. This target is determined by measuring the vertical distance between the lowest and highest points in the wedge, then adding the breakout point.
That could be a price prediction for ADA if a real breakout occurs.
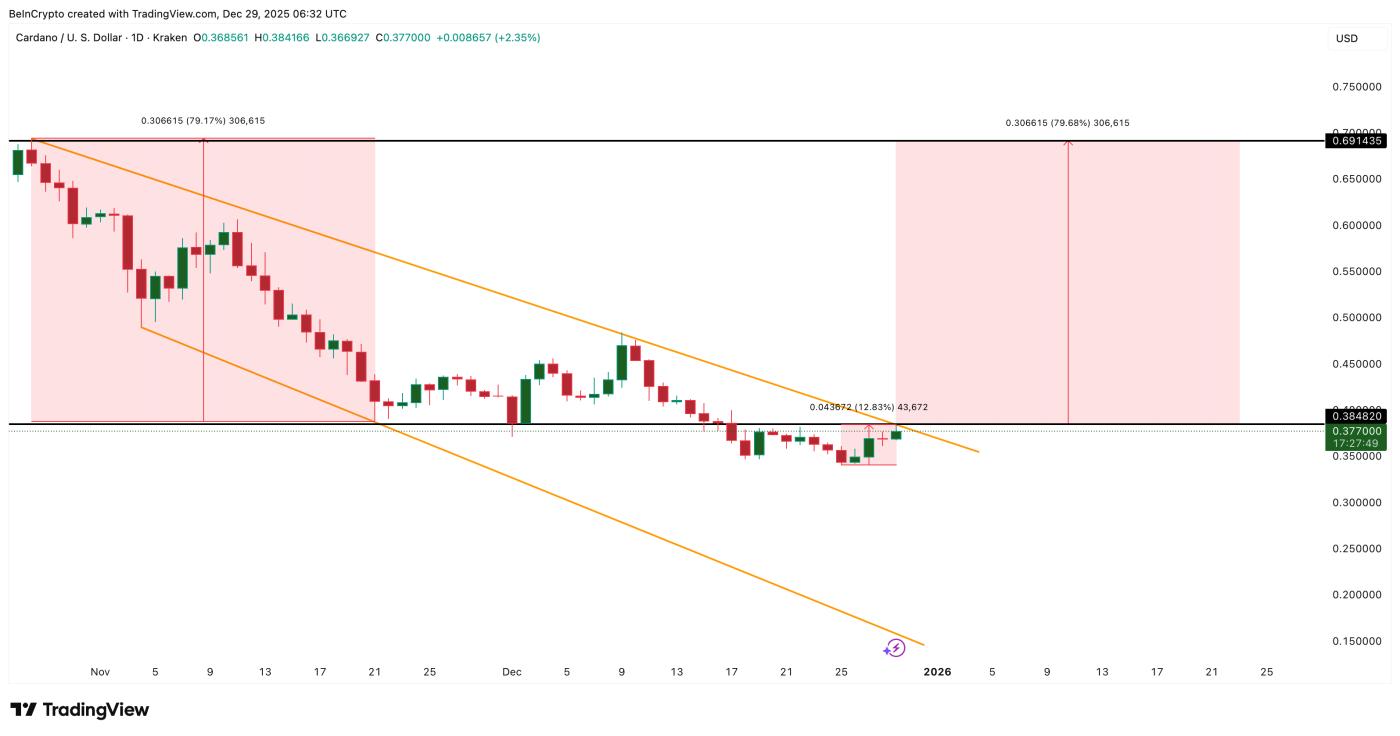 ADA bullish pattern: TradingView
Want to stay updated on Token markets like this? Sign up for Editor Harsh Notariya's daily Crypto newsletter here .
The RSI indicator, which stands for Relative Strength Index, measures momentum and identifies overbought/oversold levels, also supports this scenario.
From December 1st, 2023 to December 25th, 2023, the price of ADA reached a new Dip . However, the RSI reached a higher Dip during the same period. This is a bullish divergence, indicating that selling pressure has weakened even though the price continues to fall.
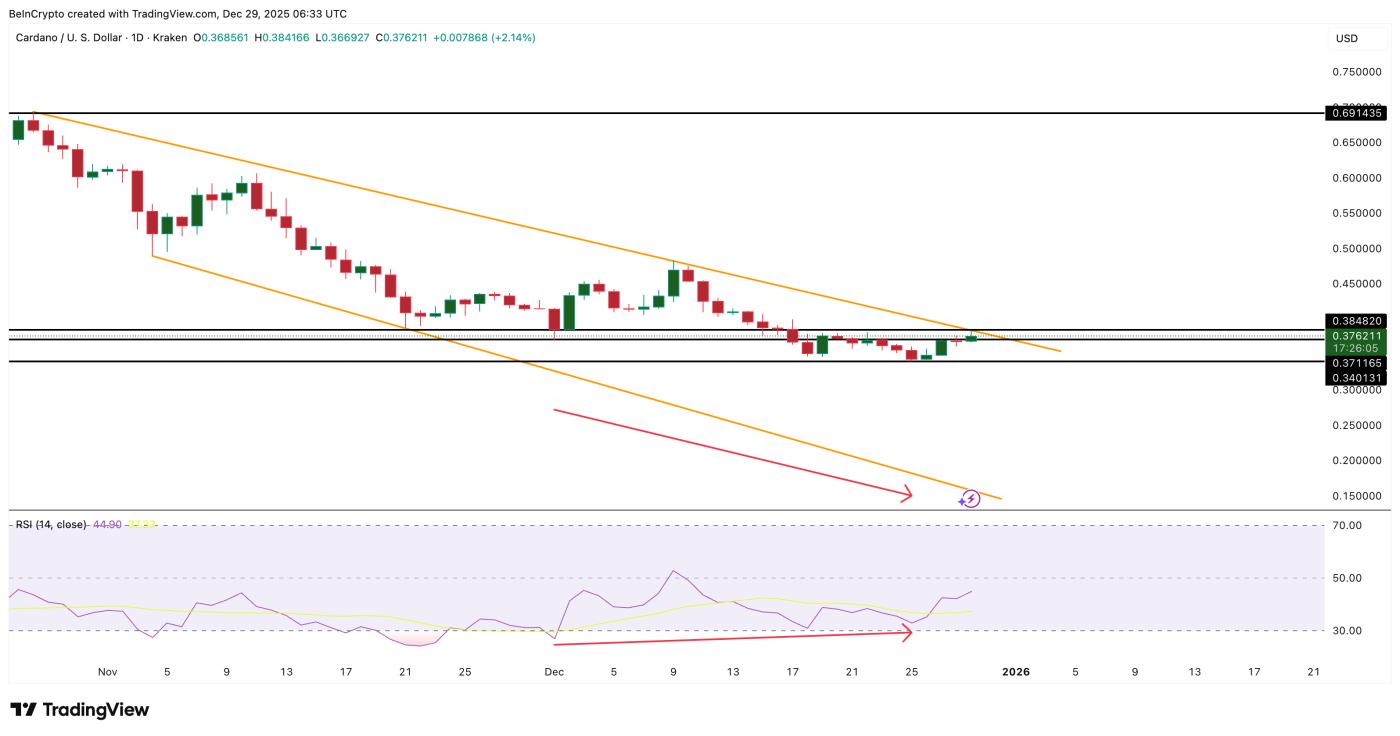 Cardano and bullish divergence: TradingView
This divergence triggered the current 12.8% rally. If ADA breaks above the $0.38 level, the RSI divergence could signal a trend reversal rather than just a short pullback.
Whales accumulate, coin activity decreases.
Whales holding between 100 million and 1 billion ADA ADA increased their holdings following a breakout signal. On December 26, 2023, this group held 3.72 billion ADA. Currently, that number has increased to 3.83 billion ADA, equivalent to an increase of nearly $41 million.
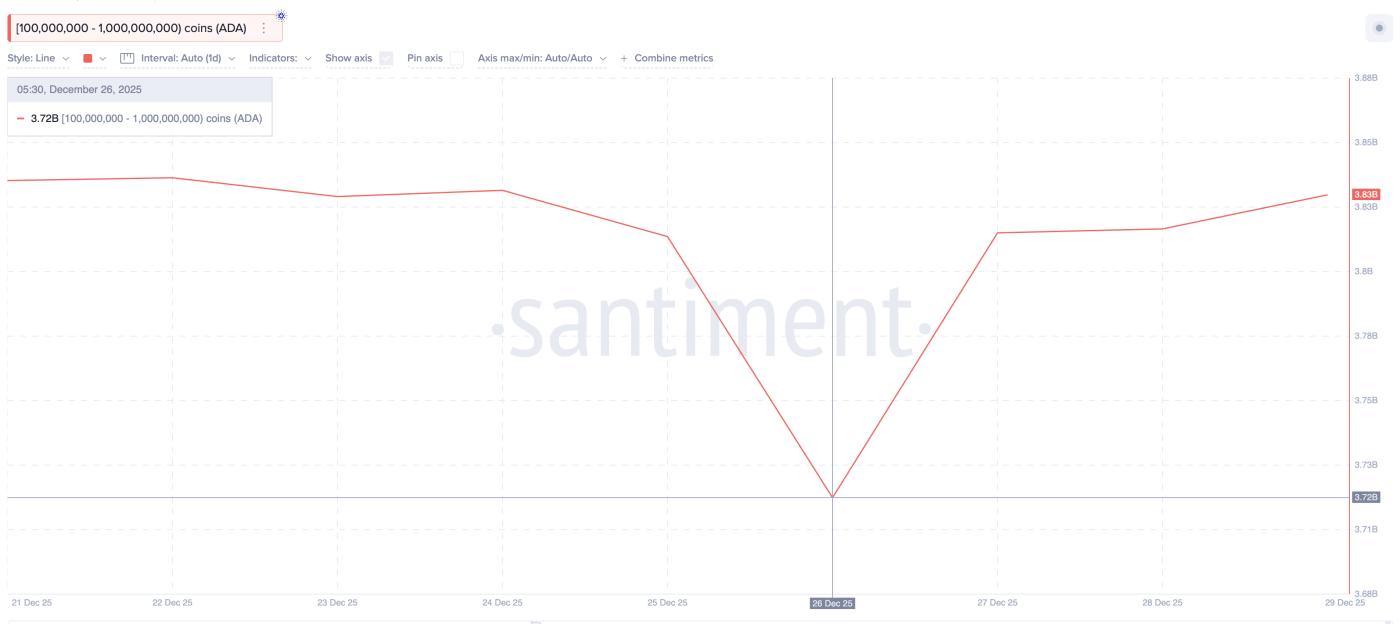 Whales continue to buy more: Santiment
This rally began just one day after the RSI divergence and continued as the price approached the wedge's resistance. This timing is crucial because whales typically accumulate before a trend changes, rather than buying afterward.
Coin activity on the network, measured by the Token age band (which reflects the supply moving between new and old wallets), has just decreased sharply. On December 27, 2023, the figure was approximately 149.43 million ADA. To date, it has fallen to 116.16 million ADA, a decrease of 22%.
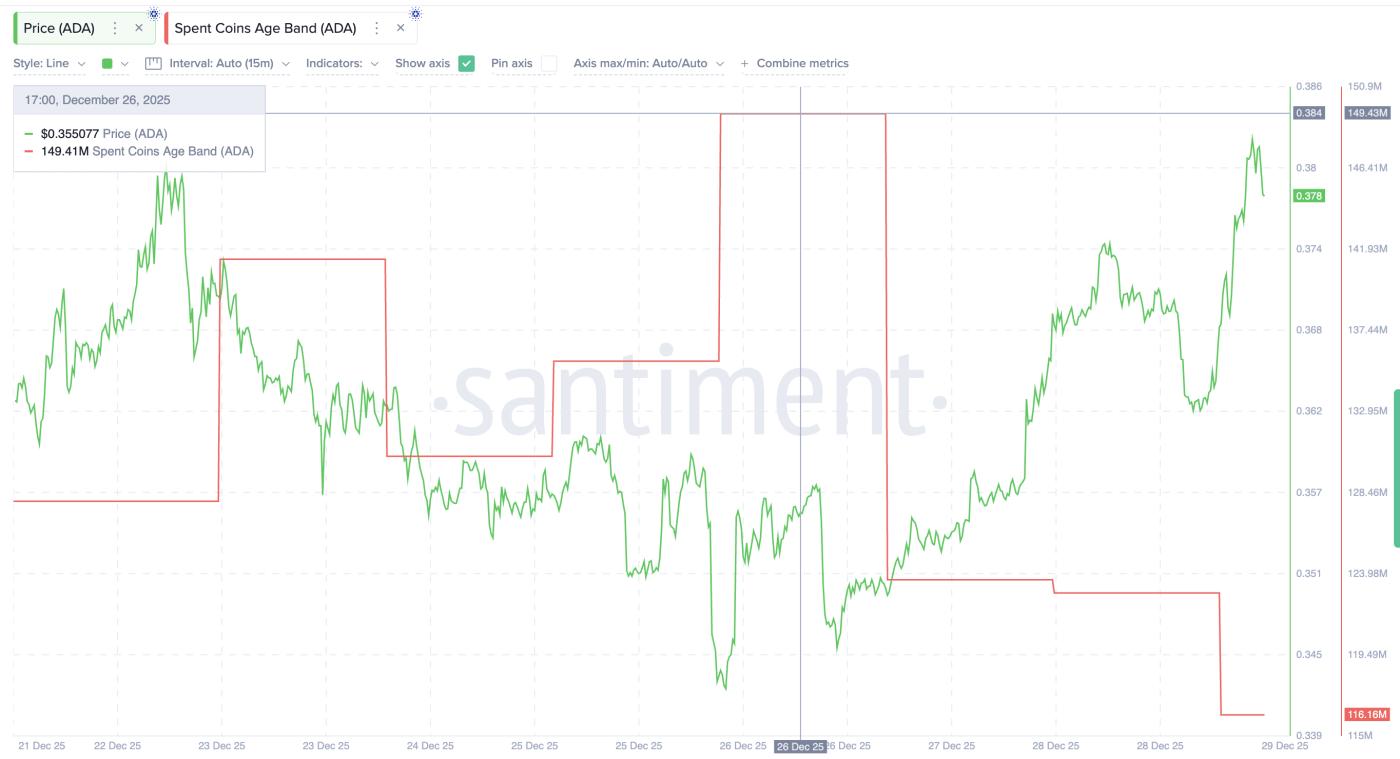 Coin activity decreases: Santiment
Decreased coin activity means less of the old coins being sold, reducing selling pressure. When whales increase buying and coin transfer activity decreases, it creates favorable conditions for a price breakout. These two signals are also consistent with the wedge pattern and the RSI signal.
The Cardano price will determine whether the $0.69 target is reached.
ADA is currently trading near $0.38. If the closing price for the day is above $0.38, the wedge pattern will be confirmed with a breakout. At that point, ADA could move to the next target of $0.42. Reclaiming the $0.47 level is particularly important because ADA has previously failed twice at this level (November 17, 2023 and December 9-10, 2023).
Reclaiming the $0.47 level would confirm a shift in the trend structure. If it breaks above the $0.51 and $0.55 levels, the upward momentum will strengthen, and the target of $0.69 will become more achievable.
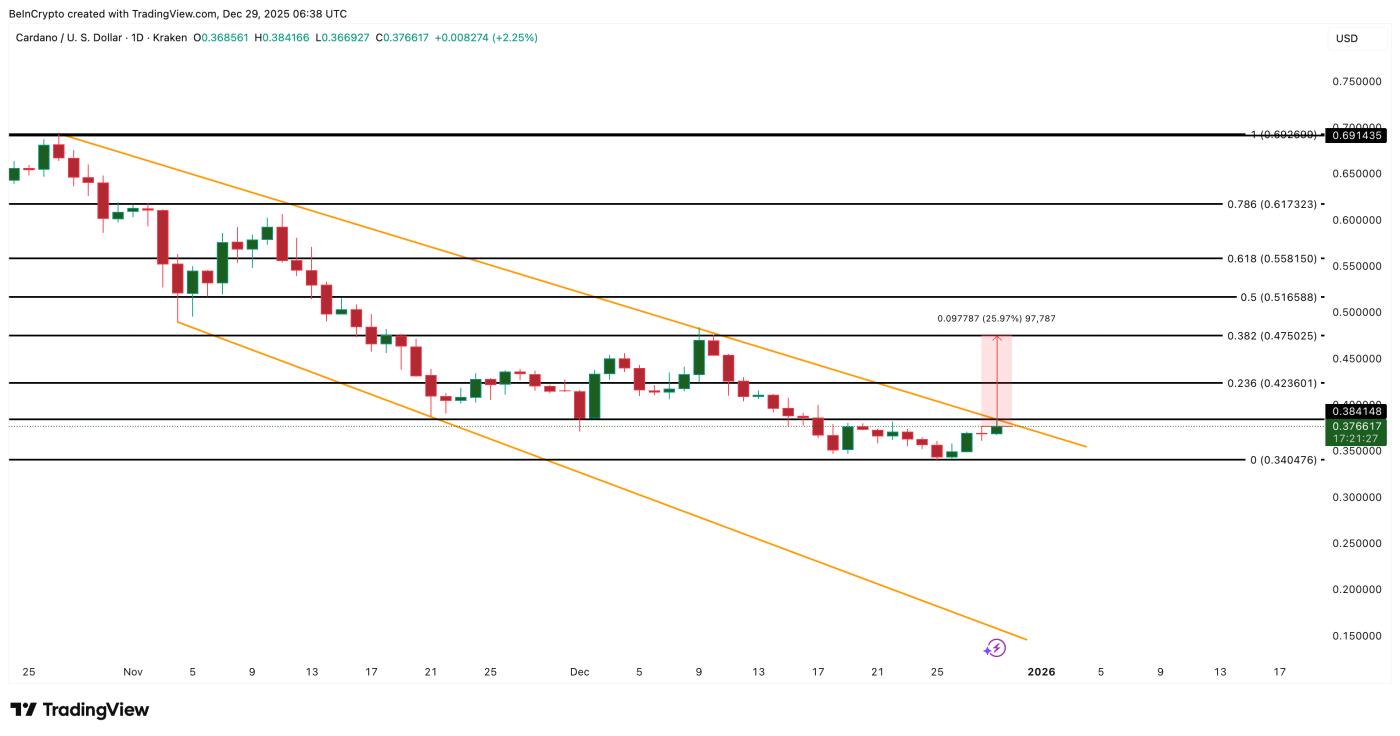 Cardano Price Analysis: TradingView
If ADA falls below the $0.34 level, the Falling Wedge pattern will continue, but the chances of a breakout will weaken.
Currently, ADA is facing its most significant challenge in over a month. The Falling Wedge pattern and RSI indicator suggest a potential reversal. Whales are accumulating, but trading activity is gradually decreasing. Unless ADA clearly breaks above $0.38 and lacks the strength to move towards the $0.47 area, these signs cannot yet form a solid trend.


