

Bitcoin's price enters 2026 with mixed opinions. Some predict a sharp rise to $200,000, like Tom Lee. Meanwhile, others, such as veteran trader Peter Brandt, warn that Bitcoin could retest its previous price range before potentially falling further.
However, opinions like YoungHoon Kim's suggest that the recent dips are merely temporary manipulation before Bitcoin regains strength. With conflicting predictions, the truth likely lies between fear and excitement. Let's delve deeper to XEM which chart and on-chain signals are most important as the new year begins.
The December trend and Dip signals have yet to appear.
Bitcoin is ending December in the red again (almost). This has made sense before. Since 2022, every time Bitcoin ended December in the red, January turned green. This pattern lays the groundwork for bigger rallies in 2025—including the April 2025 surge that took BTC to a peak of $126,000 in October.
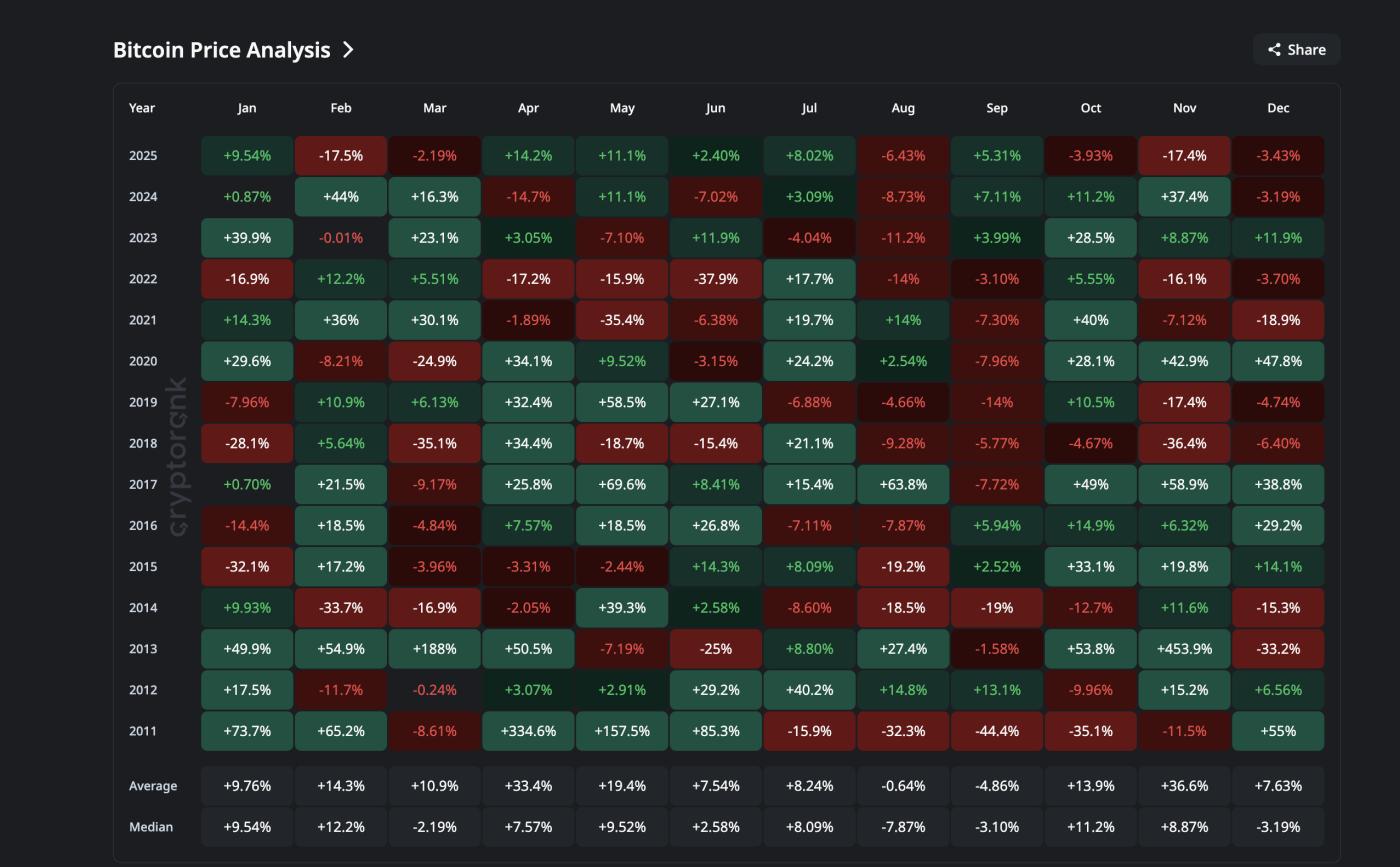 Bitcoin Price History: CryptoRank
Want to read more opinions on Token ? Sign up for editor Harsh Notariya's daily Crypto newsletter here .
Currently, a similar scenario is emerging. The reason for the red month in December is due to short-term BTC holder .
The NUPL (Net Unrealized Profit/Loss) indicator for short-term holder —which tracks the profit/loss status of recent buyers—remains in the stop-loss zone. The last time this happened was in April 2025, which also marked the bottoming Dip, initiating the rally to $126,000 in October 2025.
This time, the surrender signal has reappeared. On November 21st, the NUPL for short-term holder touched -0.27, even lower than the Dip signal from April. Currently, the index is around -0.14, still within the surrender zone. The Dip signal is there, but no reaction has yet occurred.
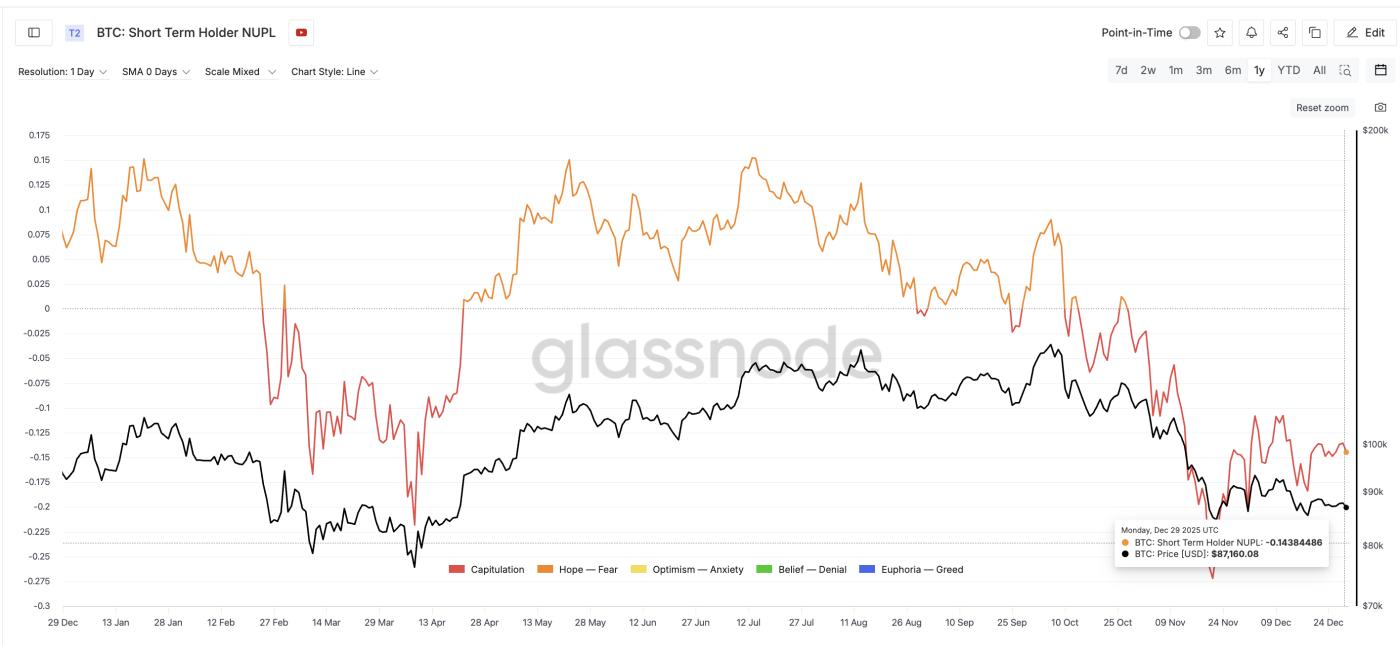 Surrender Index: Glassnode
Speaking to BeInCrypto, Hunter Rogers, co-founder of the global Bitcoin yield protocol TeraHash, emphasized the importance of this indicator:
"If I had to choose one on-chain signal to watch, it would be the behavior of short-term holder versus the stability of long-term holder . As long as long-term holder maintain their confidence, the cycle continues," he Chia .
So if the April crash helped establish a Dip for Bitcoin to reach new highs , the question now is simple:
Why hasn't the same signal generated a similar upward reaction? The answer lies in the actions of long-term holder .
That's also why we move on to the next section: the group of long-term holder and whales—who usually absorb this sell-off—have not yet made a strong comeback this time. To date, they haven't fully returned, weakening the momentum for 2026.
Long-term investors are temporarily withdrawing.
Long-term holder (LTHs) often step in when short-term holder sell off, helping to absorb supply, stabilize prices, and open a new cycle. This happened in April 2025. At that time, the net amount of BTC accumulated by LTHs peaked at 22,237 BTC in just one day, and remained in positive territory throughout the following period. As a result, the price was supported and recovered.
But this time, that "cushion" is much thinner.
Since October 1st, long-term holder have been primarily selling. They have only recently stopped selling, and buying activity has been quite modest. The most recent accumulation peak (December 2025) was only around 4,862 BTC, mostly hovering around 3,500 BTC. That's only about 20% of the strength seen in April.
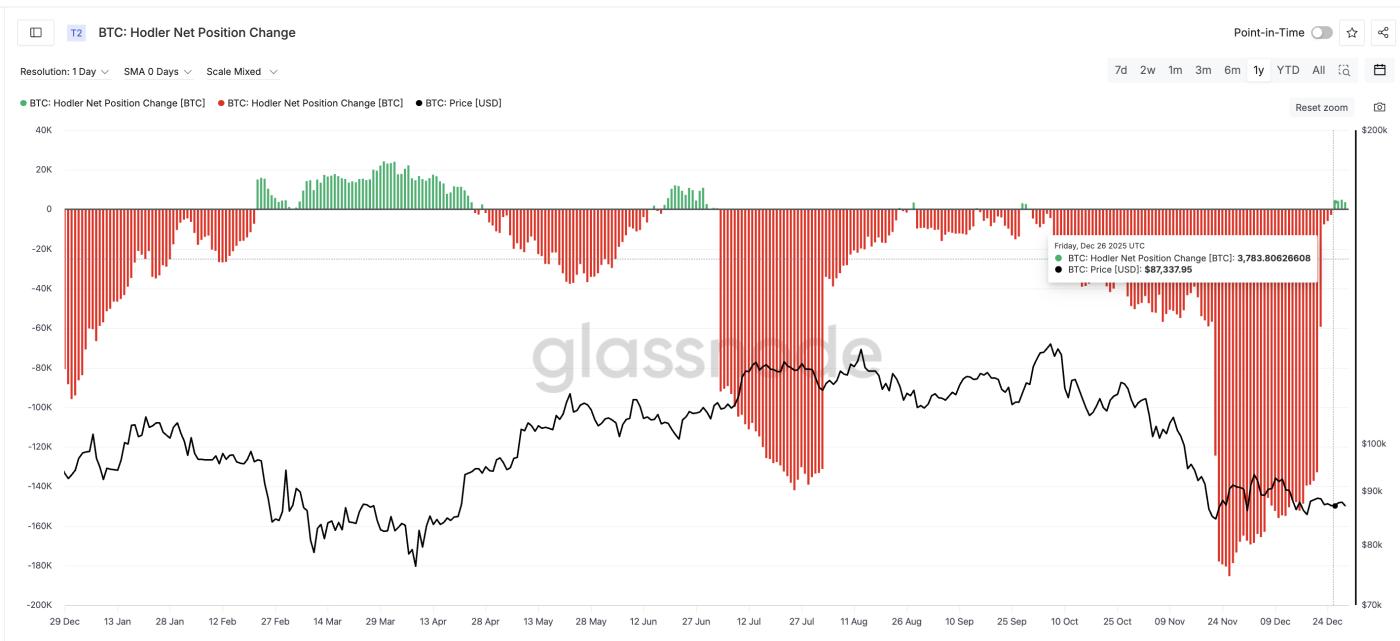 HODLers are back buying: Glassnode
The signals have been more positive, but still not strong enough to turn the market around before 2026.
Rogers went on to analyze the importance of this group to the functioning of the cycle:
"As long as long-term holder maintain their faith, the cycle will not be broken. The continued stability of long-term holder helps Bitcoin stay in a consolidation phase and potentially grow again over time," he said.
Stability is present, but there's a lack of decisiveness. And without decisiveness, major rallies are easily stalled.
The whale was silent, and that changed everything.
And this is the story of the whale.
The number of whale wallets holding between 10,000 and 100,000 BTC is currently at its lowest level this year. These wallets had steadily increased when the price bottomed Dip in April and continued to rise until July. That trend supported the price surge to $126,000. But now the opposite is true. Whales are no longer buying, creating a gap. That's why the November sell-off wasn't strong enough to generate the same strong upward momentum as in April.
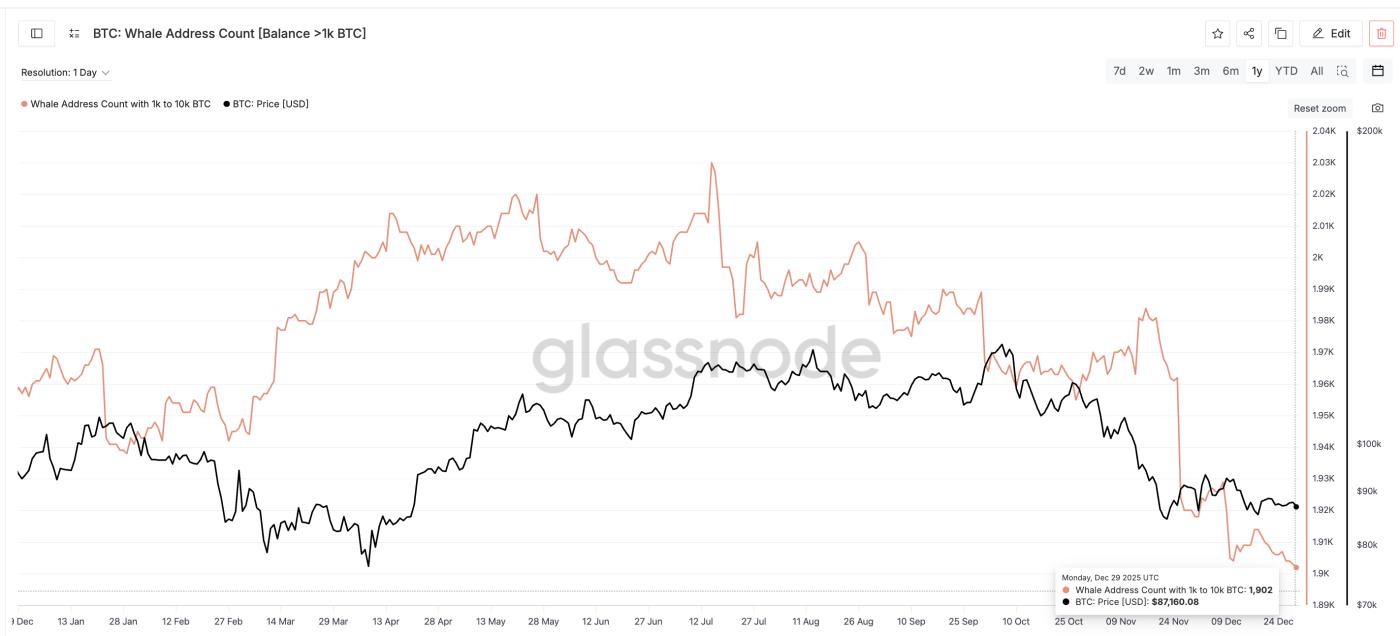 Whales are still conspicuously absent: Glassnode
Rogers also made this clear:
"Retail investors often react late, while whales accumulate all the supply when the market is weak. This pattern repeats itself," he emphasized.
Currently, this is very clear. Short-term capitulation has occurred, but long-term investors and whales are not buying up as they used to whenever BTC price was about to enter a strong upward phase. Whales have yet to act as a "shock absorber" for the market, making BTC more susceptible to sell-offs than breakout price increases.
Rogers also warned that this would directly impact price increase targets:
“Could Bitcoin reach over $150,000 by 2026? It’s possible. But that will require time, liquidation, stronger institutional participation, and patience,” he said.
He also refuted predictions of excessively high price increases:
"The scenarios of Bitcoin reaching $250,000 or more this year are not realistic to me right now," he added.
Thus, his assessment somewhat contradicts the predictions of a sharp increase in Bitcoin prices made by people like Tom Lee or YoungHoon Kim, at least at the present time.
But the crucial question is, despite short-term signs of capitulation, why haven't long-term investors and whales bought aggressively? The answer lies right here on the chart and in the current price structure.
What does the Bitcoin price chart say about 2026?
XEM at the 3-day chart, Bitcoin is currently in a pattern resembling a bear flag.
If measured according to this structure, the risk of a breakdown would reduce the price by approximately 36%. This risk is further increased as the two key EMAs are preparing to cross in a negative direction. EMAs are moving Medium that help react quickly to price fluctuations. The 50-day EMA is gradually approaching the 100-day EMA, and the 20-day EMA is also getting closer to the 200-day EMA.
If both pairs cross each other, it would be a negative sign as BTC is retesting the support zone around $86,420. This explains why whales and large funds remain cautious, reflecting their wary sentiment.
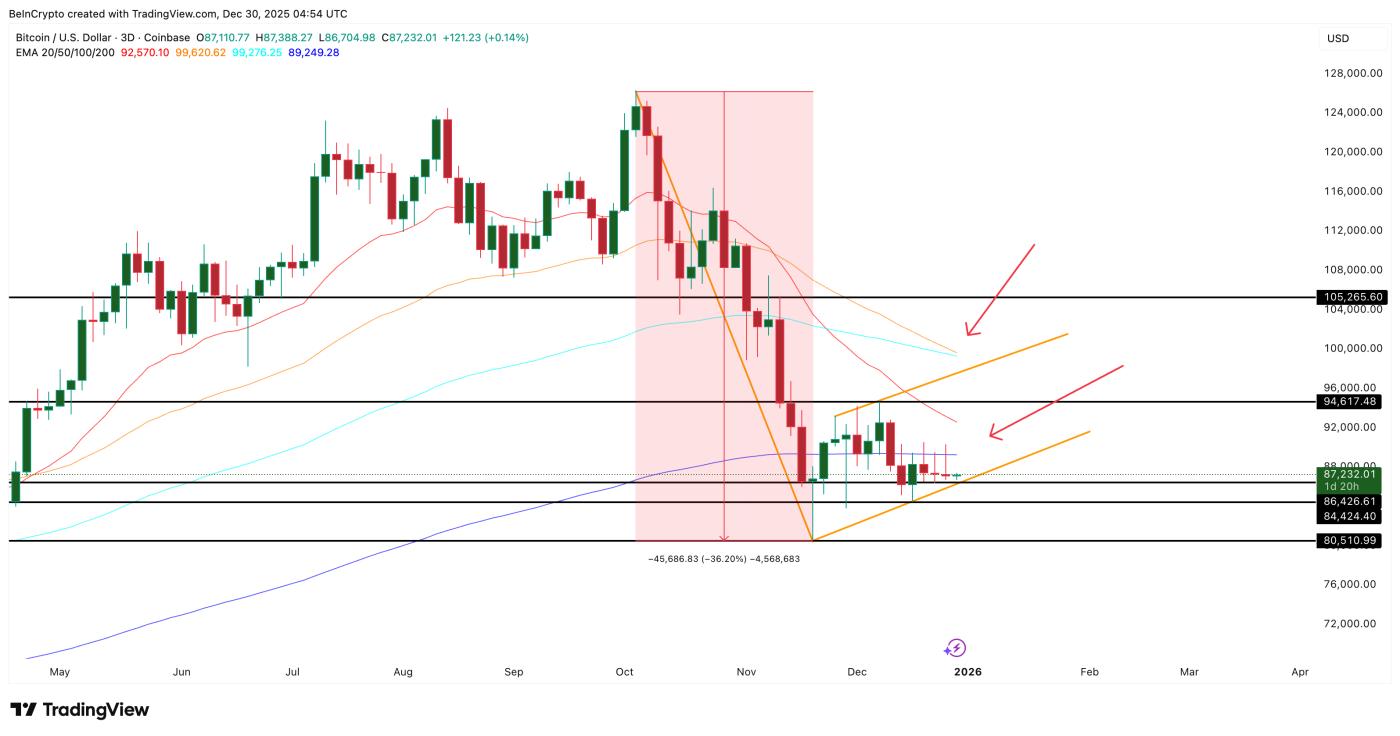 BTC chart shows a downtrend: TradingView
Hunter Rogers Chia the same sentiment with BeInCrypto:
"Bitcoin's volatility in 2026 will most likely be determined by sentiment regarding Capital and risk," he emphasized.
Currently, this sentiment remains "stuck." Whales haven't aggressively disbursed funds, and prices haven't broken out of this narrow trading range.
For Bitcoin to have any hope of a bullish reversal, it needs to break back above the $105,200 level. At that point, the previous sharp decline scenario would no longer be valid. If this is achieved, the previous peak near $126,000 could be tested again, or even surpass it.
According to Rogers:
"The market once peaked at around $126,000, but that alone isn't enough to end a cycle. A cycle ends when there's strong selling pressure below the market's Medium Capital ," he Chia .
This “collective cost of Capital ” is currently hovering around the Medium price already achieved, which is approximately $50,000.
Rogers considered this a crucial boundary for himself:
"As long as prices remain stable above the Medium Capital range around $50,000, the market structure will remain stable," he emphasized.
If prices fall significantly below this level, the outlook will reverse to a bearish one, potentially reaching the lower target of the bearish flag around $38,630. If this scenario occurs, the market structure will be threatened and could drag even long-term investors into losses. On the upside, a break above $105,260 would brighten the market structure.
However, if the price falls below the $50,000 mark, the market structure will be broken. That's why the $58,000 level on the chart is currently extremely important.
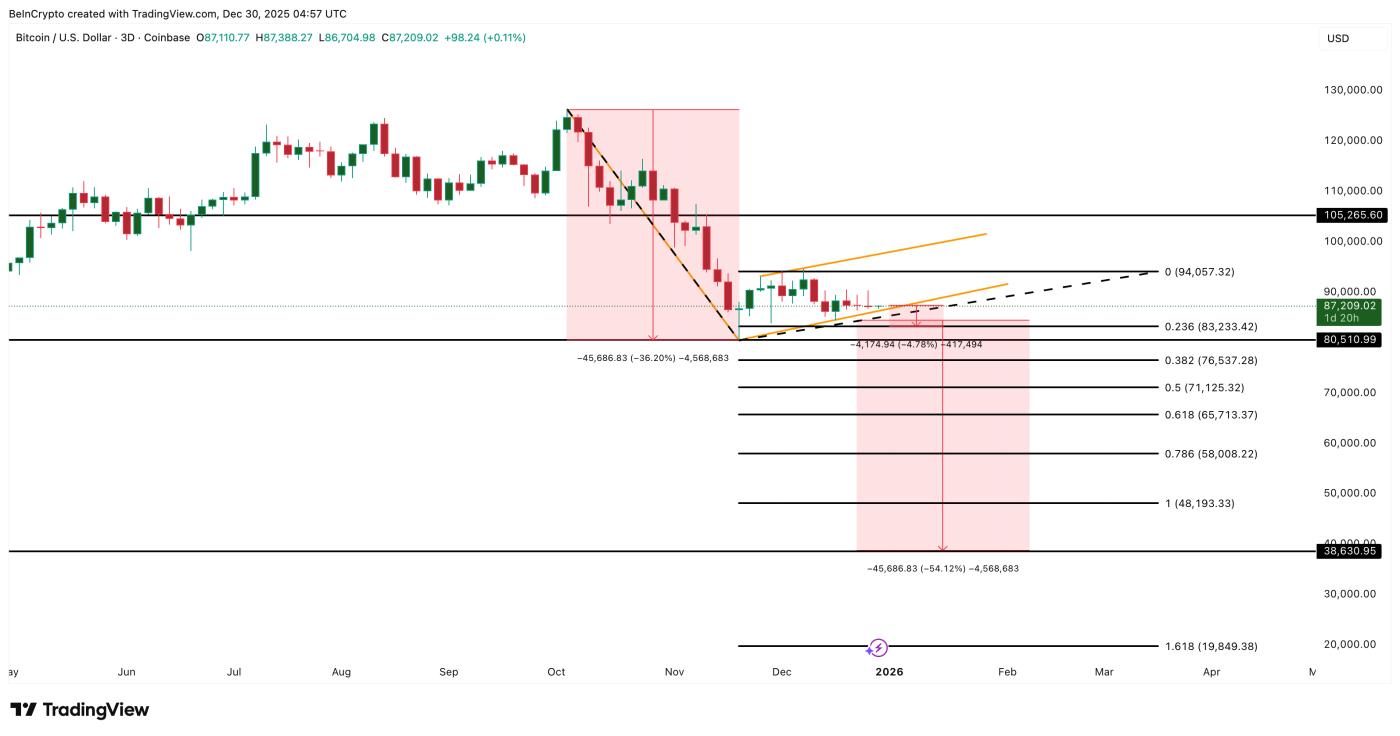 Bitcoin Price Analysis: TradingView
What awaits BTC in 2026?
Currently, the situation with Bitcoin is quite clear and simple:
- A Dip signal has appeared. (Retail investors are selling off)
- The buying pressure that usually appears afterward has yet to materialize. (Boars and long-term holders)
- A bearish pattern is still "hanging in the air." (There is a risk of breaking the bearish flag pattern.)
Whether Bitcoin surpasses $105,000 or breaks below $83,300 could answer the question the market is avoiding: Will 2026 see a new Bitcoin price peak or another sharp decline?


