

Hedera has shown slight signs of recovery in the last few sessions, but HBAR remains constrained below a key technical level. This altcoin is still trading below the 23.6% Fibonacci Retracement, limiting its upward momentum.
While Hedera is preparing for structural changes in 2026, investors remain focused on whether these changes will actually impact HBAR 's price performance.
Hedera increases service fees.
Hedera announced in July 2024 that it would increase ConsensusSubmitMessage transaction fees by 800% starting in January 2026. The fee would rise from $0.0001 to $0.0008. ConsensusSubmitMessage transactions allow users to send data to the Hedera network for transparent timekeeping and order confirmation.
Despite the significant fee increase, the actual cost remains very low. The community has debated the blockchain network's fee adjustments, but this change is considered unlikely to have much impact on network usage. The fee adjustments primarily target businesses and do not significantly affect the cost of use for most applications and ordinary users.
Hedera holders are more pessimistic than optimistic.
Technical indicators suggest that investor sentiment remains quite cautious, even leaning towards negative. The Chaikin Money Flow (CMF) indicator is below zero, indicating a continuous outflow of Capital from HBAR , meaning investors are reducing their portfolios instead of preparing for a recovery.
There are no clear positive signals from the market, making this trend even more apparent. Risk tolerance for altcoins remains low, and HBAR has yet to attract a stable flow of Capital . Unless there are major changes in the situation, this negative Capital flow trend could continue into 2026.
Want to receive more information about Token like these? Sign up for editor Harsh Notariya's daily crypto market newsletter here .
 HBAR CMF. Source: TradingView
Derivative data also shows weak market momentum. The liquidation map shows that traders are currently primarily betting on downside risk. HBAR 's Short positions reached approximately $8.21 million, while Longing positions were only around $4.5 million.
This divergence indicates that bearish bets are dominating the market. Traders seem more confident in the possibility of a sharp price drop rather than a strong rebound. When the market is so unbalanced, the bearish price swings are often larger, especially during periods of low liquidation or when significant negative news emerges.
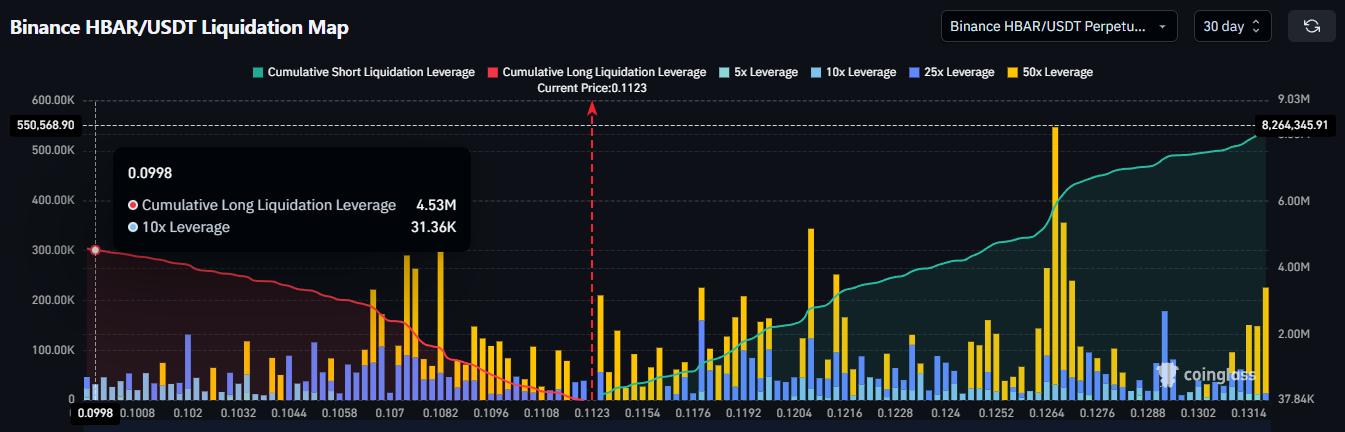 HBAR liquidation map. Source: Coinglass
The HBAR price needs to break through and hold this crucial support level.
At the time of writing, HBAR is trading at $0.112, still holding above the nearest support level of $0.109. However, the price is struggling to break above the resistance zone near the 23.6% Fibonacci Retracement line around $0.115. This area continues to be the strongest resistance zone, limiting any further price increases.
Current technical signals and on-chain data suggest that a strong recovery is unlikely. The likelihood of HBAR continuing to trade sideways above $0.109 is much higher than the likelihood of a strong breakout. This narrow price range reflects weak buying demand and a lack of significant interest from retail investors in the current market conditions.
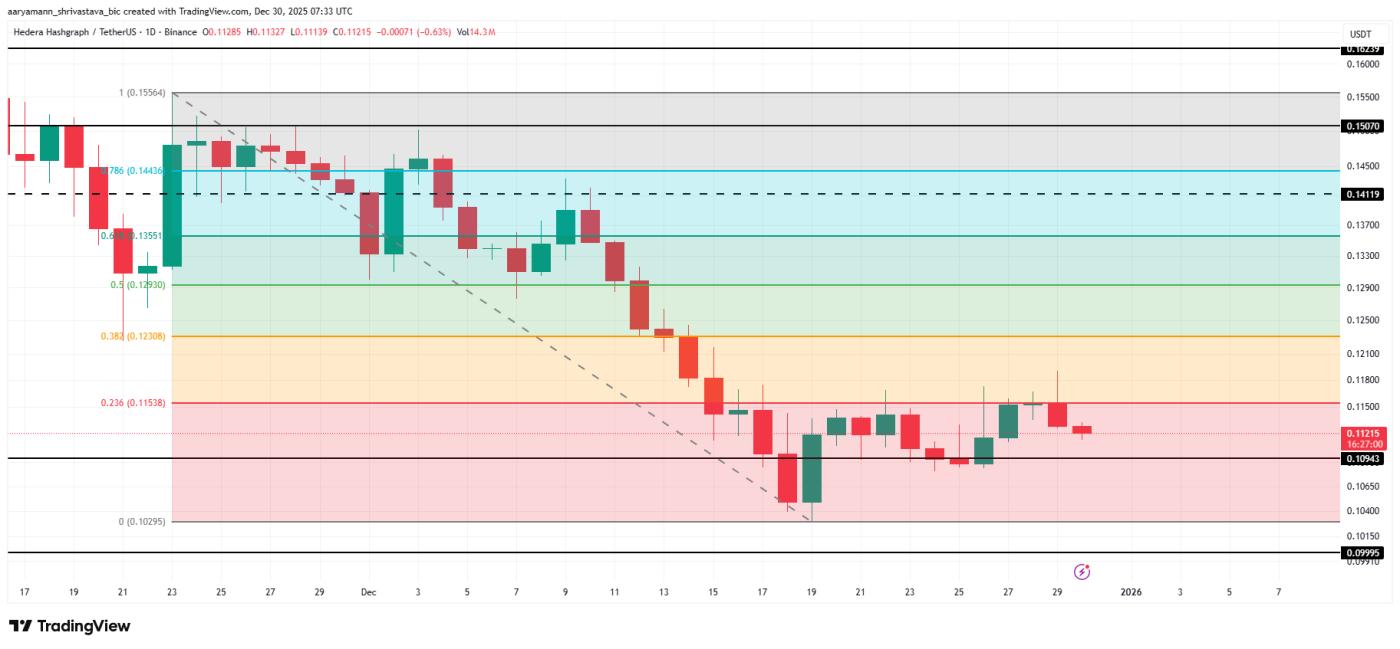 HBAR price analysis. Source: TradingView
A major shift in the global cryptocurrency market could alter current perceptions. If the overall market returns to a strong uptrend, HBAR could benefit from new capital inflows from risk-averse investors. If it breaks through the 23.6% Fibonacci resistance level and turns it into solid support, HBAR could target a new price level of $0.120.


