

Bitcoin's price enters 2026 still locked in a battle between buyers and sellers, similar to the sluggishness that lasted until the end of 2025. Over the past 30 days, the price has remained largely flat, only slightly declining by about 0.6%, indicating that neither side has yet gained a clear advantage.
On an annual basis, prices are still down around 7%. This balance creates a tug-of-war in the market. However, a fluctuation of just 1% or even 3.5% in the current situation, when properly timed, could significantly alter the price trend.
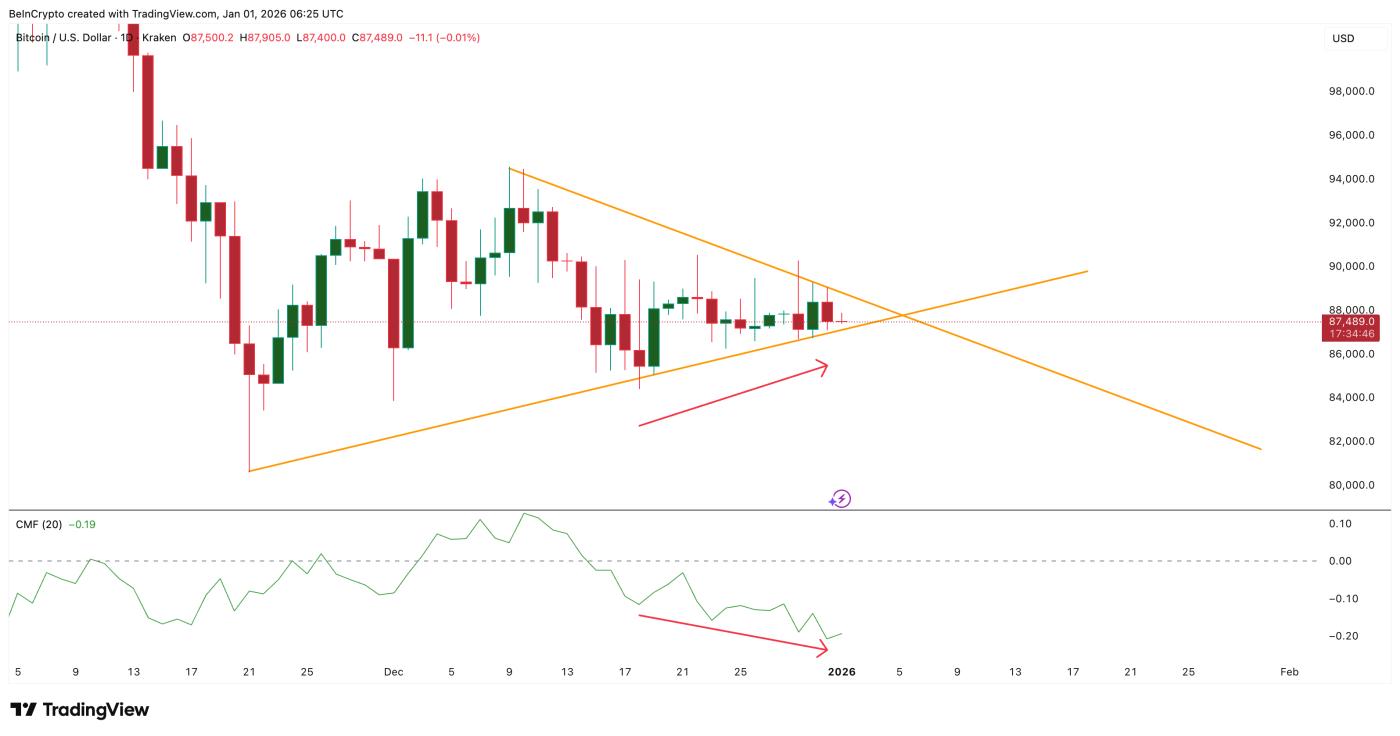
Buying and selling pressure meet inside an symmetrical triangle pattern.
Currently, Bitcoin is trading within an isosceles triangle pattern on the daily chart. This signals market indecision with progressively lower highs and higher Dip , indicating strong competition between buyers and sellers. Capital inflows are not yet strong enough to support an uptrend.
The Chaikin Money Flow (CMF) indicator has been trending downward since December 10, 2025. For those unfamiliar, the CMF assesses the amount of money flowing into or out of an asset. Currently, the CMF shows a bearish divergence, as while the price of BTC increased from December 18 to December 31, the CMF formed lower Dip , indicating continued outflow of money and persistent selling pressure.
 Outflow of Capital : TradingView
Want to read more analytical information about the Token? Sign up for the Daily Crypto newsletter from editor Harsh Notariya here .
However, the outflow of Capital from the market is somewhat helping to balance the aforementioned selling pressure.
Changes in net positions on exchanges indicate the amount of coins withdrawn from exchanges – often a sign of accumulation. On December 19, 2025, the amount withdrawn was approximately 16,563 BTC. By January 1, 2026, this number had increased to 38,508 BTC.
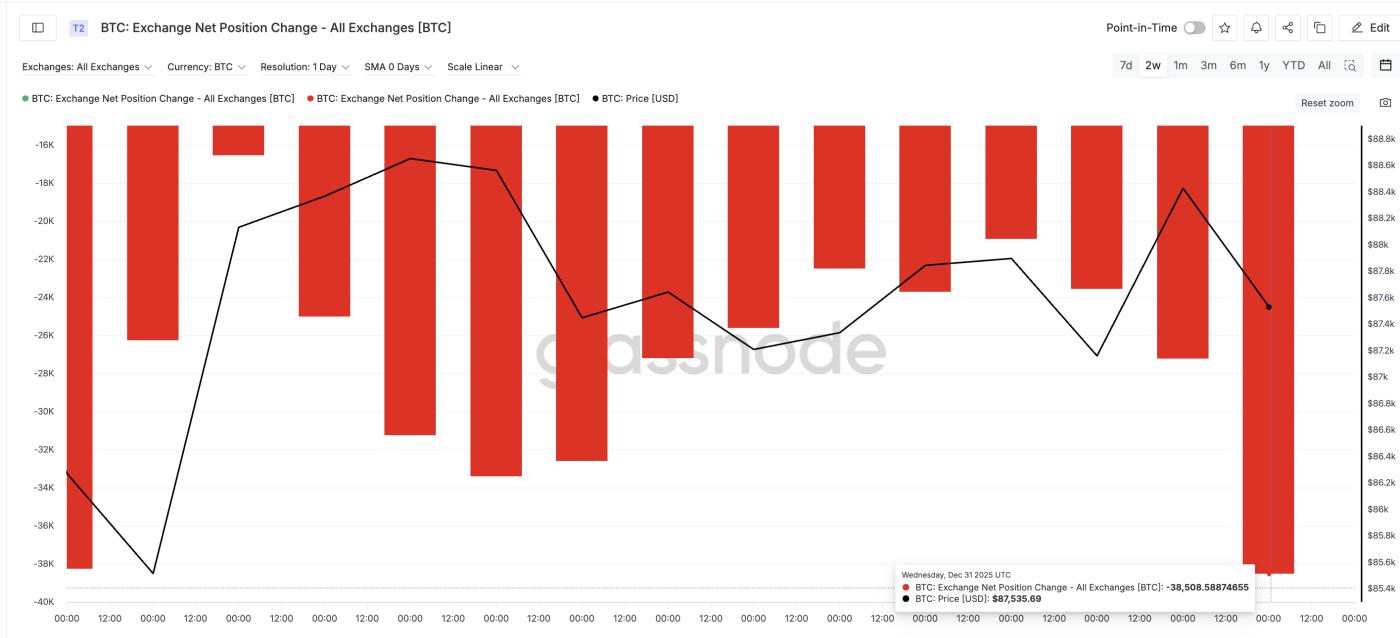 Increased buying pressure: Glassnode
This represents an increase of approximately 132%. The delisting of many coins from exchanges helped maintain price stability and protect the lower trendline of the triangle pattern.
Smart money shows hesitation.
The Smart Money Index also shows no clear trend. The Smart Money Index compares the actions of large traders with the majority of the market. Currently, this indicator line is close to the signal line, showing no clear separation. This suggests that large traders are still waiting for a breakout rather than leaning toward any particular trend.
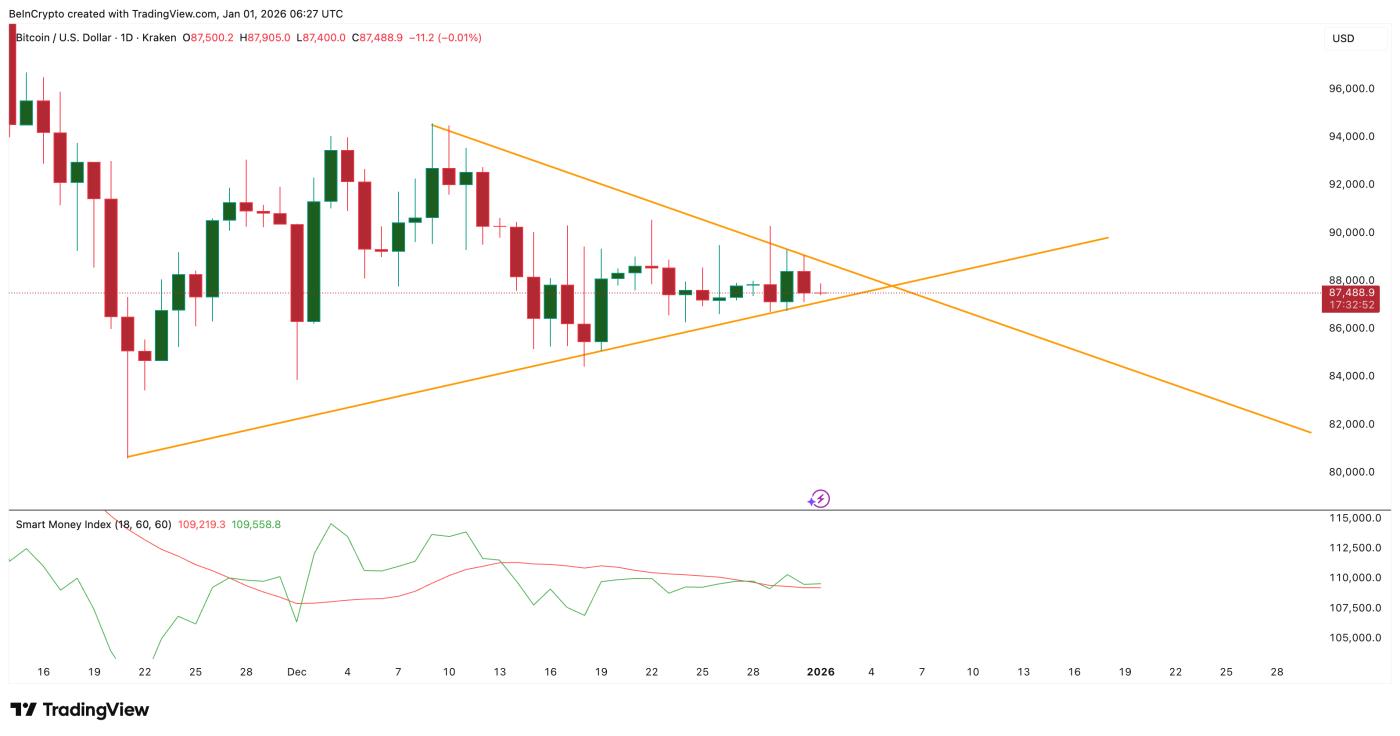 Even Smart Money isn't clear on the trend: TradingView
Until a breakout occurs, the triangle pattern remains neutral.
This result is quite similar to CMF data and coin flow on exchanges: outflows represent pressure, while withdrawals from exchanges help support the price. When these two factors work together, they balance each other out and keep the BTC price stable . Even experienced traders can't predict which side will prevail.
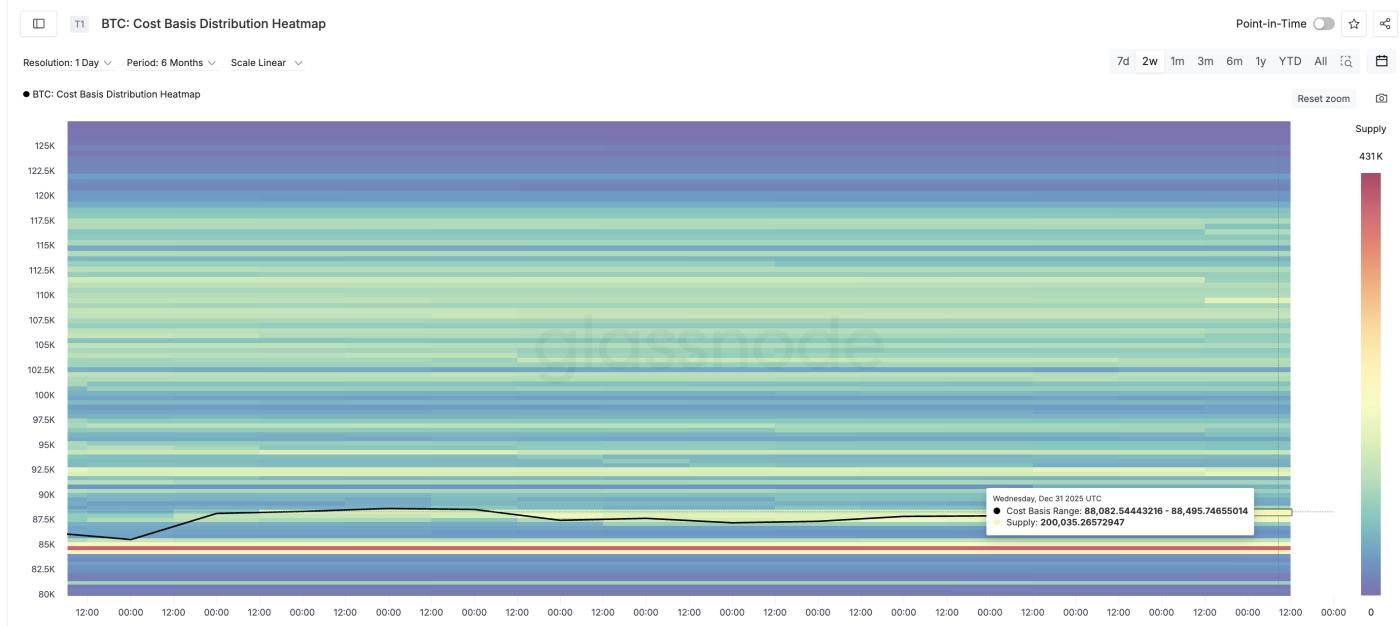
Bitcoin heatmap and price levels reveal activation phase.
The Capital price heatmap shows price clusters where many last-time buyers have purchased. These clusters often Vai as support or resistance levels. The nearest resistance zone is around $88,082 to $88,459, where approximately 200,035 BTC are currently held.
 BTC Heatmap: Glassnode
Bitcoin is currently trading around $87,480. If it closes the day about 1% higher, the price will break above that resistance zone. This could be the first bullish signal and provide momentum for breaking the upper edge of the triangle pattern. On the BTC price chart, the area coinciding with this cluster is $88,300, which needs to be broken first.
The support zones below appear to be more solid in the short term. The first support zone is located at approximately $84,449 to $84,845, where about 396,645 BTC are currently held.
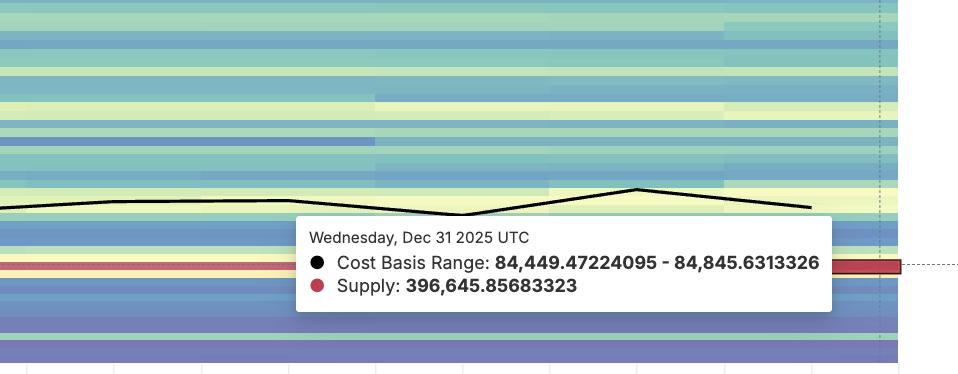 Support cluster for BTC: Glassnode
On the price chart, the nearest support level to this Capital zone is at $84,430. Bitcoin's price would need to drop by approximately 3.5% to retest this area. Therefore, the confirmation signal for a downtrend is lower, and further price movement is needed for a definitive conclusion.
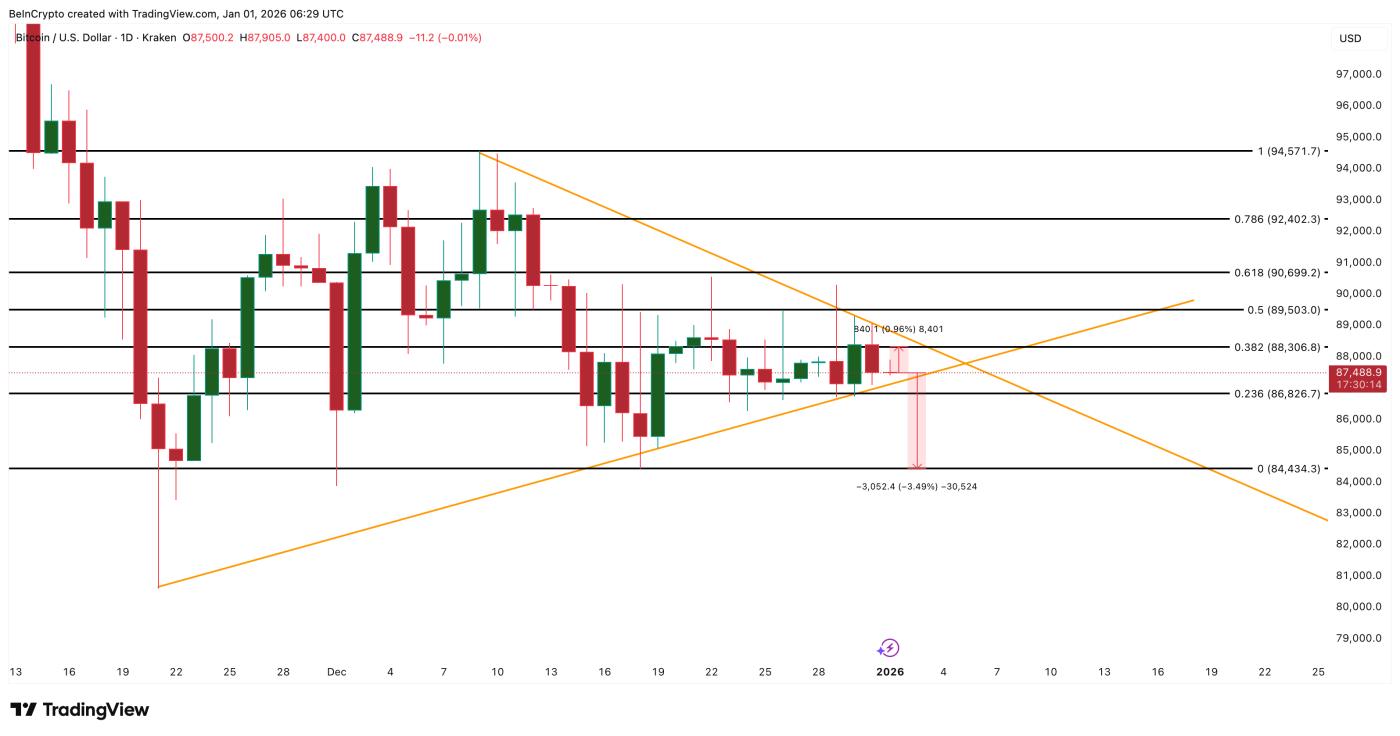 Bitcoin Price Analysis: TradingView
Both charts and heat maps show the same result. If Bitcoin breaks above $88,300, the first bullish signal will appear. When the daily candle closes above this level, the next target will be $89,500, then $90,690. Conversely, if it loses the $84,430 level, the trend will completely reverse to a bearish direction, indicating that sellers have gained the upper hand.


