Zcash entered 2026 after one of the strongest rallies in the market, currently up approximately 53% in the last 30 days and over 780% year-on-year. Zcash 's trend remains within an uptrend channel, but the recent minor correction has tested the buyers. This decline stemmed from profit-taking, not a trend breakdown.
New buying pressure, improved cash flow, and a key support zone are helping to maintain Zcash's breakout structure.
Retail investors bought on dips, absorbing selling pressure even when the trend line was broken.
Zcash is currently trading within an ascending channel, with progressively higher highs and Dip confirming the upward trend. By December 29, 2025, the price was pushed back by the upper trend line, causing a temporary pause in the upward momentum. This correction resulted in a nearly 10% drop (to be discussed later) between December 29 and 31, 2025, but the overall price structure remained intact.
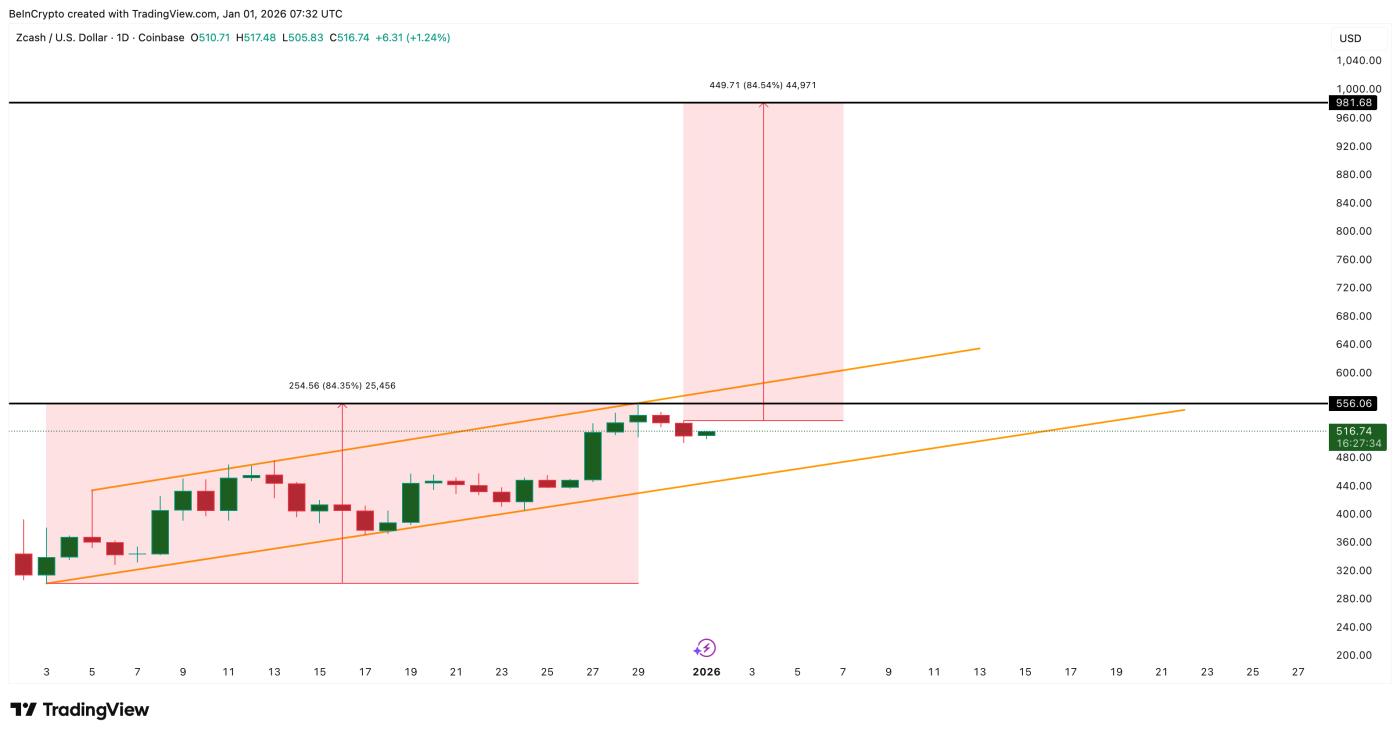 Zcash's breakout structure: TradingView
Want more Token analysis? Sign up for editor Harsh Notariya's daily Crypto Newsletter here .
The recent price drop may be due to profit-taking by a segment of retail and institutional investors. On December 29, 2025, exchanges recorded inflows of $38.22 million, followed by $7.88 million on December 30, 2025. The green lines indicate selling pressure at this time.
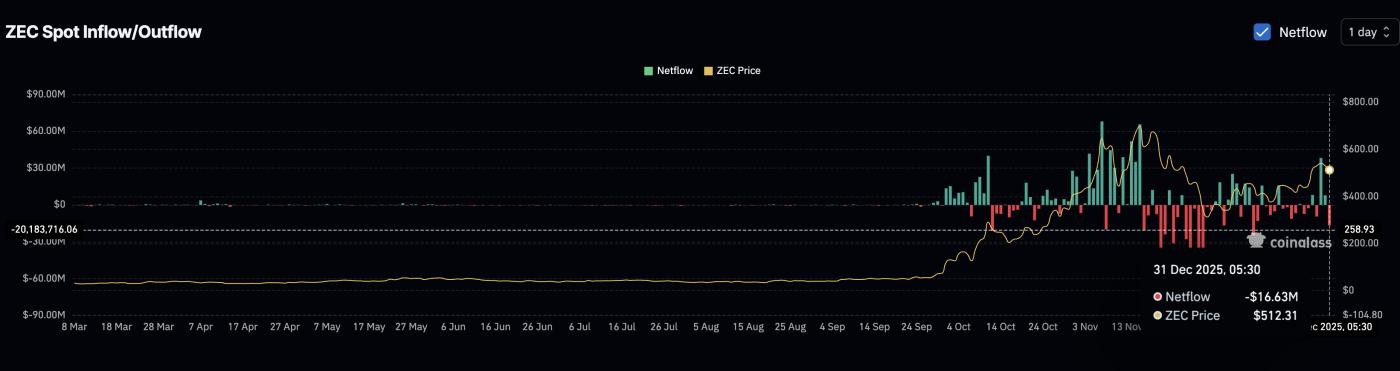 Zcash spot cash flow: Coinglass
However, buying sentiment returned on December 31, 2025, when outflows from exchanges reached $16.63 million, indicating that investors took advantage of the price drop to buy more and offload supply. As a result, the price of Zcash rebounded.
The Money Flow Index (MFI) also confirms this. The MFI measures the flow of money into or out of an asset based on volume and price. From December 29th to December 31st, 2025, this index increased despite falling prices – coinciding precisely with the period when investors were aggressively taking profits (spot money flowing into the market).
This is a bullish divergence, indicating that investors are taking advantage of the dip to accumulate shares, rather than withdrawing from the market. They have helped to offset some of the selling pressure from those taking profits.
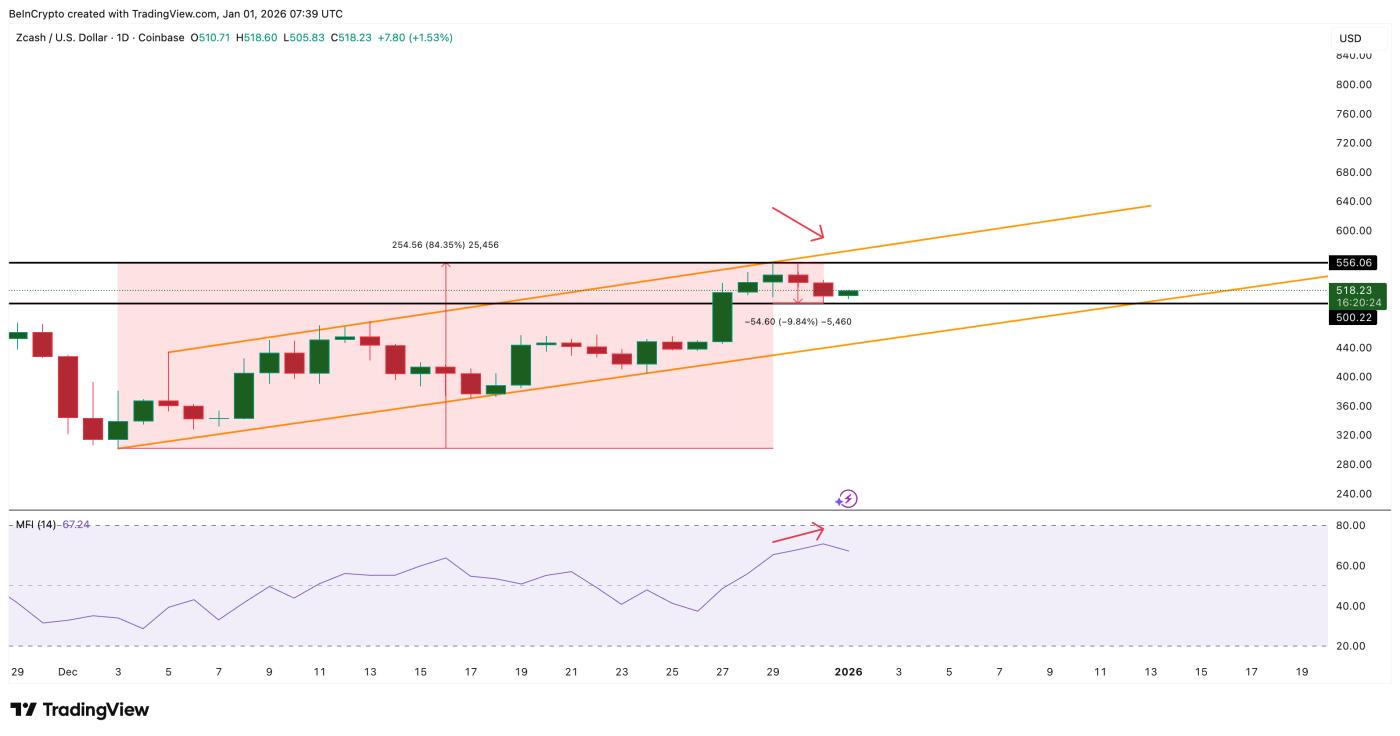 Investors continue to buy during price corrections: TradingView
As long as the price of ZEC remains above the support zone around $500 , the bullish structure remains valid – especially as the MFI continues to rise and spot money flow remains skewed towards the buying side.
Key price levels for Zcash to confirm a breakout.
The first challenge for the buyers is whether the price can close the day above $559, which would confirm the return of the uptrend. To achieve this, the price of Zcash needs to increase by approximately another 8%.
If the price surpasses $559, the next price zone to watch is $596–$626. This is XEM the “breakout window” for Zcash . If it breaks through this zone and depending on its current position within the price channel, the next targets could be $657 and $699 respectively. Such a surge would help maintain the expectation of an 84% upward move within the channel.
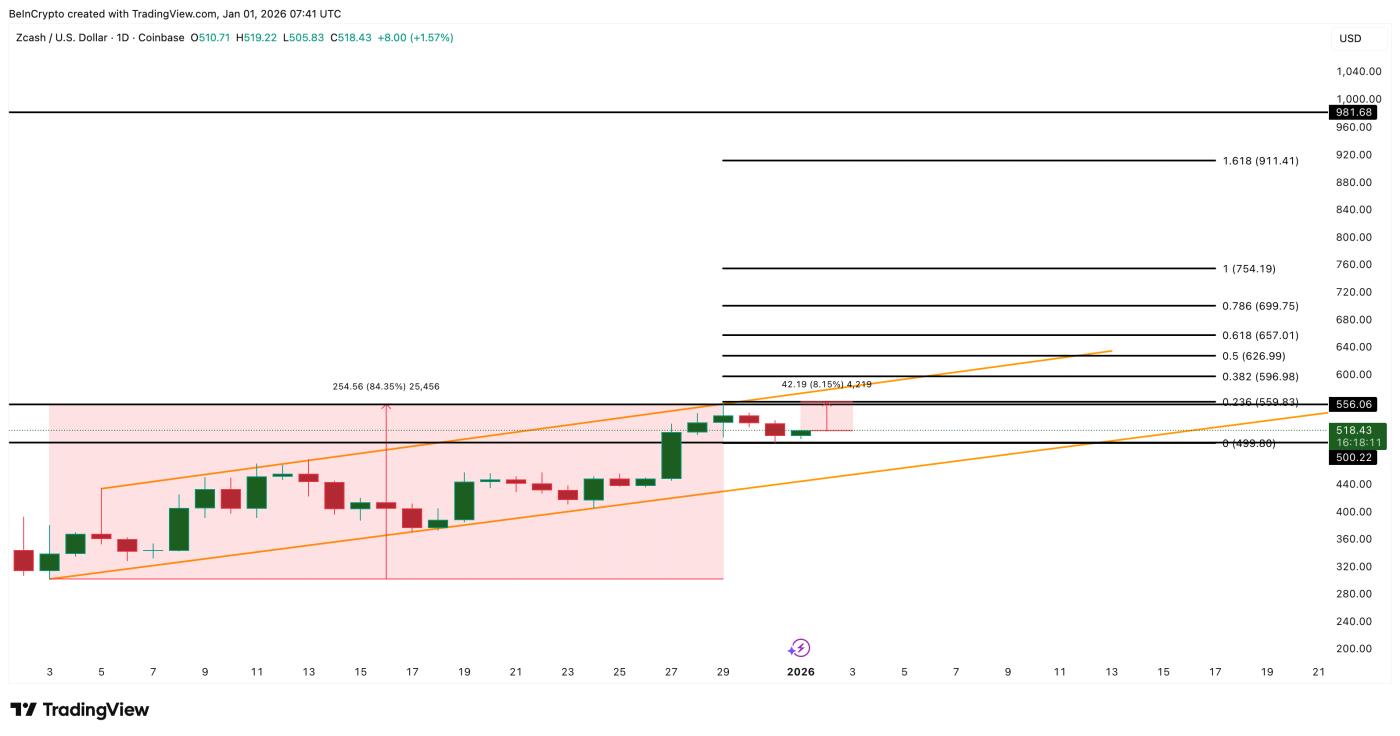 Zcash price analysis: TradingView
If the price of Zcash breaks below $500 (with the daily closing price well below this level), market sentiment will weaken and the uptrend structure will be easily broken. At that point, it will be crucial to XEM whether the lower trendline within the price channel provides support or is breached. Until this happens, buyers are still in control of the market.