

Most of the cryptocurrencies have returned to the green zone, according to CoinStats.
SHIB/USD
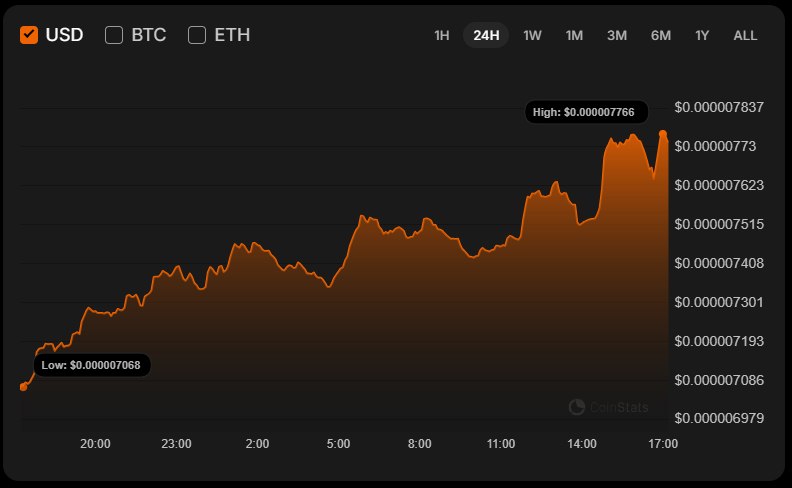
The price of SHIB has increased by almost 10% over the last 24 hours.
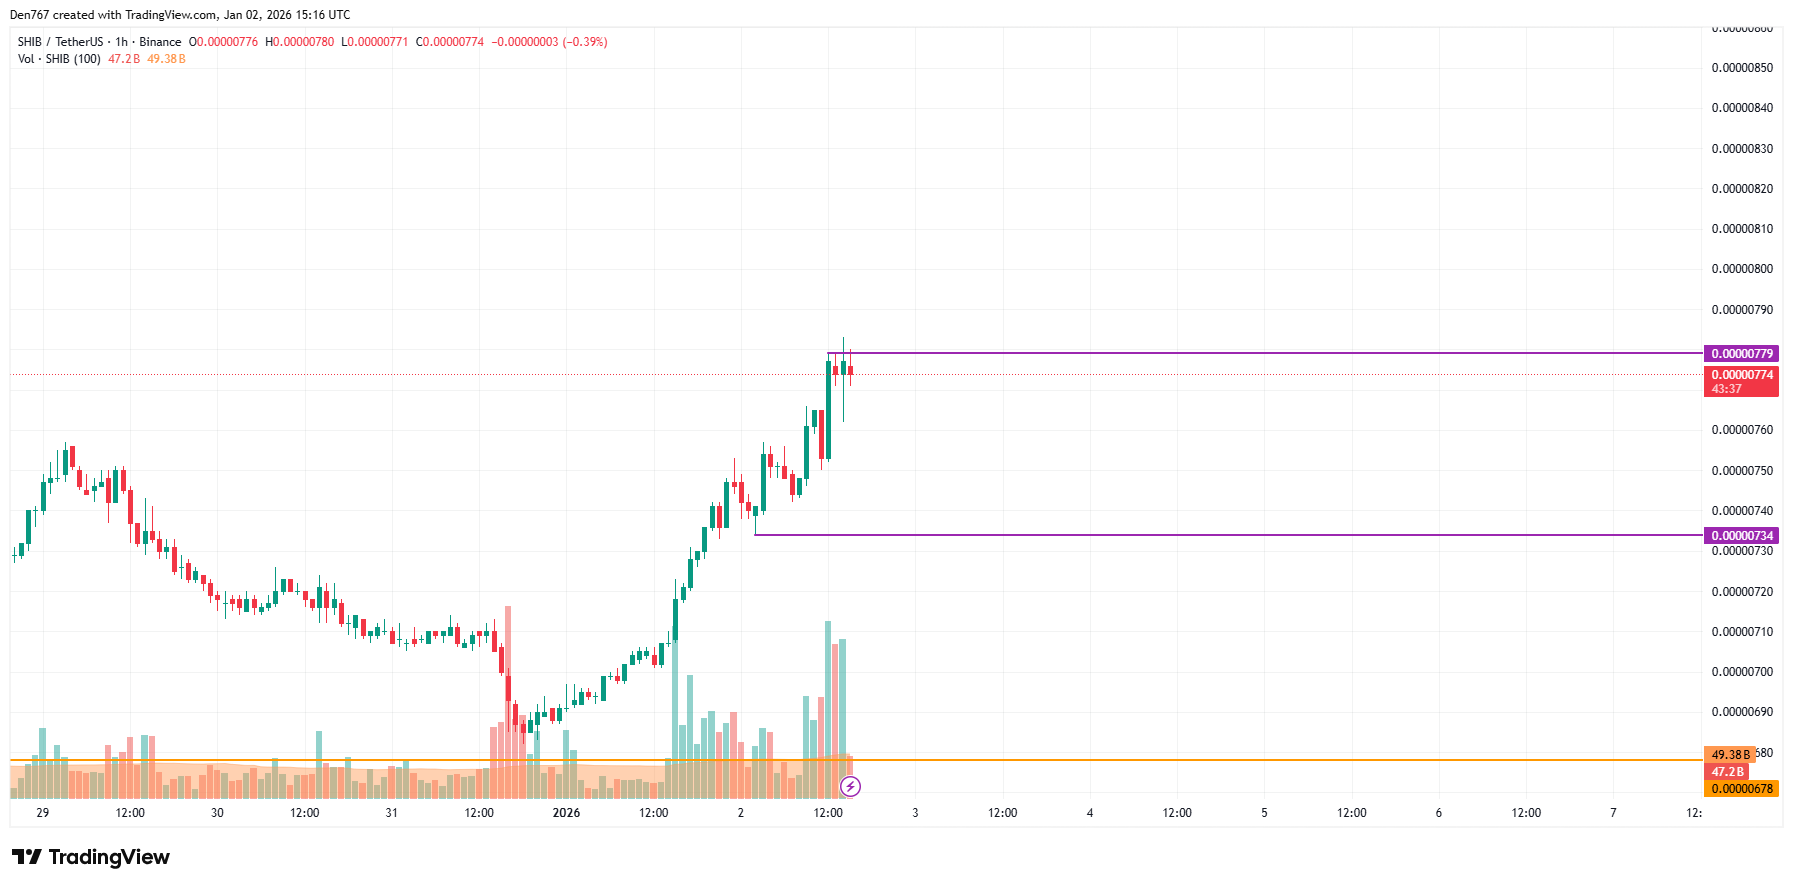
On the hourly chart, the rate of SHIB has made a false breakout of the local resistance at $0.00000779.
However, if buyers can hold the gained initiative and the daily candle closes near that mark or above, there is a chance to see a test of the $0.0000080 zone soon.
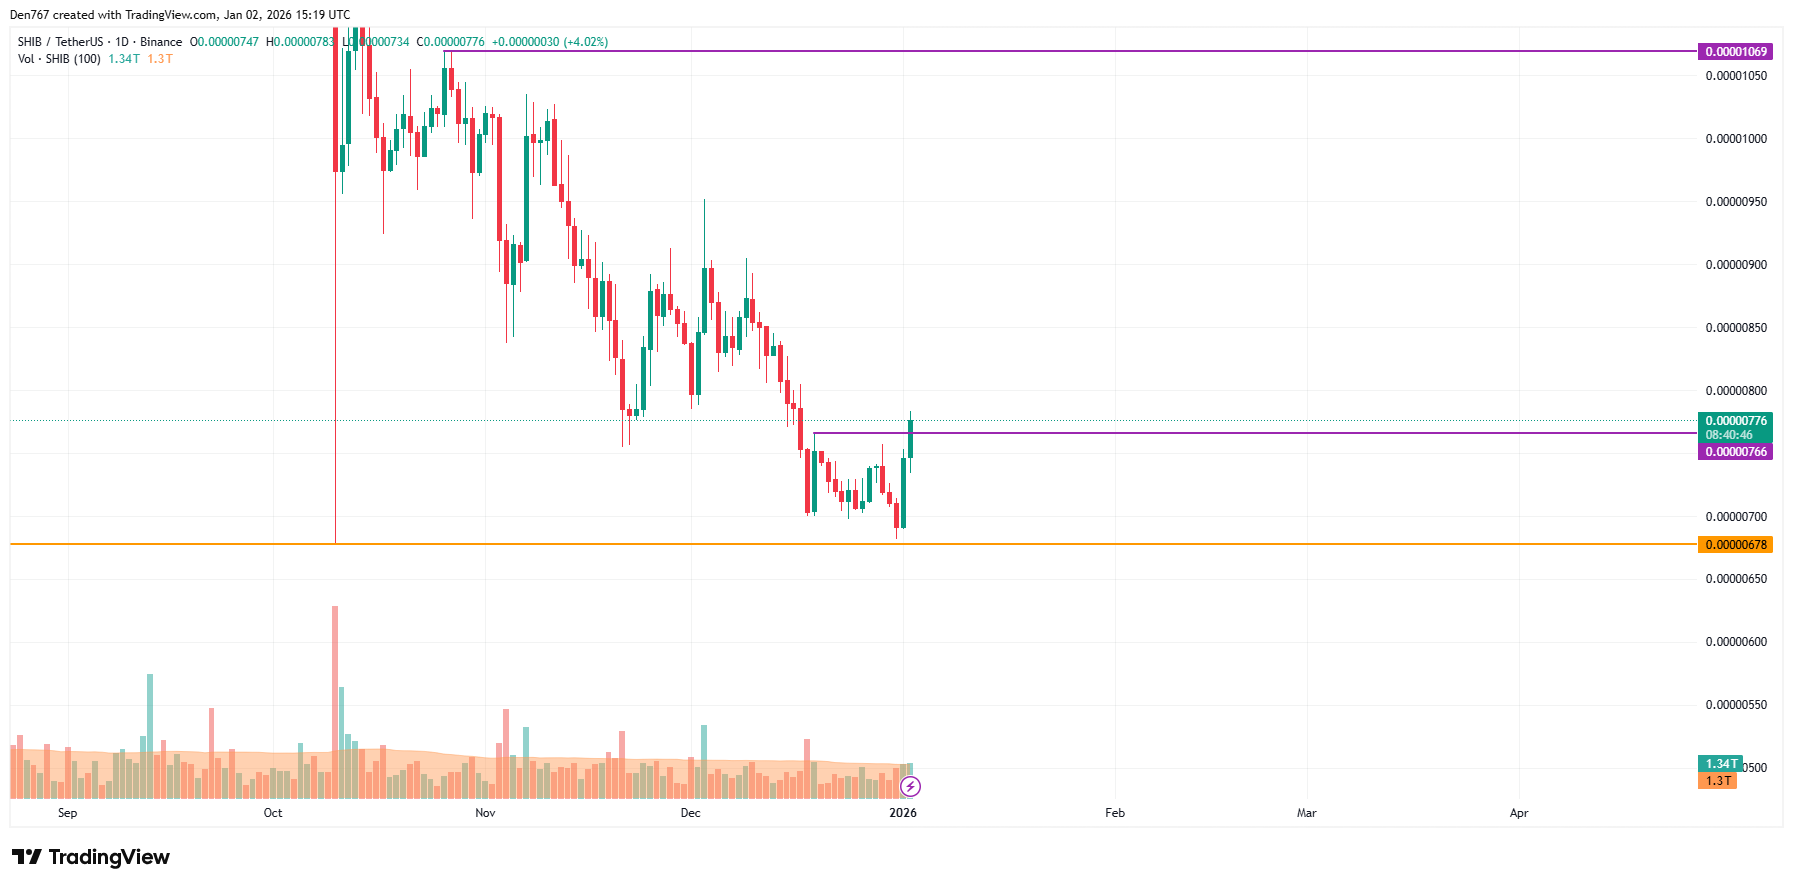
On the bigger time frame, traders should focus on the nearest level of $0.00000766. If the candle closes with a short wick and above that mark, the energy might be enough for a further upward move to $0.0000080.
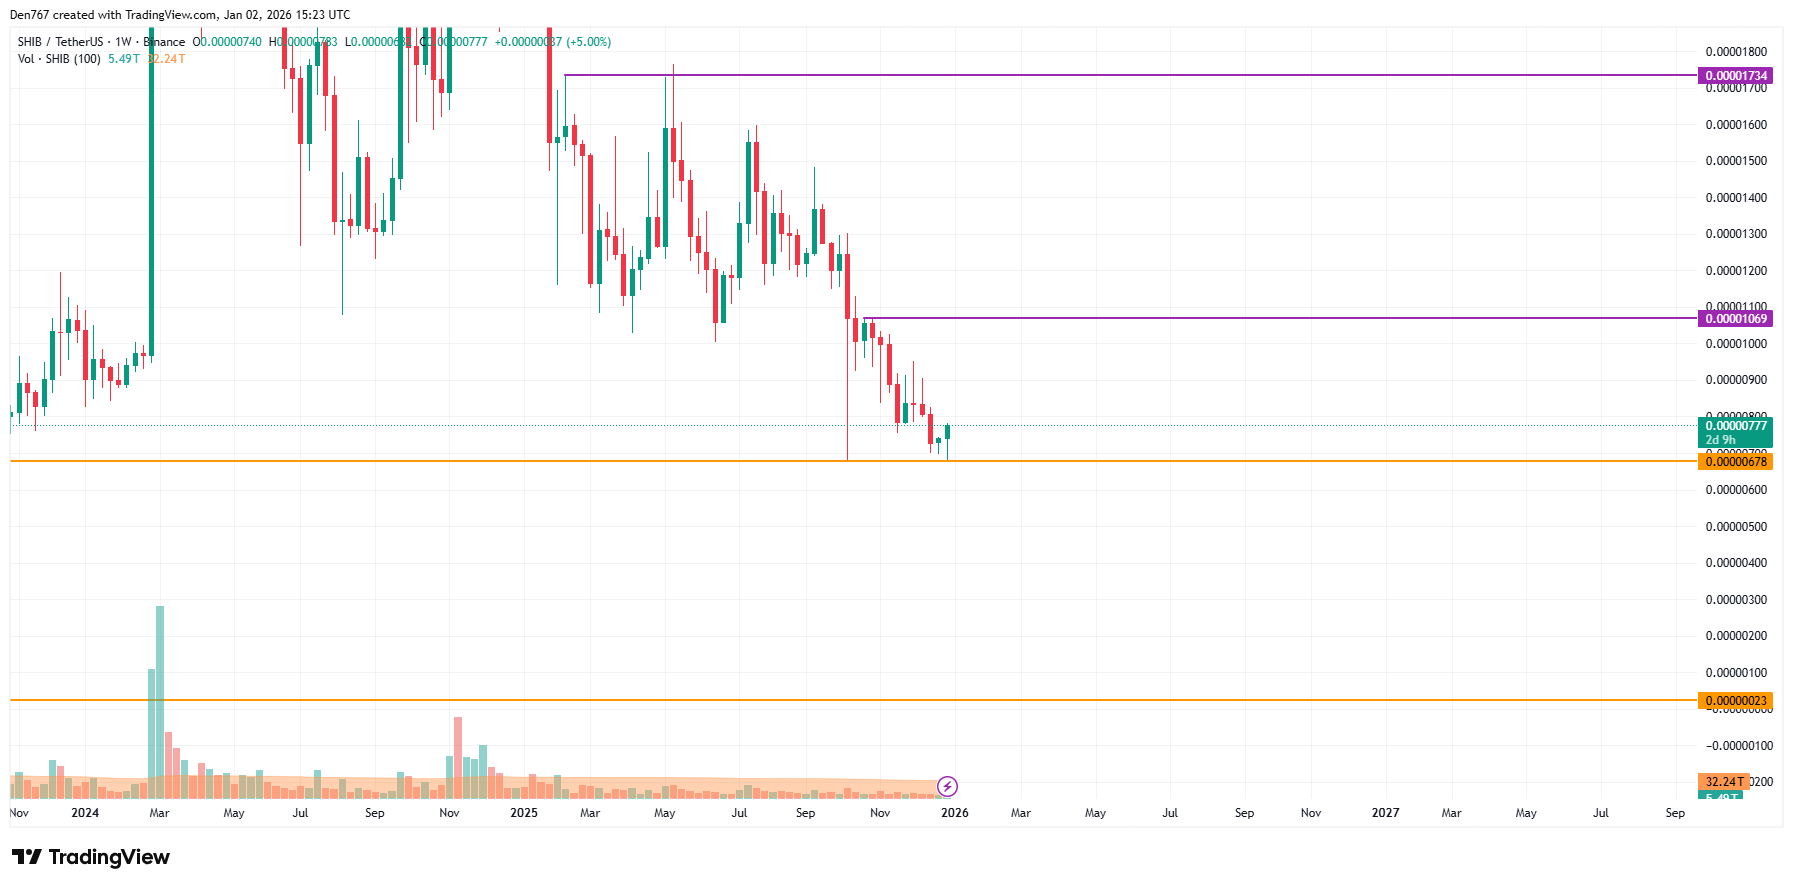
From the midterm point of view, the price of SHIB has once again bounced off the support at $0.00000678. If the weekly bar closes far from that mark, there is a possibility to witness growth to the $0.0000080-$0.0000090 range by mid-January.
SHIB is trading at $0.00000779 at press time.


