

Ethereum's price is approaching a critical technical point as it trades near the upper edge of a Falling Wedge pattern. ETH has been rising slowly but steadily, and is now not far from a key breakout point.
This surge is largely due to the Fusaka update, which officially went live on December 3, 2024, aiming to help the Ethereum network scale better and reduce the cost of Layer 2 – a long-standing issue on Ethereum.
These changes come at a time when investors are preparing for 2026, creating favorable conditions for network growth and a more stable ETH price.
Ethereum investors demonstrate strength.
Ethereum network activity has expanded rapidly over the past three weeks. Data shows that the number of new wallet addresses – that is, wallets interacting with ETH for the first time – has increased by over 110%, indicating an increasingly rapid rate of new user acquisition.
Ethereum is currently recording approximately 292,000 new wallet addresses per day. This growth is a result of both seasonal factors and network infrastructure upgrades.
The Christmas atmosphere of 2025, the end of the year, and the belief in the Fusaka upgrade are driving renewed interest in the Ethereum ecosystem.
Want to receive more information and analysis on Token like this? Sign up for editor Harsh Notariya's daily Crypto Newsletter here .
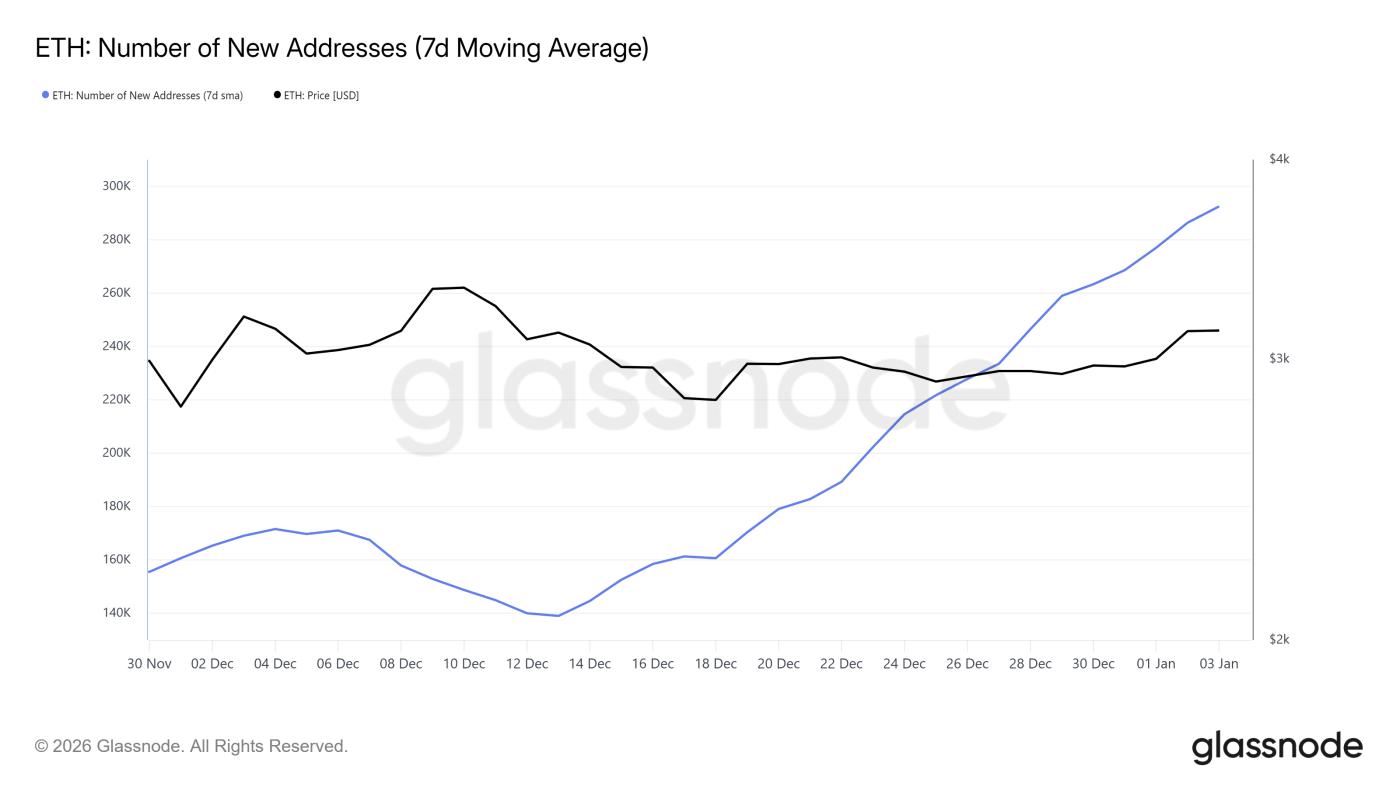 New Ethereum address. Source: Glassnode
An increase in the number of new addresses usually indicates that transaction demand will soon surge. While not all addresses belong to long-term investors, such large-scale network expansion demonstrates growing appeal. The increased user base will lead to better liquidation and support more stable ETH prices during market fluctuations.
Being forced to hold it, but still beneficial for ETH.
Macro indicators for ETH provide a picture that is both multifaceted and fairly clear. The HODL Waves indicator shows that the group of medium-term investors – that is, wallets holding ETH for 3 to 6 months – is increasing. The majority of them purchased ETH between July and October 2025.
Investors who bought in early July are now profitable, while those who bought after mid-July are still at a loss. This allocation forces many to continue holding, waiting for the price to recover before selling. This temporarily reduces selling pressure and supports the price of ETH during market corrections.
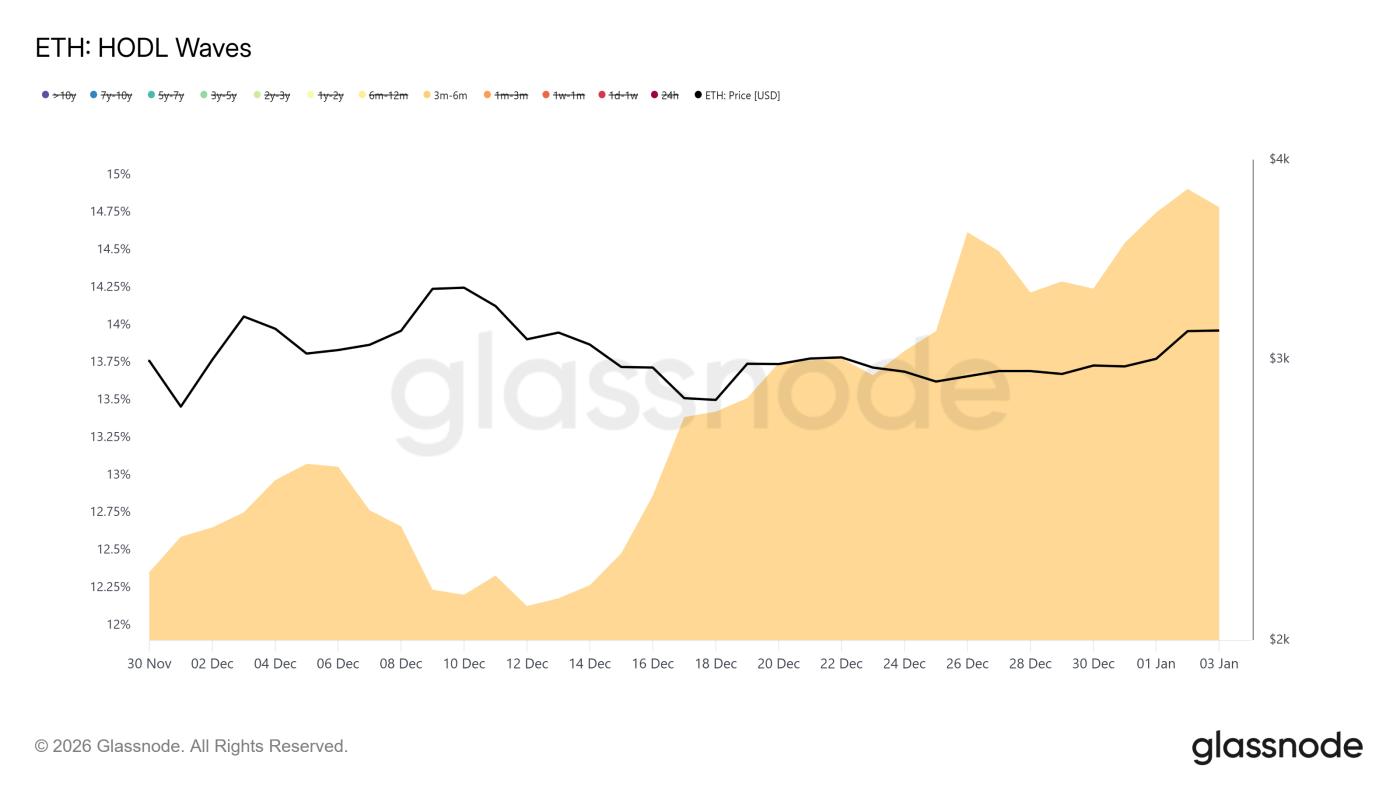 Ethereum HODL Waves chart. Source: Glassnode
However, if ETH price rises sharply, these groups may sell to take profits. As ETH approaches the break- Capital point for medium-term investors, the risk of selling increases. The price could then struggle if there isn't new capital inflow to offset the profit-taking from this trapped supply.
ETH price is approaching a breakout.
Ethereum's price is currently moving within a Falling Wedge pattern formed in early November 2024. ETH is trading around $3,141 – very close to a breakout point. When the price moves sideways in such a narrow range, significant volatility is often expected afterward.
This wedge pattern suggests that if a successful breakout occurs, ETH could rise by approximately 29.5%, targeting $4,061. However, achieving this would require stronger buying pressure than currently seen. A more plausible scenario is that ETH breaks out of the Falling Wedge , surpassing $3,287, potentially advancing to the $3,447 region in the short term.
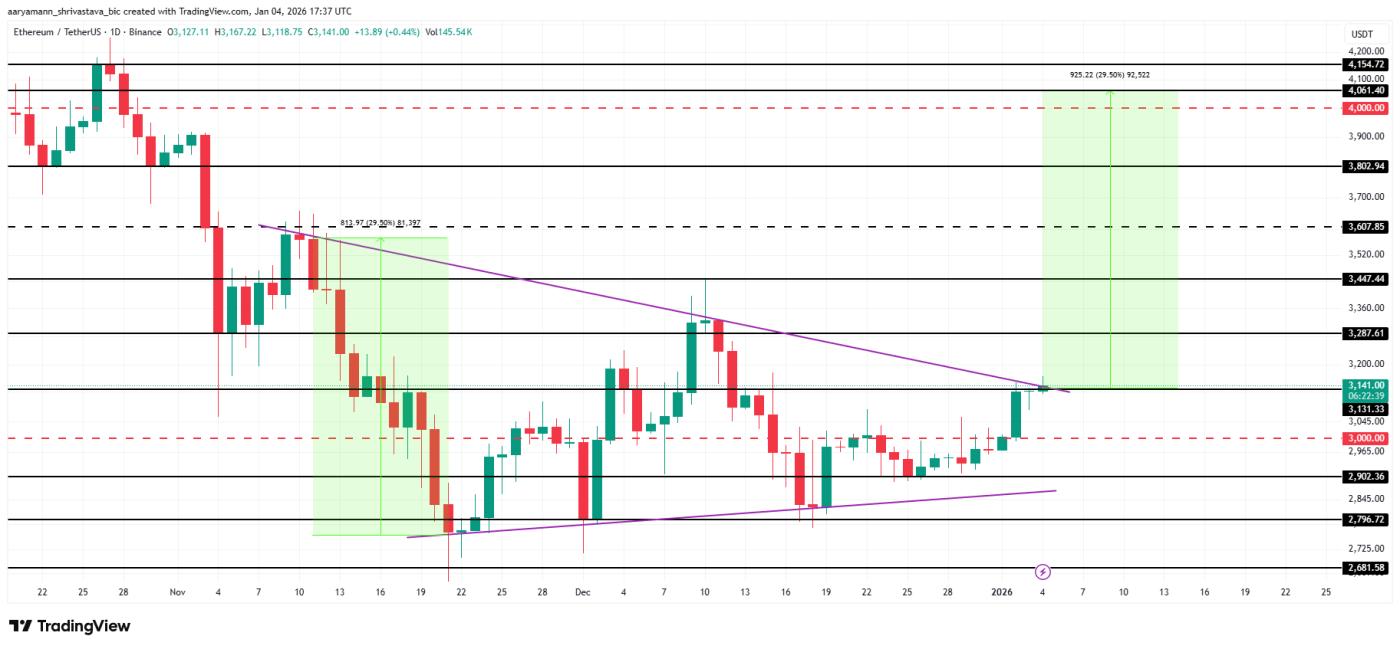 ETH price analysis. Source: TradingView
The downside risk remains if the macroeconomic situation worsens or ETH fails to break through the resistance wedge. If rejected at this level, Ethereum could fall below $3,000. In that case,ETH could retest the $2,902 support zone, breaking the bullish outlook and pushing ETH back into a narrow sideways trend.


