

Onyxcoin's price has surged nearly 52% in the last 24 hours, bringing its total increase over the past 7 days to over 100%. When a Token experiences such a sharp increase, many retail investors often ask the big question: Is this just a short-term price manipulation driven by leverage, or is it a surge driven by genuine demand?
Market information currently leans towards the second scenario. Although volatility remains high, many indicators suggest this rally is not random. Volume, cash flow, and Derivative data all indicate a strong market activity, but one that is not yet overheating. Let's explore this further based on the actual charts below.
A breakout of the trend and volume confirms support from the buyers.
The breakout of XCN price above all exponential moving Medium (EMAs) did not happen in isolation. On the daily chart, Onyxcoin has broken above several key resistance zones and established a potential crossover between the EMAs, signaling a possible uptrend is forming.
Exponential Moving Medium (EMAs) help to smooth price data and prioritize recent price movements. When the 20-day EMA approaches and potentially crosses above the 50-day EMA, this usually indicates a strengthening trend. Currently, XCN is very close to this crossover point, reinforcing the view that the market has clearer upward momentum.
Volume also confirms this upward momentum. The On-Balance Volume (OBV) indicator – which tracks the inflow and outflow of money into the asset – has broken above the extended downtrend line. The increase in OBV along with price suggests strong buyer participation, not just due to forced liquidation of positions.
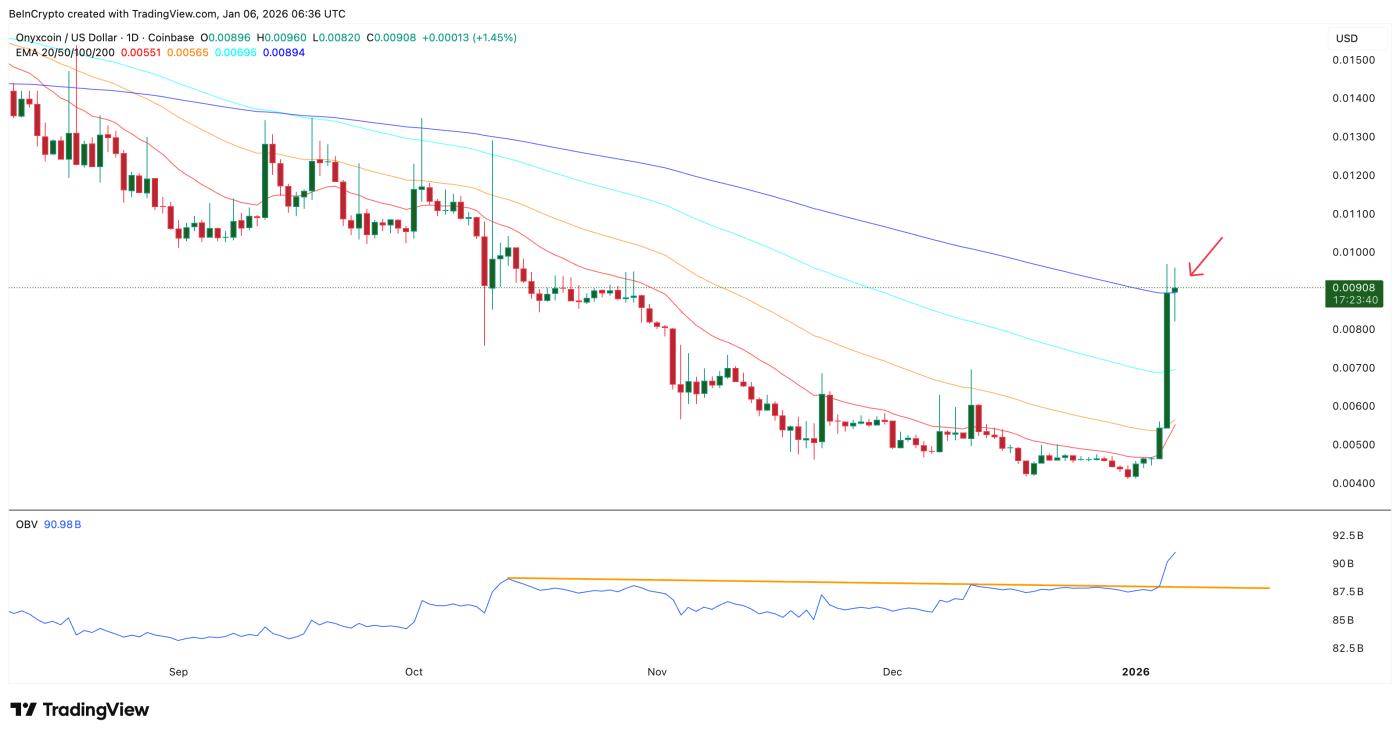 Volume support: TradingView
Want to Also Read Token analyses like this? Sign up for Editor Harsh Notariya's Daily Crypto Newsletter here .
Recent candlestick patterns also show long upper and lower wicks, indicating active buying and selling, but the price remains in the high range.
Combining signals from the EMA and the breakout of the OBV, this price surge is more likely to stem from genuine demand in the spot market, not just short-term scalping.
The inflow of Capital indicates that the upward trend is still supported and the bubble has not yet peaked.
To determine whether large investors will participate, Capital inflow is always a more important factor than price.
The Chaikin Money Flow (CMF) indicator helps determine XEM money is flowing into or out of an asset. When the CMF stays above 0, it means that buying pressure remains dominant.In XCN , the CMF consistently increased while the price decreased from October to early January 2024.
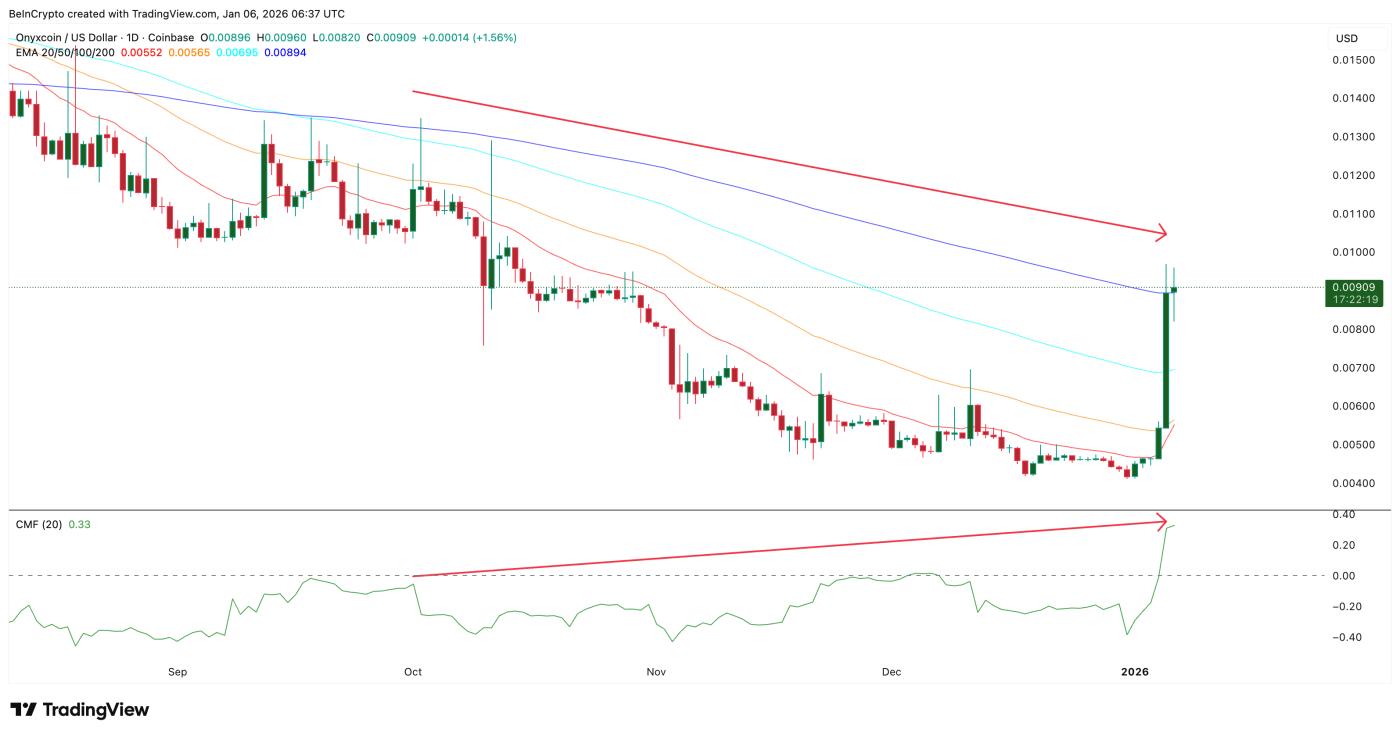 Increased cash flow: TradingView
This difference is noteworthy. Money quietly flowed in even when XCN prices were falling. When prices broke upwards, CMF remained high, confirming that strong buying pressure was real, not just a speculative trend.
The alignment between price, volume (OBV), and cash flow (CMF) eliminates the risk of the classic "bull trap." Strong rallies lacking volume and cash flow often reverse quickly – something that hasn't happened with Onyxcoin yet.
Derivative products and the price of Onyxcoin will determine the next trend.
Leveraged price surges often collapse quickly if the market is skewed in one direction. However, this has not happened with Onyxcoin.
On XCN's perpetual futures liquidation map, the ratio between Short and Longing positions is fairly balanced. The total accumulated Short liquidation value is approximately $1.58 million, while Longing is around $1.36 million. Neither side has a clear advantage, so the risk of a sharp price reversal is reduced, and the market is operating stably.
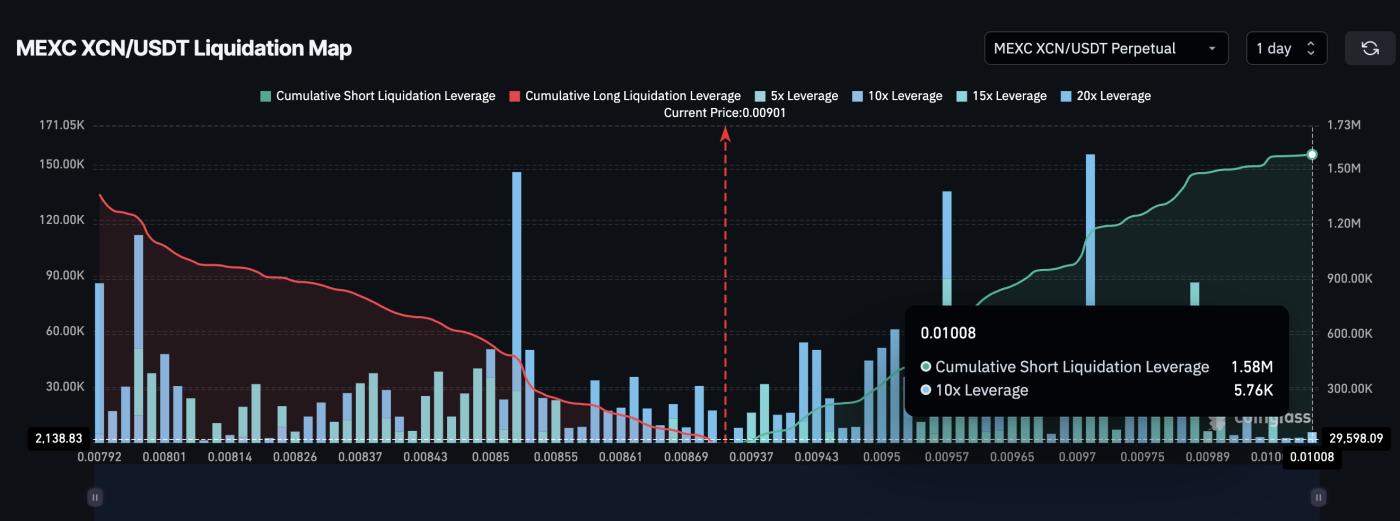 XCN Leverage Map: Coinglass
Now, attention shifts to key price zones.
According to Onyxcoin's price analysis , XCN is currently retesting the resistance zone near $0.0095 (which has been rejected twice before). If the price breaks through and holds above this level, the likelihood of reaching $0.0110 is quite high – representing an increase of approximately 21% from the current price, and coinciding with a Fibonacci extension level.
Conversely, maintaining above $0.0084 is quite important. If this level is broken, the price could quickly retreat to $0.0074 due to the closure of Longing positions. However, if this happens, it is more likely to be a correction rather than a trend reversal – as long as volume and Capital flows do not decrease sharply.
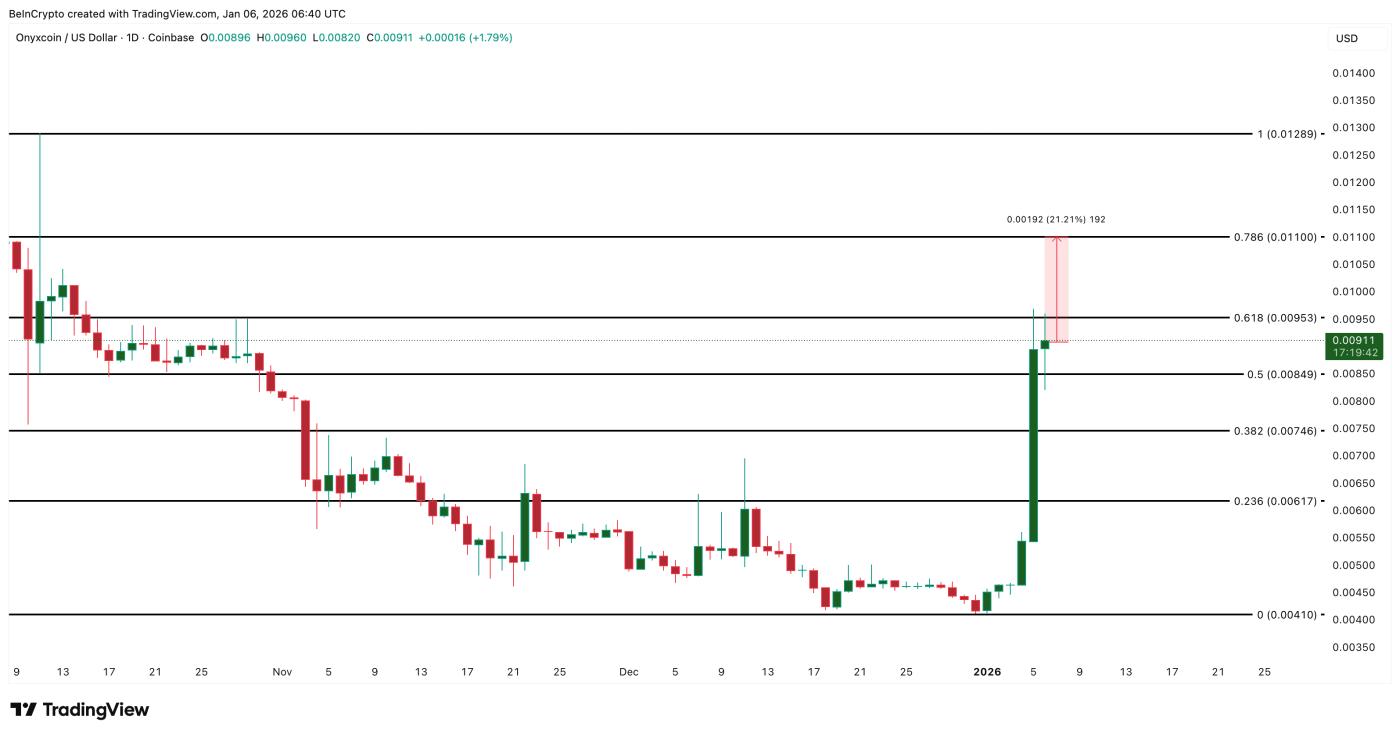 Onyxcoin Price Analysis: TradingView
After a 100% surge last week, caution is understandable. Currently, the XCN chart shows that this upward momentum is still being supported. However, whether the price will continue to rise sharply will depend on how the price reacts around the resistance zone, not on the previous increase. Currently, the key level for Onyxcoin to bounce up further is at $0.0095.


