

Sui price has surged nearly 17% in the last 24 hours and approximately 37% in the last seven days, making it one of the strongest short-term gainers in the market. This surge comes after weeks of sideways movement and has re-attracted interest from bullish investors.
However, the bigger picture remains crucial. Sui is still down approximately 61% year-on-year, meaning this rebound is only part of a larger recovery effort, not a confirmation of a long-term uptrend. Recent price strength is real, but new data suggests profit-taking is increasing. Currently, Sui 's upward momentum depends on the ability of buyers to defend at the $2.00 level.
The Triple Bottom pattern and breakout above the EMA give buyers temporary control.
On the 12-hour chart, Sui has formed a clear triple Dip pattern around $1.30. This means the price has tested this support zone three times since the beginning of November but has failed to break below it. Such action typically indicates that the selling pressure has weakened and buyers are consistently stepping into support.
The upward momentum really strengthens when Sui crosses above the 100-period exponential moving Medium (EMA) on the 12-hour chart. EMAs place more weight on recent volatility, so when the price crosses back above a long-term EMA, this usually signals a significant change in market trend.
Currently, Sui is approaching the 200-period EMA, coinciding with the important psychological level of $2.00. This area also serves as strong technical resistance. If the 12-hour candle closes above this level, buyers will further consolidate their control of the uptrend.
Want to stay updated on similar Token analyses? Sign up for editor Harsh Notariya's Daily Crypto Newsletter here .
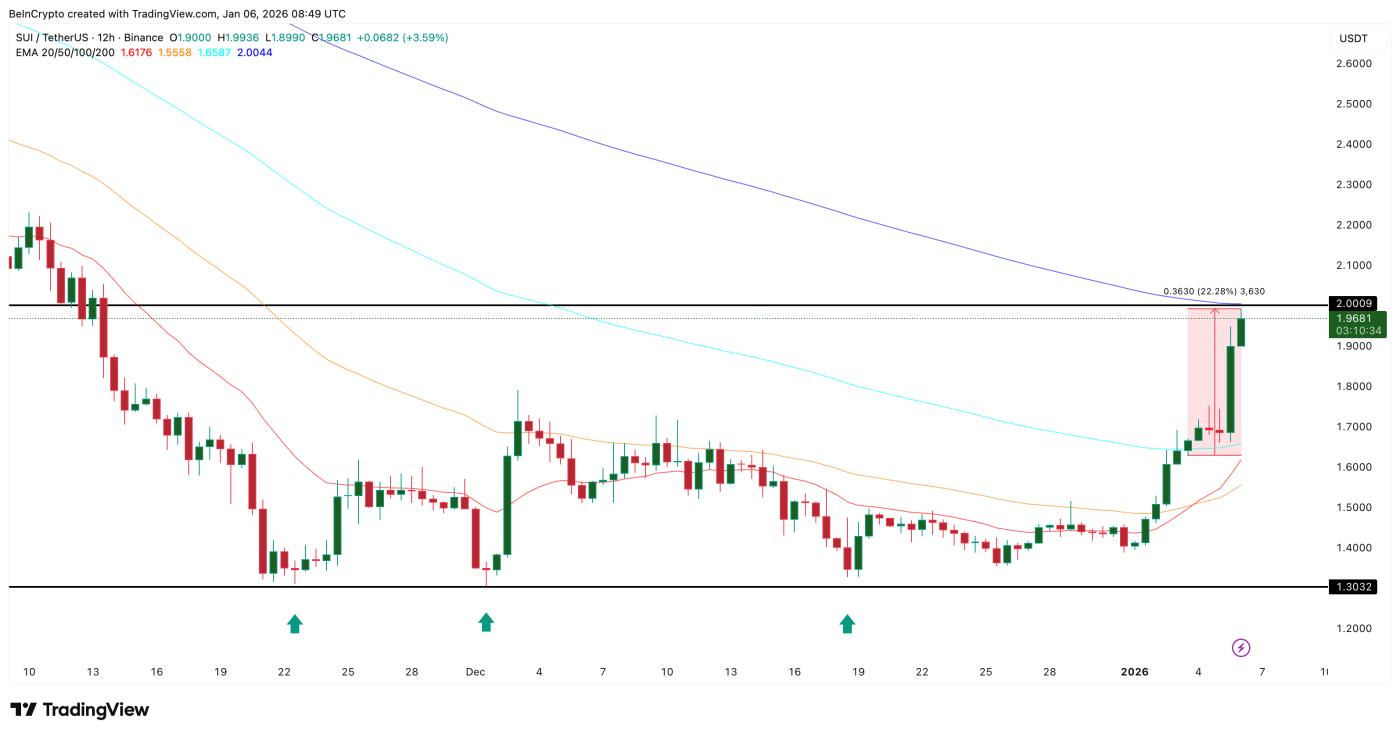 Technical factors supporting Sui's upward momentum: TradingView
Additionally, there are signs of a bullish crossover forming. The 20-period EMA is approaching the 100-period EMA. This month, a bullish crossover between the 20-period and 50-period EMAs also contributed to a 22% price increase, suggesting that momentum could surge significantly when these signals coincide.
In summary, market structure explains the strong rise in Sui : sustained support at $1.30 and the subsequent retracement of key EMAs boosted buyer confidence. However, this alone is not enough to guarantee that this uptrend will continue.
Momentum and on-chain data suggest that profit-taking risk is increasing.
Momentum indicators are currently issuing cautionary signals.
The Relative Strength Index (RSI) indicates the strength of recent price movements. Currently, the RSI has surpassed its previous peak while the Sui is at risk of forming a lower peak. This is a hidden bearish divergence signal, often indicating weakening momentum, even if the price appears strong. Additionally, the RSI has also moved into overbought territory.
This divergence is not yet confirmed. It will be officially triggered if the next daily candle closes below $1.99, maintaining the lower high structure. Until that happens, this is only a warning sign, not a confirmation signal of a reversal. That's also why the $2.00 level is extremely important if the buyers want to maintain their strength.
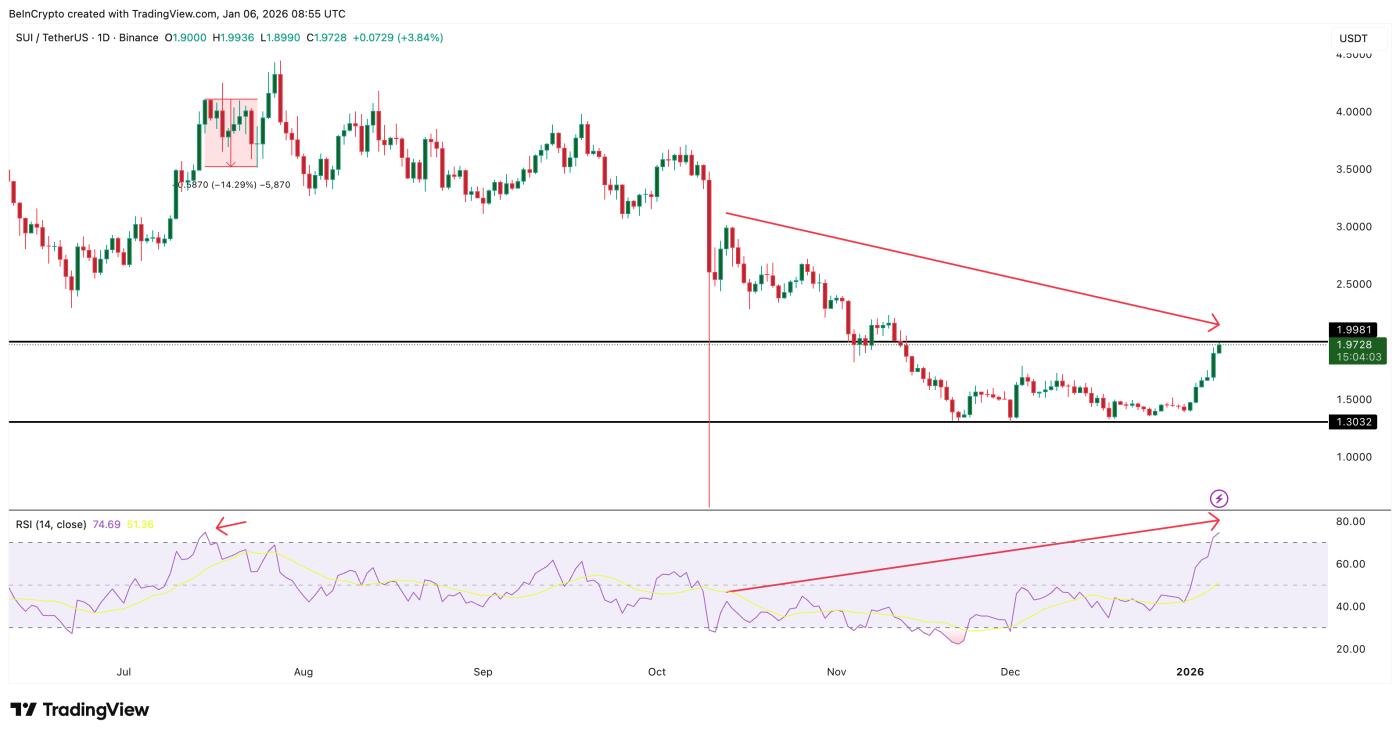 A bearish divergence is forming: TradingView
History has also recorded this risk. The last time the RSI reached a similar level, in mid-July 2023, the Sui price corrected downwards by approximately 15% in the following 9 days.
on-chain data further reinforces this warning signal. Token flows on spot exchanges show a strong selling trend. On January 4, 2024, Sui recorded a negative net flow of approximately $8.37 million, indicating a buy-and-hold strategy. However, the latest data shows a positive net flow of approximately $10.15 million, meaning Token are being reloaded onto the exchange.
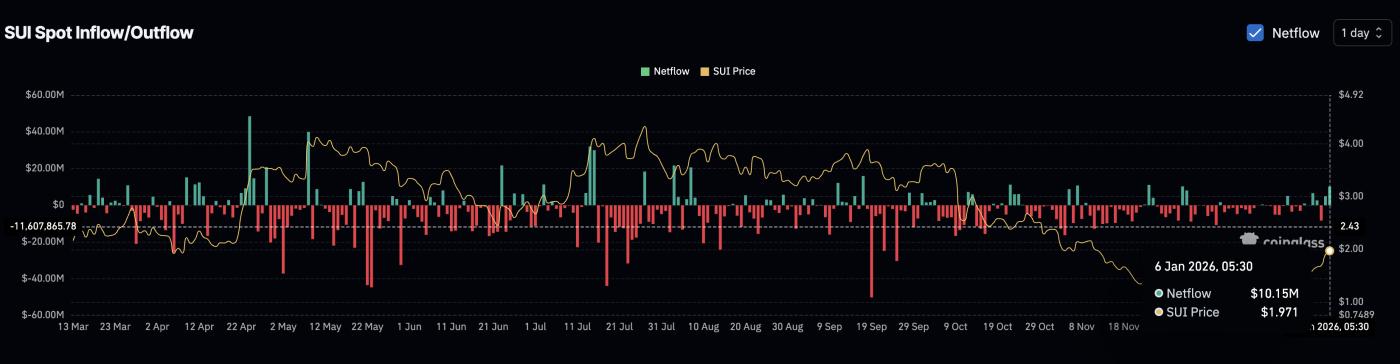 Selling pressure increases: Coinglass
This change indicates a sudden increase in selling pressure over a short period. An increase in the number of Token deposited on the exchange is usually a sign of profit-taking, especially after a sharp price increase.
Taken together, the weakening momentum and the increased number of Token being moved to exchanges explain why the upwardprice trend of Sui is stalling at the resistance zone.
The Sui price level will determine whether the upward trend continues or not.
With the bullish structure and profit-taking pressure competing, Sui 's price zones are now far more important than technical indicators.
For the upward momentum to continue, Sui needs to close the day above the mentioned $2.00 level. If it holds above this level, the risk of a bearish divergence will be eliminated, opening up a target toward the $2.15 region, representing approximately a 10% potential upside from the current level. This region was lost in early November and has not been regained since.
If selling pressure continues and the $1.95 level fails to hold, downside risk will increase rapidly. The first major support lies near $1.70, meaning a price correction of around 12% is possible. A deeper correction could send the price to the $1.30 support zone, which has also formed three Dip and fueled previous rallies.
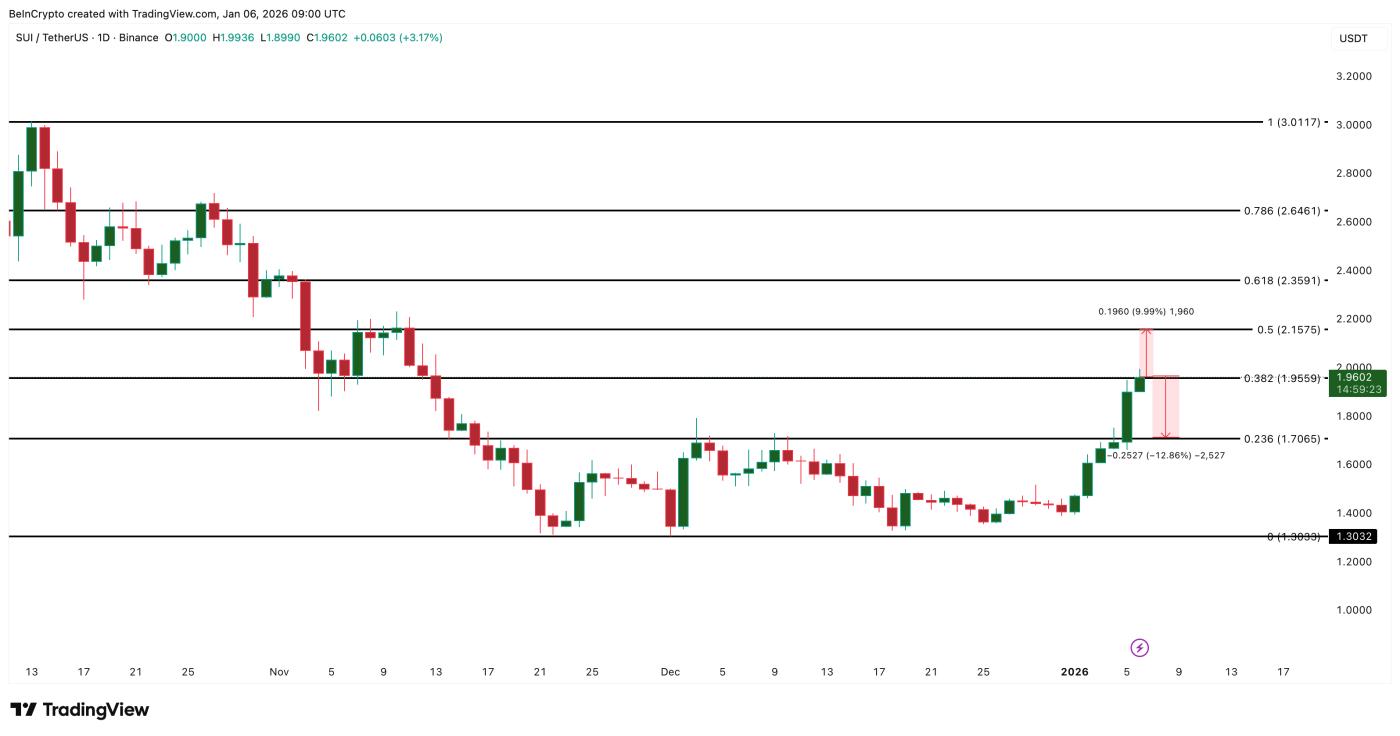 Sui price analysis: TradingView
Sui 's strong price surge has a solid technical foundation, but profit-taking is currently challenging investor confidence. As long as the price remains above $2.00, the uptrend is likely to hold. However, a drop below this level could lead to sideways movement or a downward correction.


