Zcash price is under strong pressure. A governance shock has significantly dampened sentiment, the price chart has broken through support levels on shorter timeframes, and the downside risk is now very clear.
What's unusual about this drop is that large investors are buying aggressively while the price of ZEC has fallen by as much as 25% compared to last week. Currently, the price, market sentiment, and actions of these large investors are moving in opposite directions.
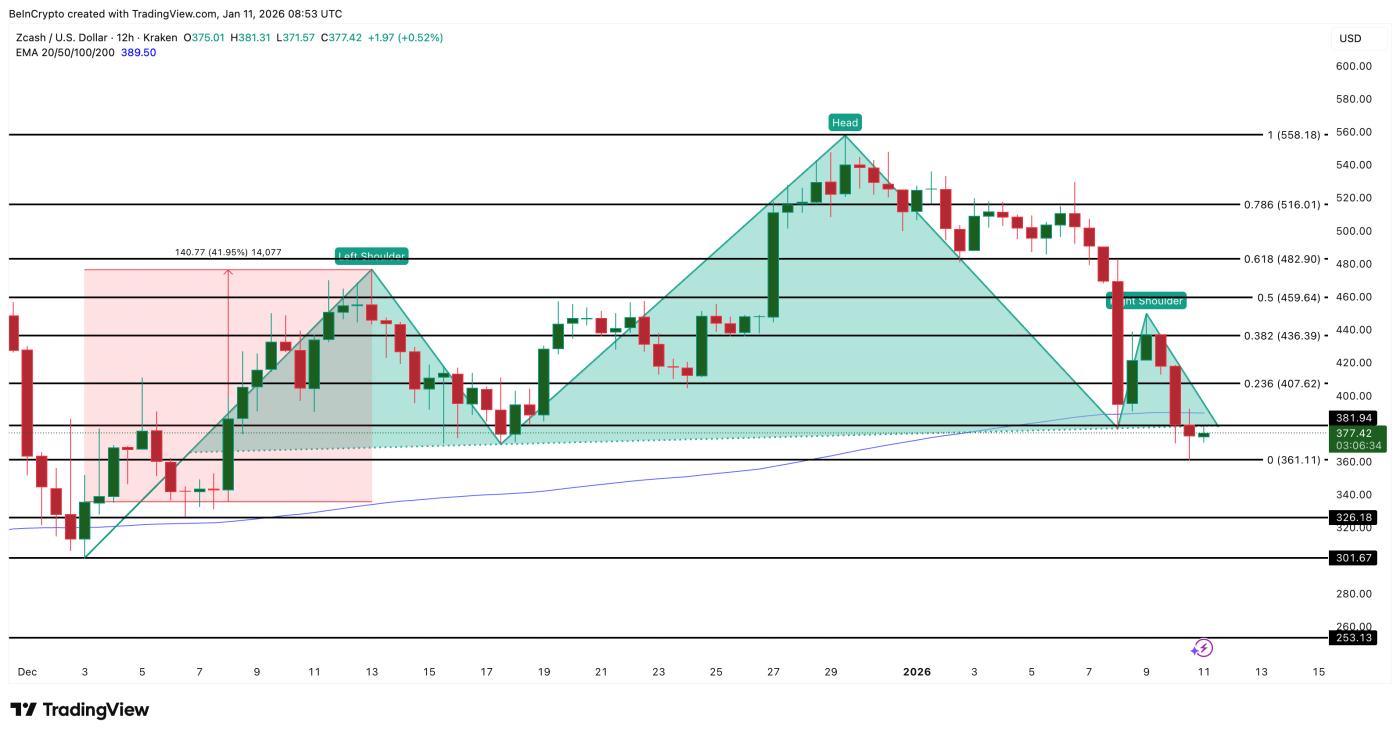
The breakdown pattern and loss of the EMA indicate a 30% risk zone.
Zcash has formed a bearish pattern that is difficult to recognize on the daily chart alone, but is very clear on the 12-hour timeframe. The price completed a Vai-and- Vai pattern after breaking through the neckline at around $381. When the price fell below this area, the bearish pattern was triggered.
If we apply the standard measurement from the top of the head to the neckline, the downside price target would be around $253. If this downward trend continues, the price of ZEC could fall by more than 30% from its current level.
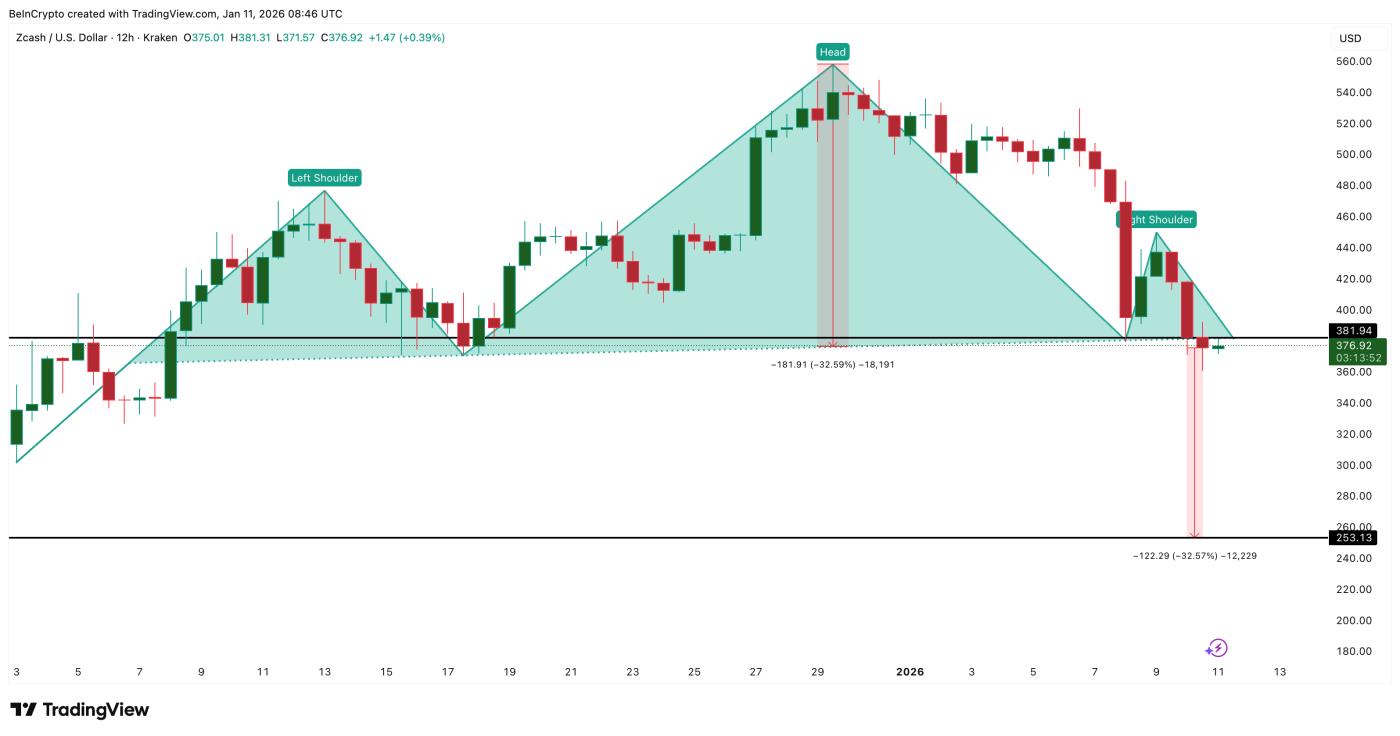 Zcash price structure: TradingView
Want more Token analysis updates like this? Sign up for editor Harsh Notariya's daily Crypto newsletter here .
This breakout wasn't an isolated incident. The Zcash price also fell below the 200-period Exponential Moving Medium (EMA) on the 12-hour timeframe. The EMA is an indicator that highlights recent price volatility and is often used to determine trend strength. When the EMA 200 is lost, the trend is more likely to reverse from support to resistance.
Simultaneously, the 20-period EMA has also crossed below the 100-period EMA. This bearish crossover indicates that short-term momentum is weakening faster than the overall trend. If the two lines continue to diverge further, the downward momentum of ZEC could intensify even more.
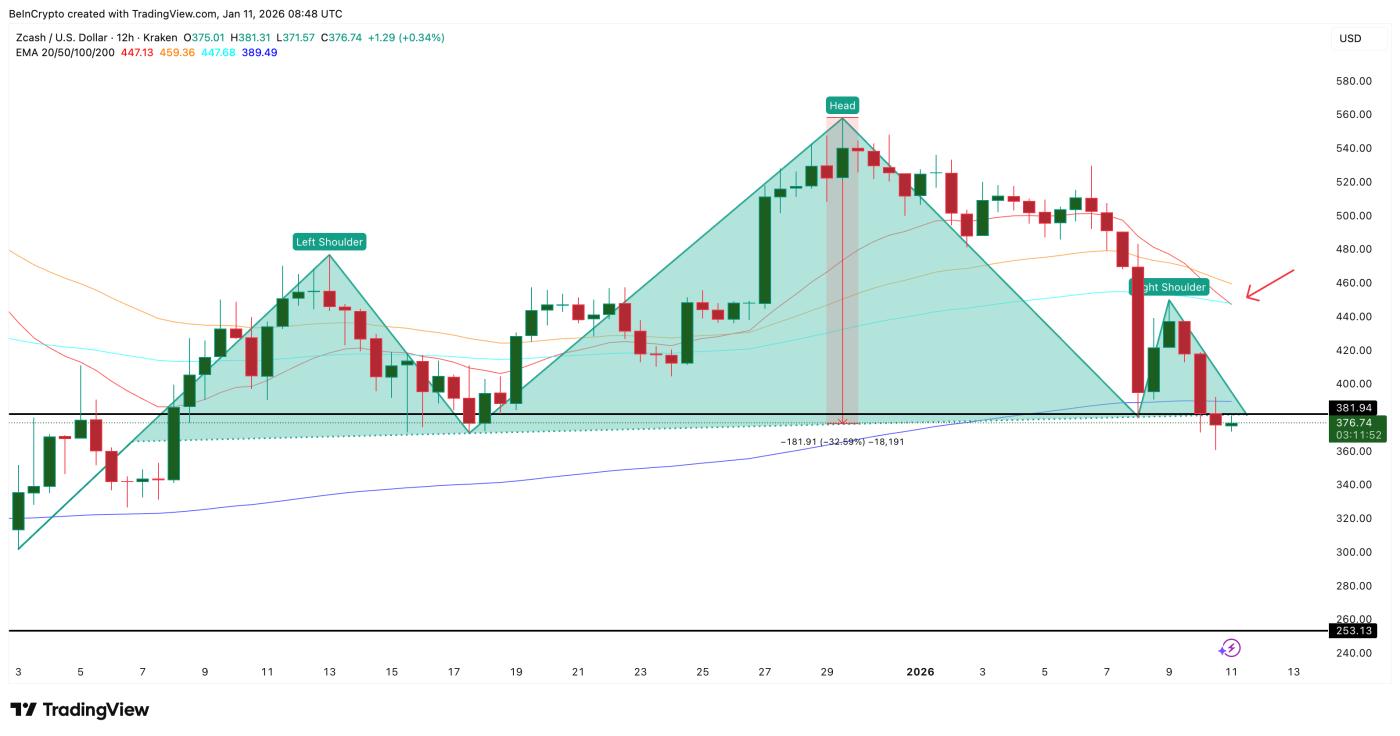 EMA theory weakens the structure: TradingView
Taken together, the bearish structure, the loss of the EMA, and the bearish crossover signal indicate that selling pressure remains present.
Market sentiment plummeted, driving prices down, while whales quietly accumulated their holdings.
The primary factor driving the price drop was market sentiment.
Following the management shock , Zcash 's positive sentiment index plummeted from nearly 90 to around 5 in just a few days — a drop of over 90%. Looking back at history, ZEC has reacted very strongly to similar sentiment fluctuations.
On December 27th, when positive sentiment peaked locally, the price surged rapidly. Zcash rose from around $511 to $550 in just two days, equivalent to an increase of about 8%. Now, the situation has completely reversed: as sentiment evaporated, buying pressure weakened, and the price broke through the support zone.
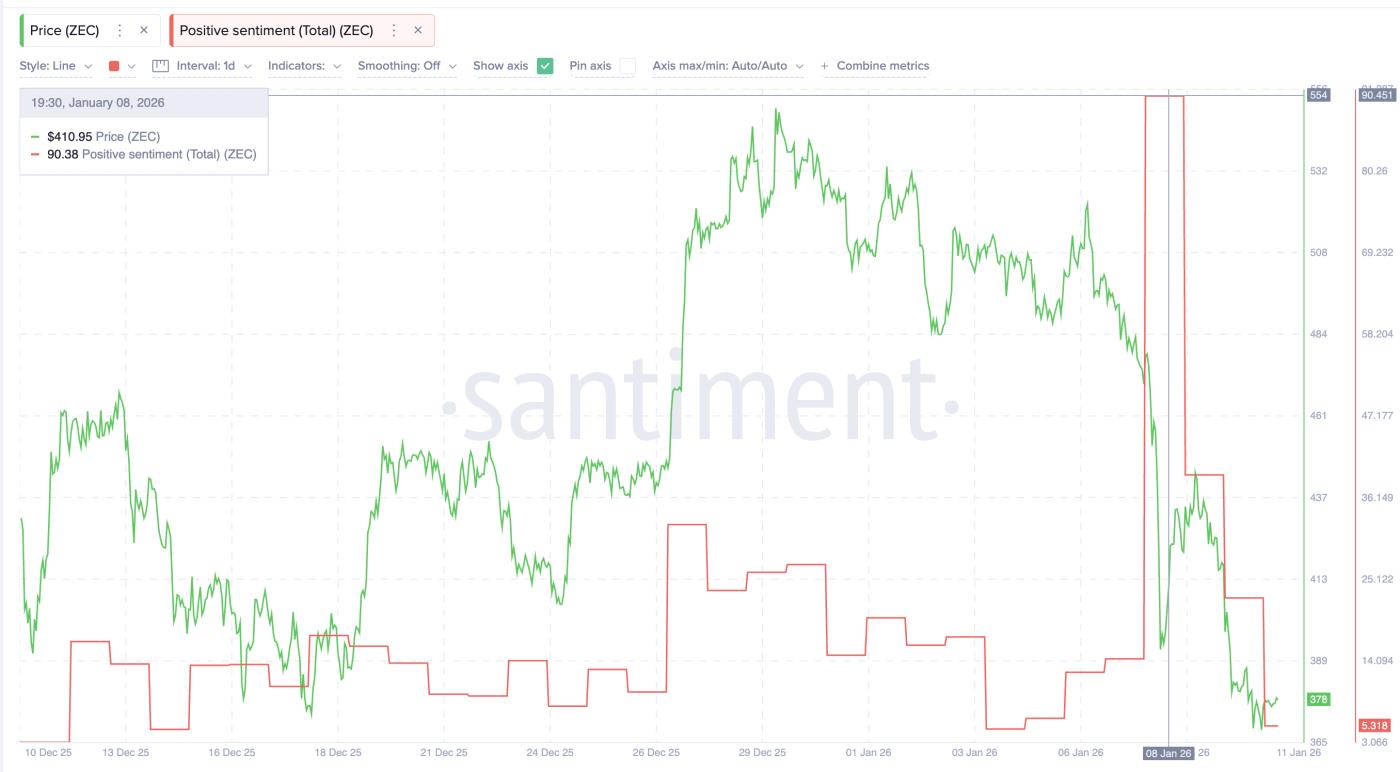 Positive sentiment index drops sharply: Santiment
However, large sharks react very differently.
Over the past seven days, the top 100 Zcash holders have increased their holdings by 47.71%, equivalent to an additional 15,000 ZEC. Regular whale wallets also saw an 11.44% increase in assets, adding approximately 2,000 ZEC (worth nearly $780,000). In total, whales have accumulated nearly 17,000 ZEC — equivalent to approximately $6 million — during this period of price decline.
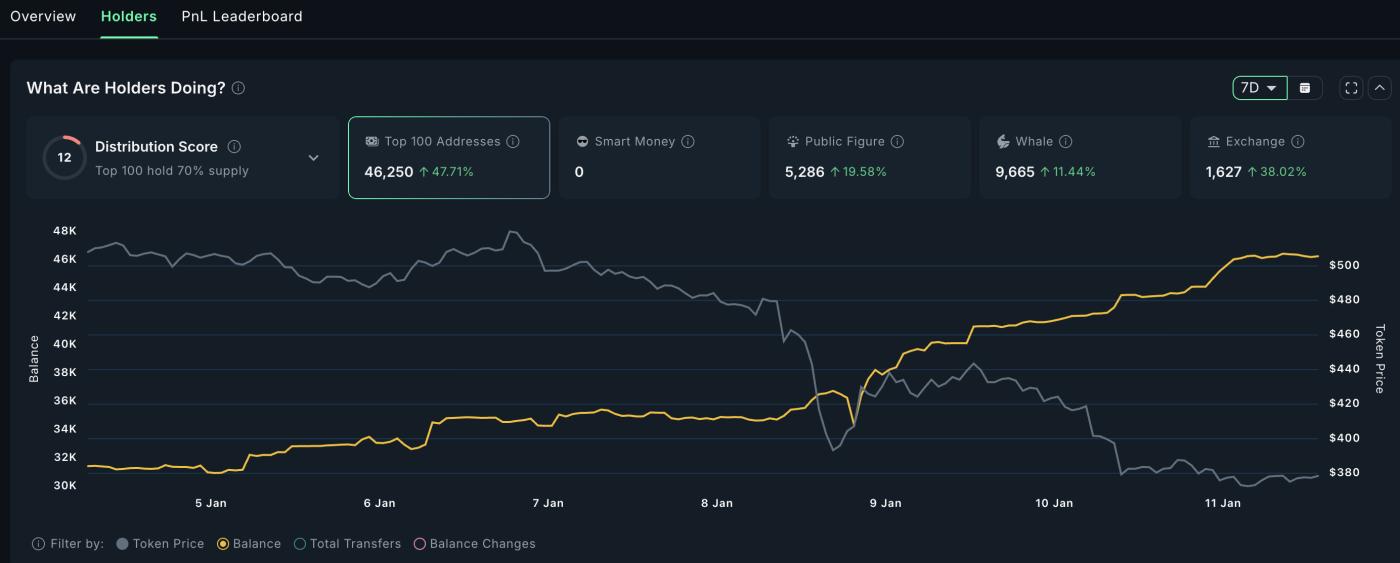 Sharks still hold ZEC despite market weakness: Nansen
Public wallets also increased their holdings by nearly 20%.
Meanwhile, retail investors' actions were the opposite. The balance on the exchange increased, indicating that retail investors were selling due to fear. As a result, the market Chia into two directions: long-term investors quietly accumulated shares, while short-term investors panicked and sold off as sentiment plummeted.
The quiet accumulation of shares by large investors has helped prevent prices from falling too sharply, but it hasn't been able to reverse the downward trend yet.
Zcash price closely follows expectations from the EMA.
Currently, the price of Zcash has entered a very crucial decision zone.
On the downside, the $361 level is a crucial point to watch. If the price continues to break through this level, the downtrend will become even clearer, potentially leading to further support at $326 and ultimately a complete breakout around $253.
This price level of $253 is also the target for a more than 30% drop, according to the Vai-and- Vai pattern analyzed above.
On the upside, the bearish pattern can still be invalidated, but the conditions are quite stringent. Zcash needs to reclaim and maintain above the 200-period EMA. The last time Zcash surpassed this level, in early December, the ZEC Token surged over 40% and formed the left Vai of the price pattern.
 Zcash price analysis: TradingView
Above that, resistance levels are around $407, followed by $436 and $482. If Zcash breaks through these price zones, it will indicate that market sentiment has stabilized and the uptrend is further strengthened.
Currently, Zcash remains stuck in a state of both technical damage and silent accumulation. A bearish signal has appeared. Whether this negative trend continues will depend on whether market sentiment recovers in time to bring Zcash back to its previous price structure.