

In high-frequency trading, transaction fees are not just a cost, but a decisive factor in winning or losing.
Article by Michel Athayde
Article source: MarsBit
summary
"In high-frequency trading, transaction fees are not just a cost, but a decisive factor in winning or losing."
This article, based on an initial capital of $100,000, conducted a one-year cross margin backtest of the popular TradingView strategy Squeeze Momentum (LazyBear) on BTC and ETH. The data reveals a harsh reality: a mere 0.04% difference in transaction fees is enough to cause the same strategy to reverse its performance on ETH's 15-minute chart, from a 47% profit to a 14% loss. This means that for many retail investors and novice quantitative traders, the strategy logic itself may be sound, but the fee structure at the execution level directly devours all the alpha.
(Note: This backtest is based on historical data of perpetual contracts from major exchanges, using standard Squeeze Momentum parameter settings, and does not account for slippage. The aim is simply to compare the marginal impact of different fee structures on the strategy's net asset value.)
1. Key Data Insights: BTC vs. ETH Fee Sensitivity
This study simulated three typical fee scenarios: 0% (benchmark), 0.02% (Maker/order placement fee), and 0.06% (Taker/order taking fee). The backtesting strategy was modified to a "Long Long" mode to accommodate the long-term upward trend of the crypto market.
The results are as follows:
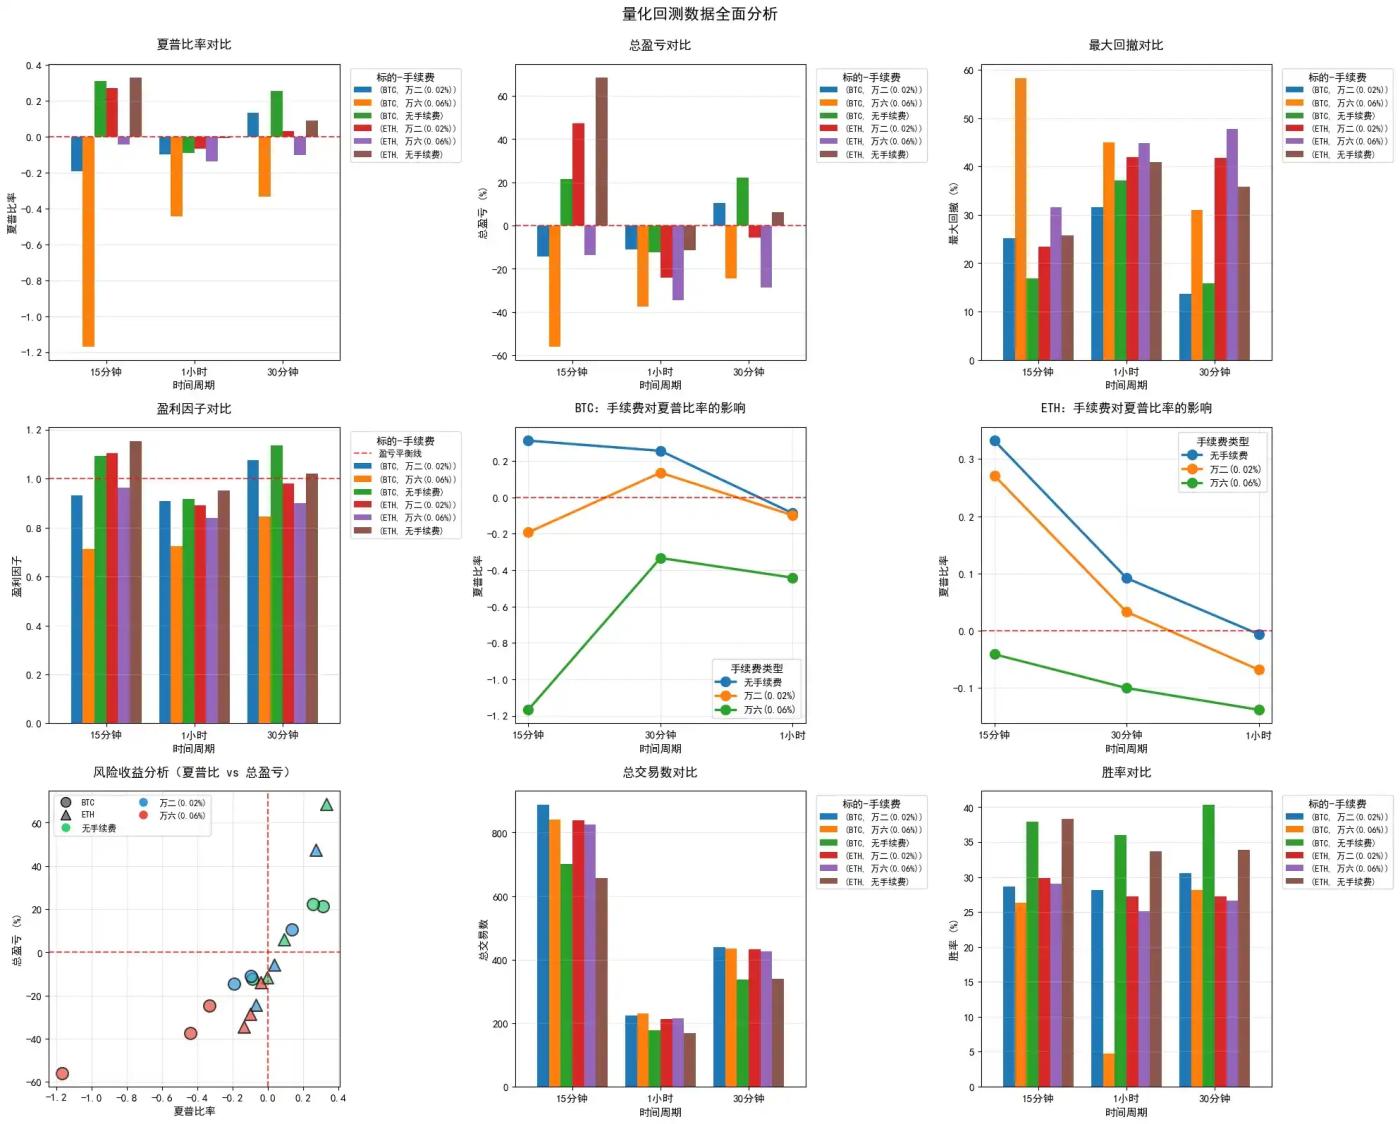
1.1 15-minute timeframe: A "profit grinder" in high-frequency trading
The 15-minute chart is the period with the most concentrated signals for this strategy (an average of 600-800 trades per year), and it is also the area where the transaction fee effect is amplified to the extreme.
In-depth analysis:
- The High-Frequency Dilemma of BTC: Under the 15-minute high-frequency execution conditions set in this article, BTC's relatively low volatility (Beta) is insufficient to cover the fixed costs incurred by frequent trading. Even with a low fee rate of 0.02%, the strategy still resulted in negative returns. This indicates that, given the current market maturity, simple technical indicator breakout strategies may no longer be able to generate sufficient alpha in the short term for BTC.
- ETH's volatility advantage: ETH has demonstrated stronger explosive power. Under ideal conditions (0% fee), its 68.66% return far exceeds that of BTC. This high volatility allows ETH to maintain a respectable return of 47.34% even with a Maker fee of 0.02%.
- The cost of taking orders: The most alarming part of the data is the comparison with ETH. Once a trader uses a market order (0.06% fee), even if they catch a big move in ETH, the cumulative fees of up to $76,536 will still push the account into a loss (-13.81%).
2. The Cycle Paradox: Why didn't lengthening the cycle solve the problem?
It is generally believed that increasing the time frame can reduce trading frequency, thereby reducing transaction fee wear. However, this backtesting revealed a counterintuitive phenomenon at the 1-hour (1H) timeframe.
analyze:
Even without considering transaction fees (0%), both BTC and ETH recorded losses on the 1-hour chart (BTC -12.29%, ETH -11.51%). This may be related to the signal lag of the default parameters (20, 2.0) at higher timeframes. When the "squeeze release" signal is confirmed on the 1-hour chart, the trend has often already started for some time, causing the strategy to chase the local high and subsequently face stop-loss on the pullback. This reminds us that blindly applying default parameters to different timeframes is extremely risky.
3. Core Insight: A Mindset Shift from "Win Rate" to "Odds"
3.1 The Mathematical Pitfalls of Break-Even
Squeeze Momentum is a typical trend-breaking strategy with a low win rate (backtesting shows a win rate between 26% and 40%), and its profitability mainly depends on the profit-loss ratio.
However, transaction fees mathematically raise the "break-even point".
- Taking ETH 15m as an example, the $76,536 transaction fee means that each transaction (regardless of profit or loss) implies an average "entry ticket" of about $92.
- The core conclusion is that for strategies with more than 600 trades per year, transaction fees have become the primary variable determining the success or failure of the strategy, rather than the predictive ability of the indicator itself.
3.2 Fund Management and Compound Interest Wear
This backtest used a 100% position. High fees and continuous attrition will accelerate the depletion of principal. The maximum drawdown of BTC 15m (0.06%) reached a staggering 58.32%, which in live trading often means liquidation or a complete breakdown of emotional composure.
4. Practical Insights and Strategies for Optimization
Based on the above data, we can offer the following industry advice for traders who wish to implement such momentum strategies:
4.1 Fee structure determines survival space
Conclusion: In live trading, this type of high-frequency strategy is only highly feasible when Maker (limited order) execution can be reliably obtained.
- Recommendation: At the algorithm execution level, passive order placement logic should be implemented as much as possible (e.g., placing orders at the best bid price or within the order book depth) rather than directly taking orders. Extreme caution is required when running this strategy on high-fee exchanges (Taker > 0.05%).
4.2 Target Selection: Volatility is the Core Competitive Advantage
Conclusion: Under a fixed rate, the volatility of the underlying asset must be sufficient to cover the costs.
- Recommendation: Compared to BTC, the Squeeze Momentum strategy is more suitable for deployment on ETH or other mainstream Altcoin with high beta. BTC's increasingly "asset-like" low-volatility nature makes it less cost-effective for short-term breakout strategies.
4.3 Introduce a filtering mechanism to reject invalid fluctuations.
Conclusion: The main reason for losses was the frequent opening of positions by the original strategy in a volatile market.
- suggestion:
- Trend filtering: Introduce the ADX indicator (e.g., ADX > 20) to confirm trend strength and avoid repeated wear and tear in directionless sideways movement.
- Multi-period resonance: Before opening a position on the 15-minute chart, confirm that the 1-hour or 4-hour chart is in a bullish alignment, following the major trend and going against the minor trend.
4.4 Dynamic adaptation of parameters
Conclusion: The failure within 1 hour serves as a warning that parameters are not a panacea.
- Recommendation: For different timeframes, the Bollinger Band Length (BB Length) and Mult Factor should be optimized to reduce the risk of chasing highs due to signal lag.
5. Conclusion
Squeeze Momentum, as a classic open-source strategy, remains effective in capturing trends. However, this backtest clearly demonstrates that the holy grail of quantitative trading lies not in discovering a magic indicator, but in extreme control over execution costs and a profound understanding of market microstructure.
For quantitative traders hoping to profit in the crypto market, optimizing code is only the first step. Optimizing the account's fee tier and choosing the right liquidity provision method often have a greater impact on the final PnL than optimizing the parameters themselves.


