

Bitcoin hovers with a dramatic flair on Jan. 12, 2026, pulling a sideways stunt between $90,090 and $92,392—just enough to keep traders guessing and algorithms twitching. But the real intrigue is in the charts, where momentum flares, fades, and signals that bitcoin just might be plotting its next move in secret.
Bitcoin Chart Outlook
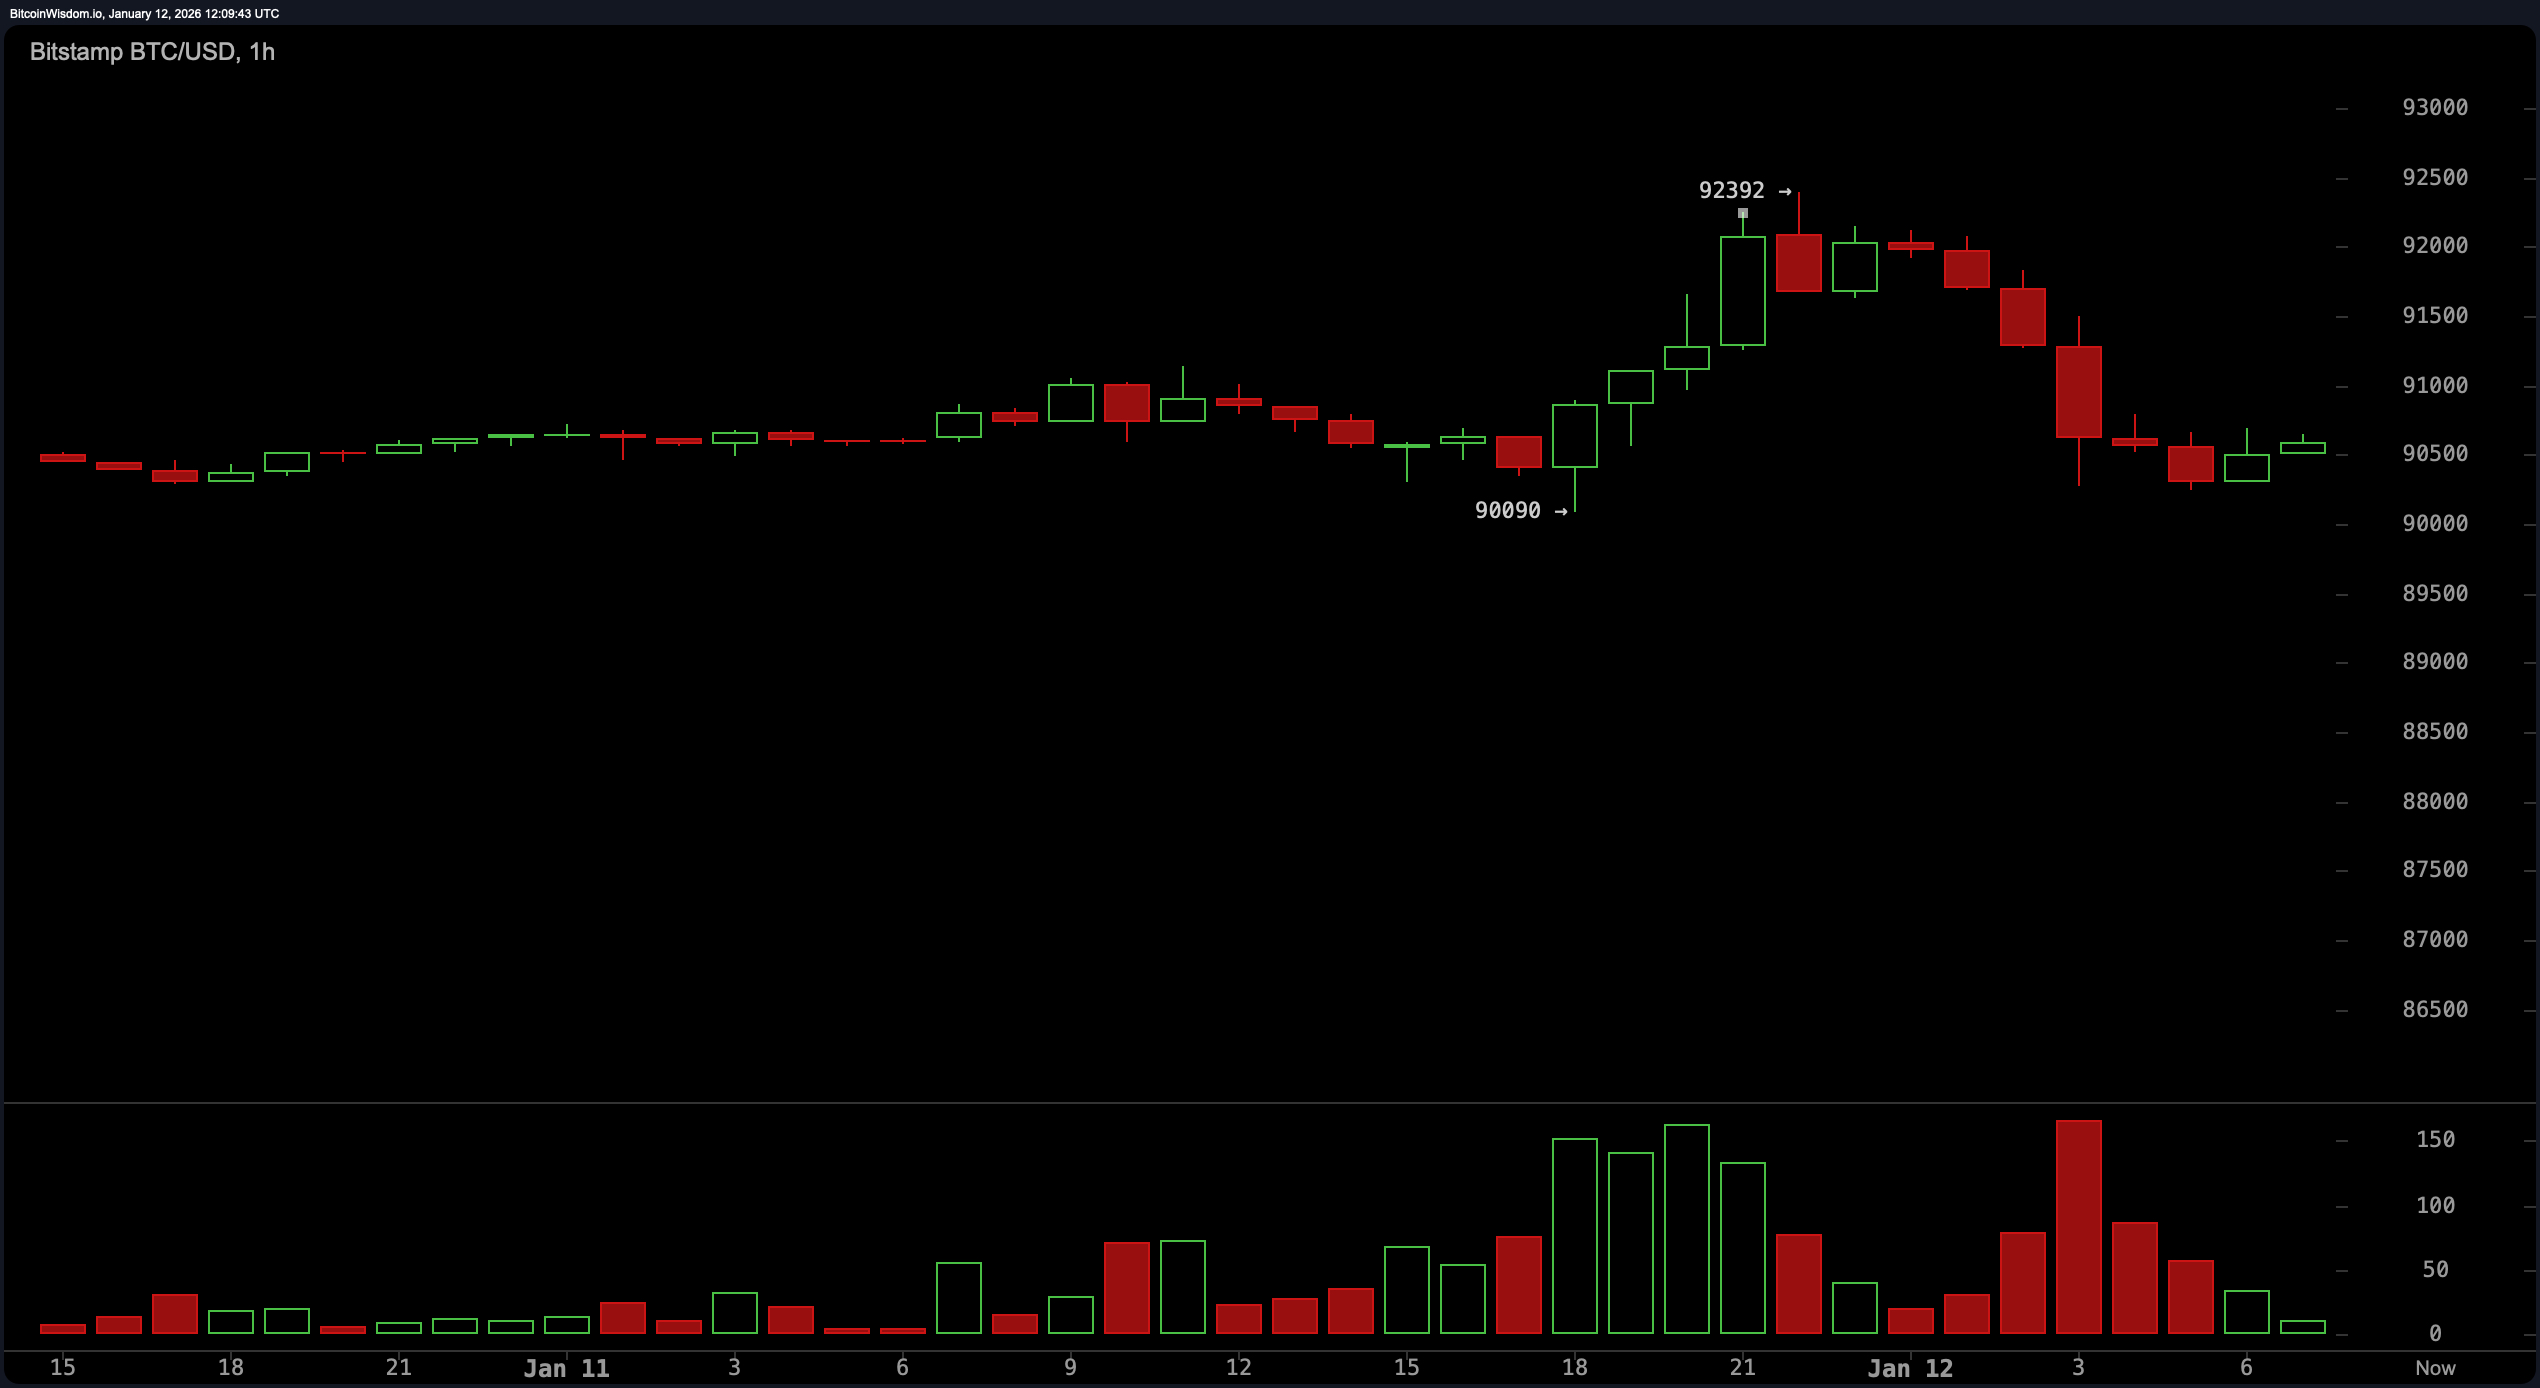
Bitcoin’s 1-hour chart paints a story of short-term tension. Bitcoin spiked from $90,090 to $92,392 in a quick burst of adrenaline before retreating back to the $90,500 range. This swift rise-and-recoil, followed by low- volume pullbacks, screams profit-taking rather than panic selling.
The price then tiptoed within a tight range between $90,000 and $92,000, setting up a classic short-term consolidation. Traders watching this timeframe realize that a decisive break above $92,400 could ignite a new round of momentum plays. But a drop below $89,800, especially with strong volume, would suggest bitcoin is ready to ghost the current range entirely.
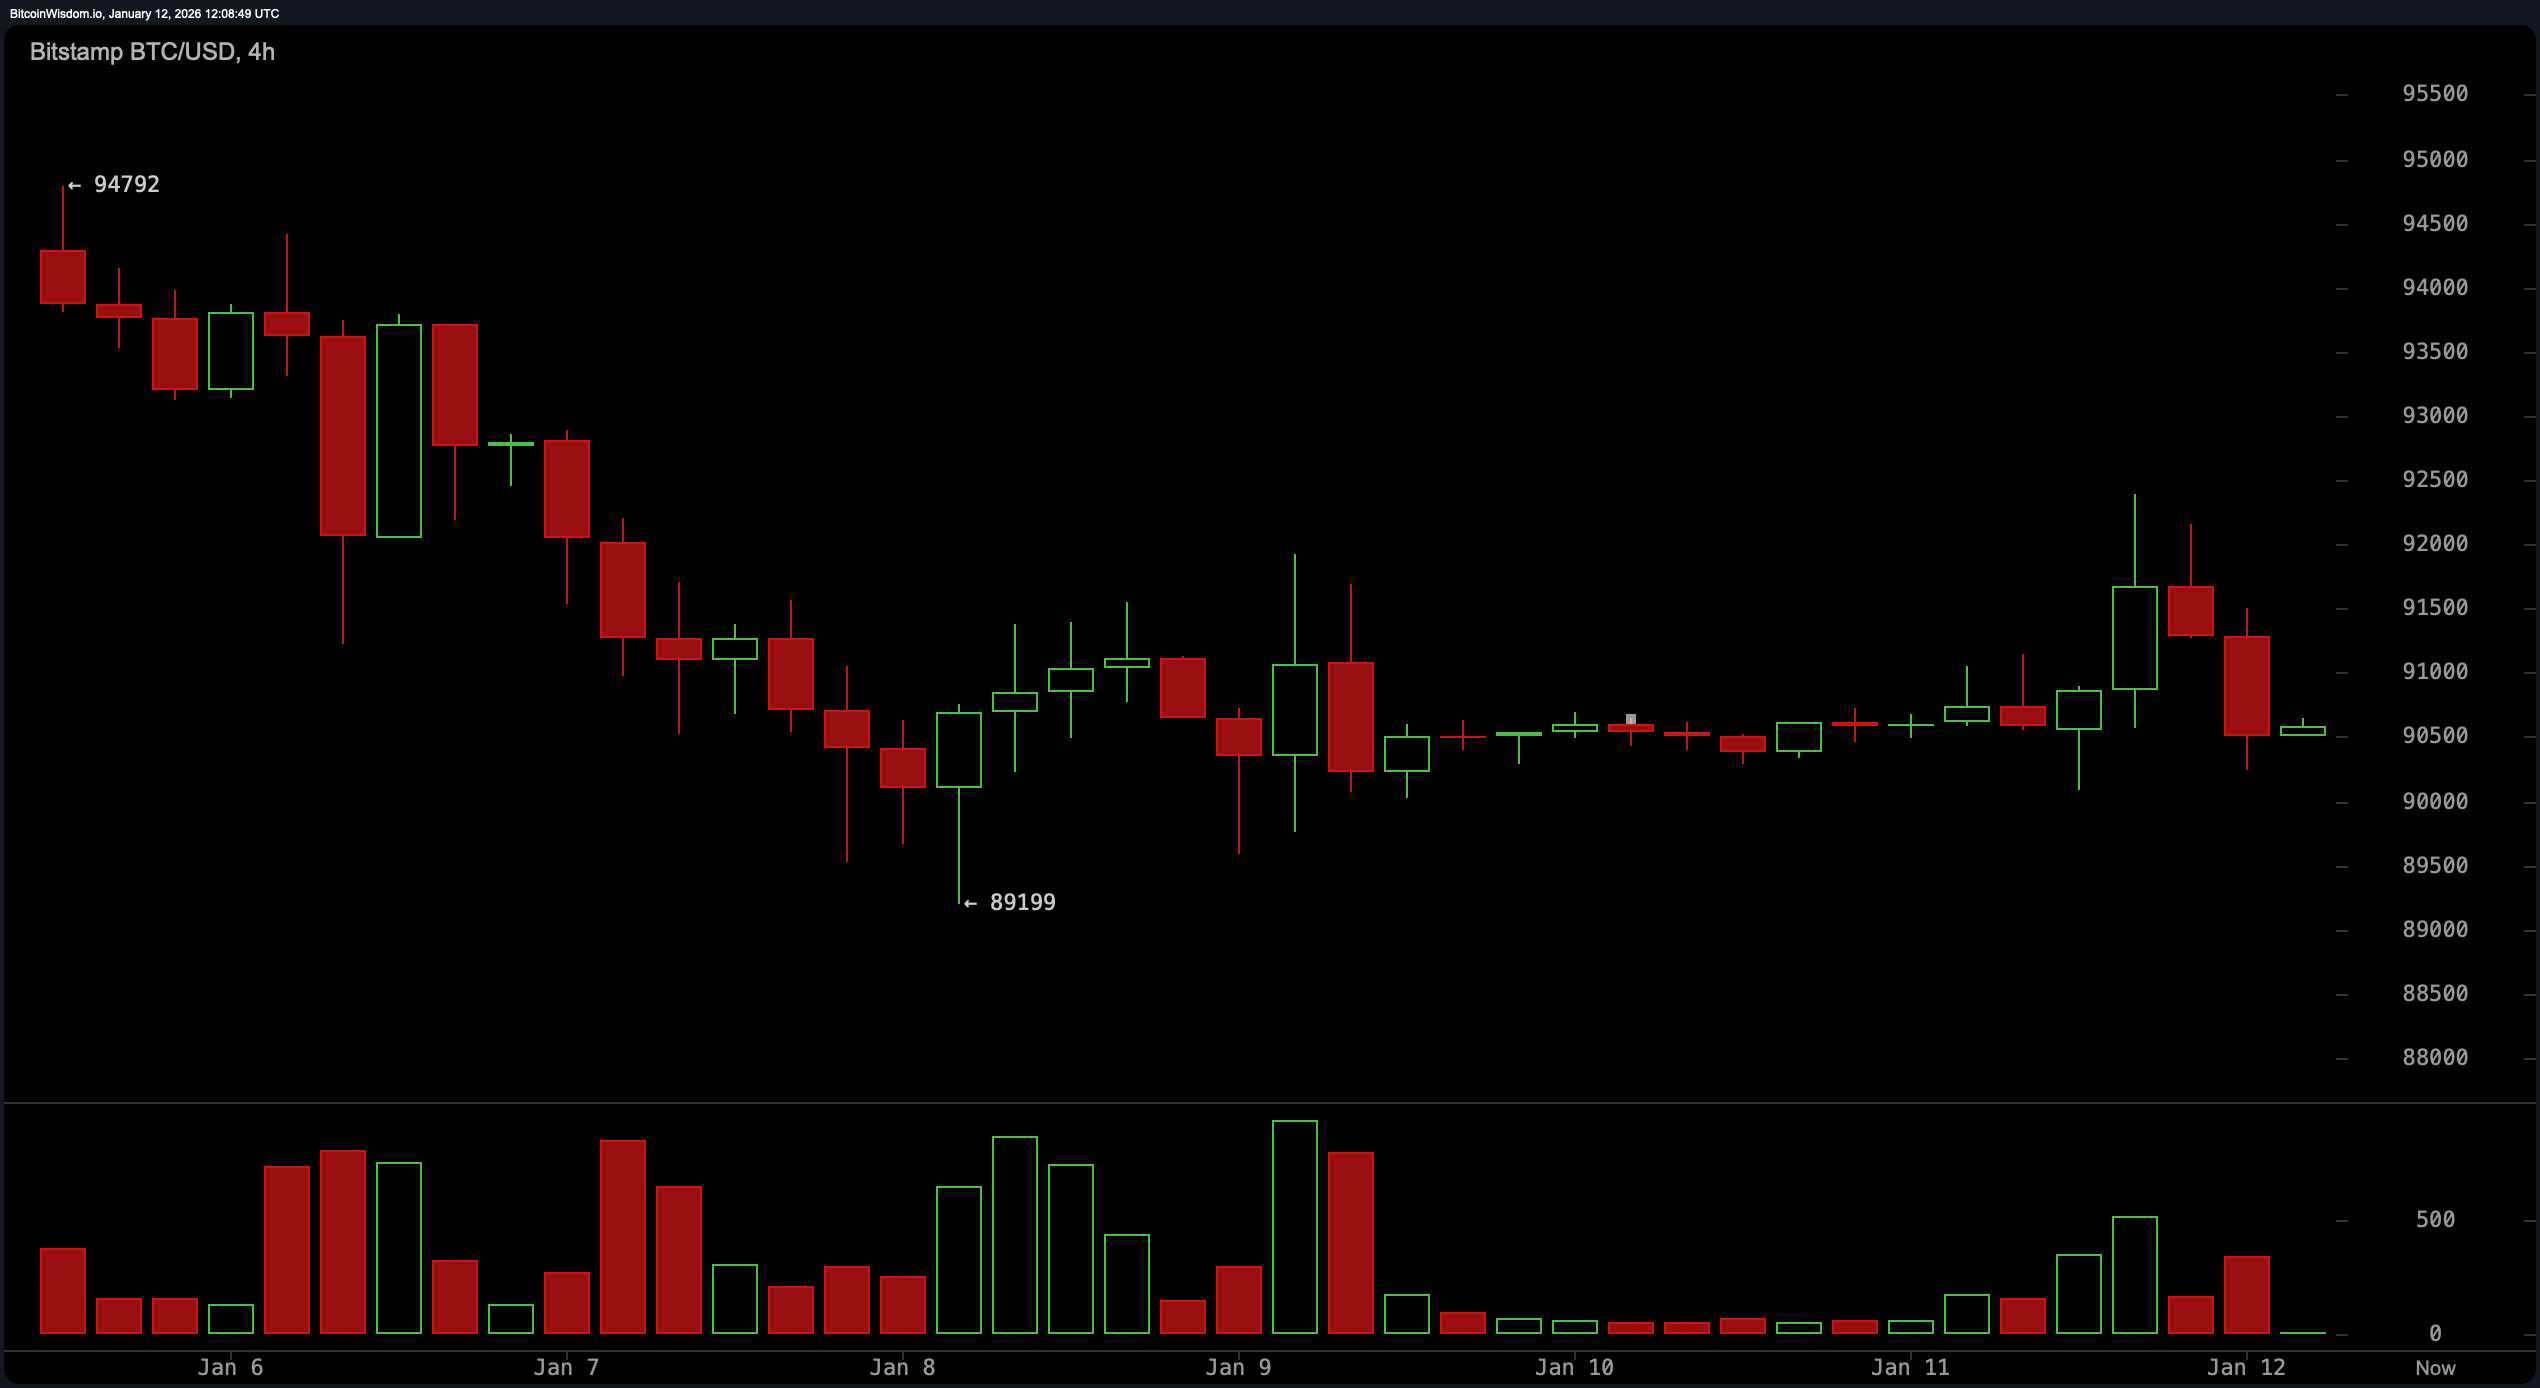
Meanwhile, the 4-hour chart hints at a mid-term identity crisis. Following a decline from the $94,792 peak to $89,199, bitcoin entered a consolidation phase resembling either a bearish flag or a descending triangle—depending on your flavor of technical tea. Price compression was evident with lower highs, while the $90,000 support line refused to break like a loyal old friend. Should bitcoin rise above $92,000 with convincing volume, the chart suggests there’s potential to flirt again with the $94,000s. But if support at $89,000 gives way, expect some structural unraveling in the pattern.
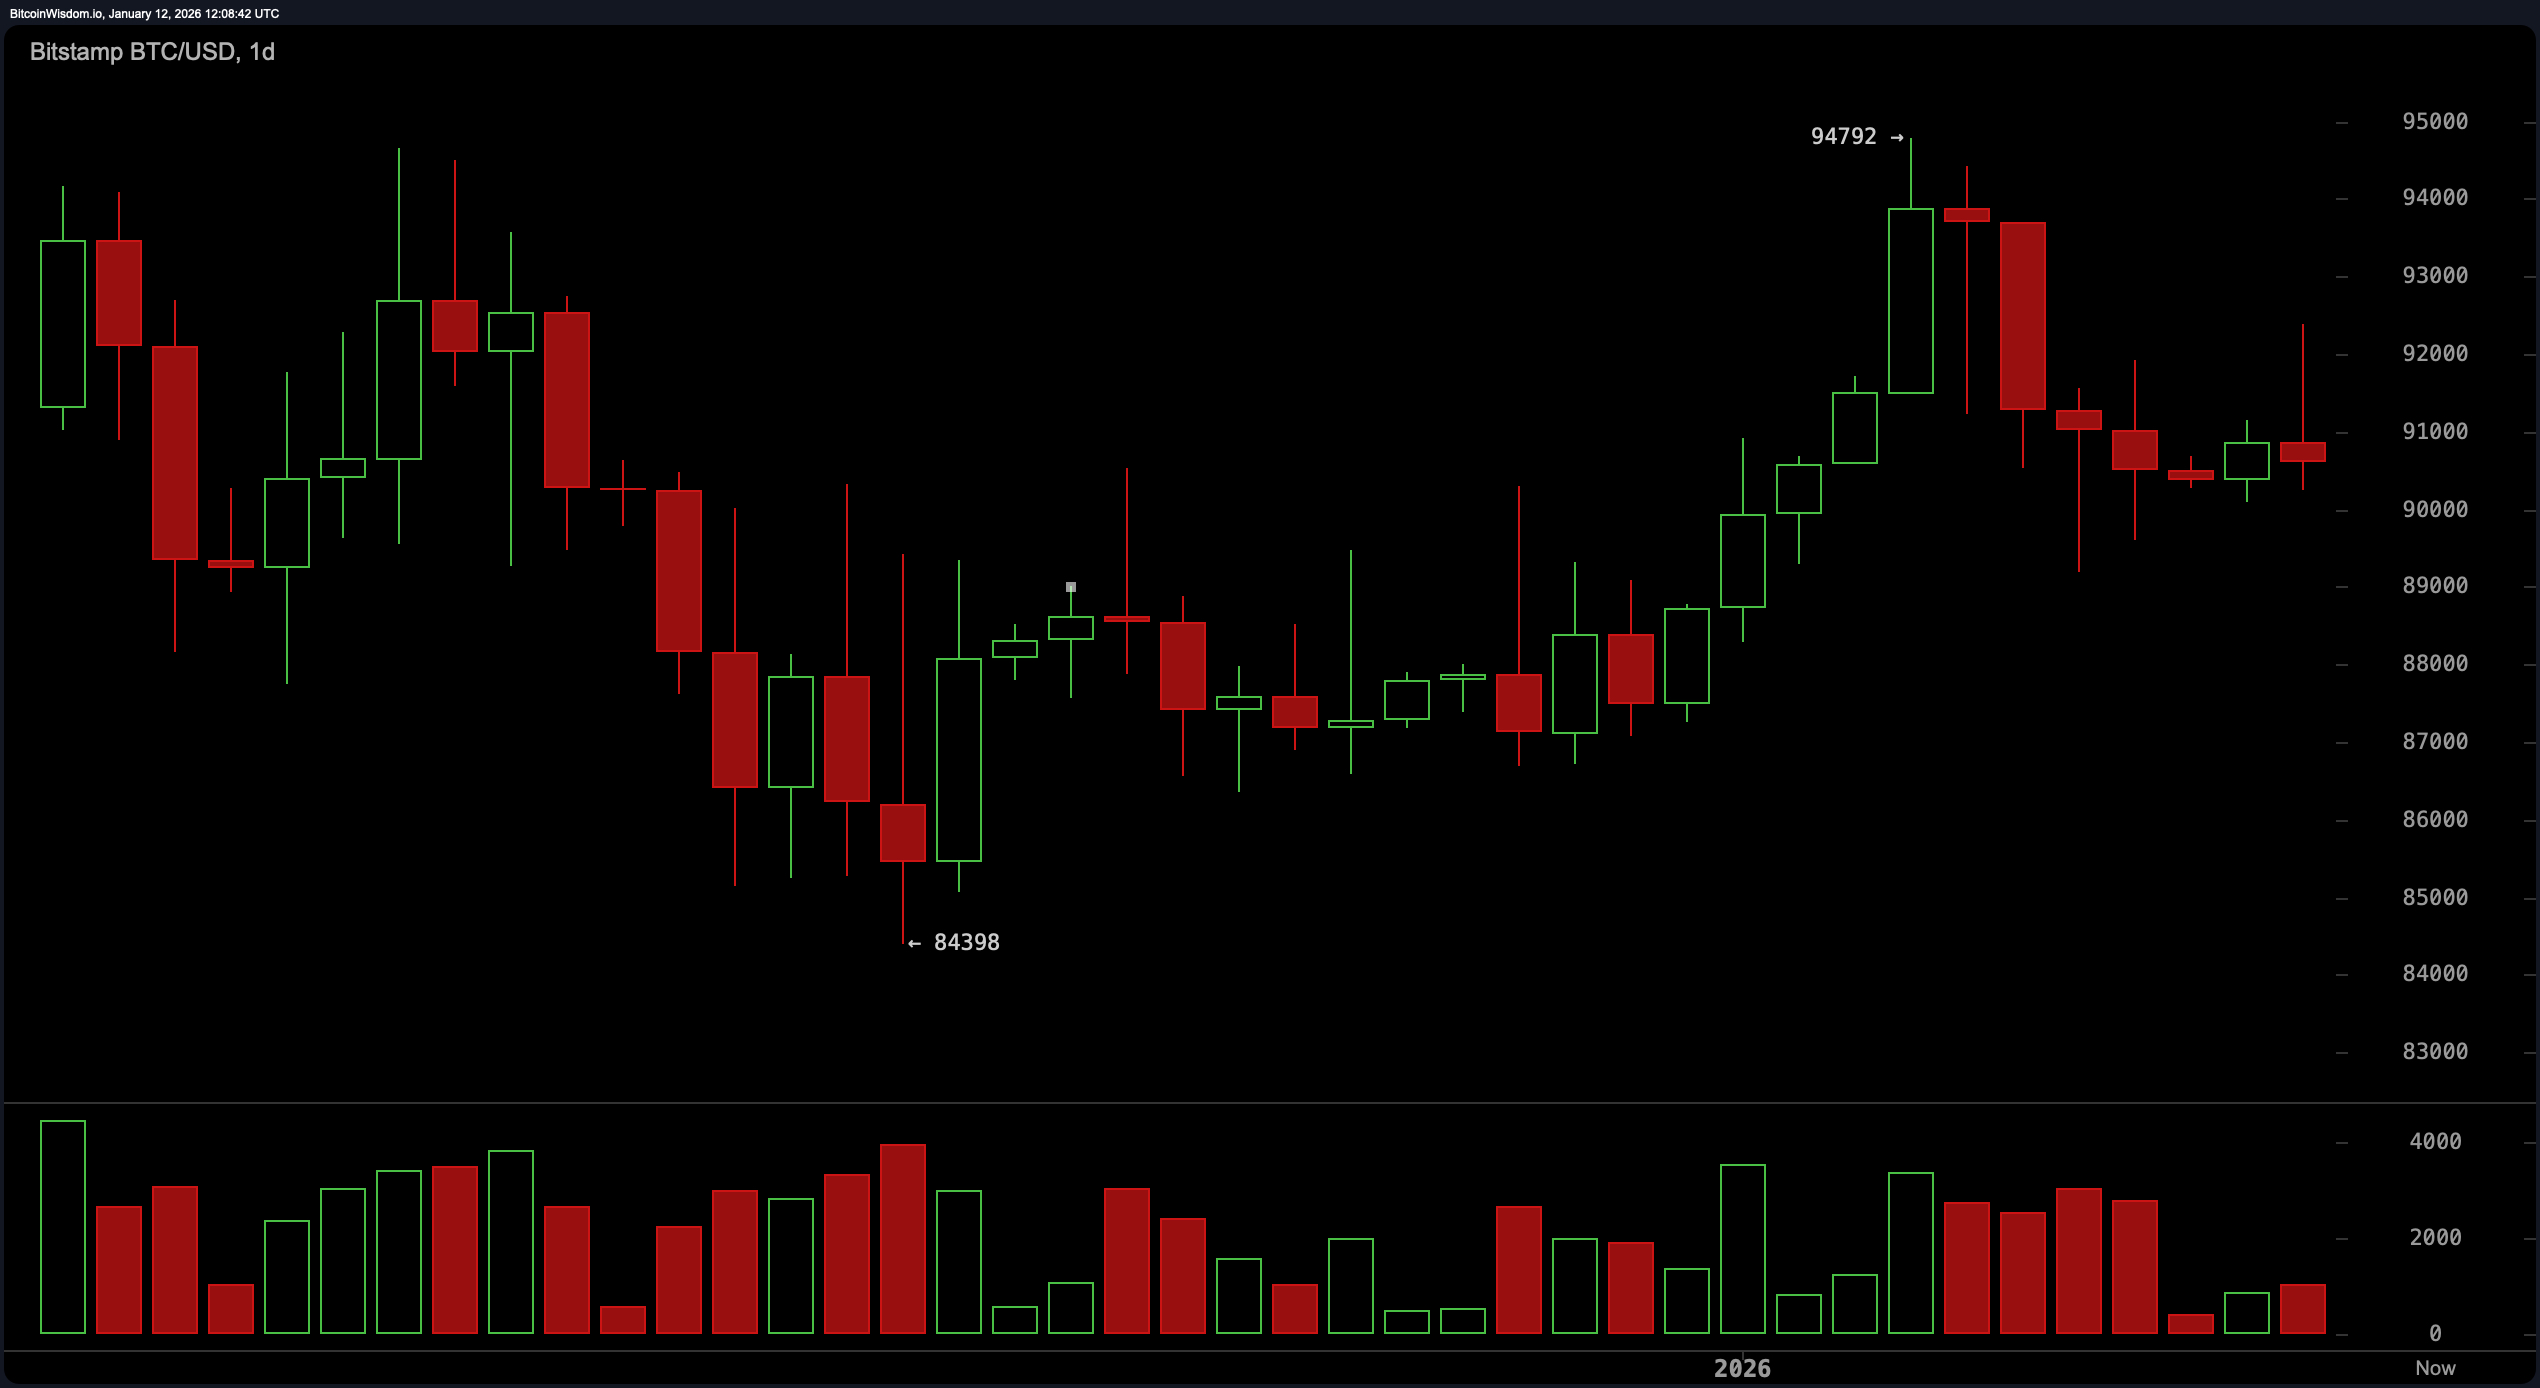
On the daily chart, bitcoin flaunts a wider narrative of a rebound from the depths near $84,398, only to get stage fright near the $94,792 resistance ceiling. The rally saw a healthy volume burst, but that enthusiasm tapered as the price made lower highs. The area between $88,500 and $89,500 now acts as a major retest zone, ideal for bulls seeking another leg up. However, the caution tape is firmly in place at the $94,500 to $95,000 band— bitcoin’s latest resistance frontier. A daily close below $88,000 would put an end to any romantic notions of a sustained upward trend, at least for now.
Oscillators whisper mixed messages into the ears of analysts. The relative strength index ( RSI) reads a neutral 52, signaling that the market isn’t exactly overexcited or depressed. The Stochastic oscillator stands at 48, echoing similar neutrality, while the commodity channel index (CCI) at 57 suggests mild strength without commitment. The average directional index (ADX) at 26 reflects a lack of dominant trend direction, and the Awesome oscillator confirms this limbo with a value of 1,374. Momentum has dipped into cautionary territory with a reading of 678, while the moving average convergence divergence ( MACD) level at 446 suggests a hint of bullish inclination.
Moving averages (MAs), ever the blunt truth-tellers, are equally divided. Short-term signals from the 10-period exponential moving average (EMA) and simple moving average (SMA) warn of overhead pressure, sitting at $90,730 and $91,438, respectively. Yet the 20- and 30-period averages across both EMA and SMA align on the supportive side, indicating bitcoin’s soft cushion might still be intact. Further out, however, the 100- and 200-period moving averages (both EMA and SMA) continue to lean against upside enthusiasm—each stubbornly above $95,000. This setup implies that bitcoin must work very harder to reclaim any macro bullish narrative beyond a simple rally correction.
Bull Verdict:
If bitcoin maintains its footing above $90,000 and breaks decisively past $92,400 with conviction and volume, the bulls could have the momentum needed to stage a run toward the $94,000–$95,000 resistance zone. Supported by mid-range moving averages and a stabilizing market structure, this scenario would suggest bitcoin’s recent correction is simply a pause in a broader recovery arc. But as always, bulls should keep one eye on volume and the other on macro sentiment.
Bear Verdict:
Should bitcoin lose the $89,800–$89,000 support zone with strong downside volume, the path of least resistance opens toward deeper retracement. The higher moving averages leaning bearish and a faltering momentum oscillator provide little comfort. Until buyers reclaim authority above $92,400, the prevailing structure resembles a consolidation with downside risk rather than a bullish continuation.
FAQ ❓
- What is bitcoin’s current price today, January 12, 2026? bitcoin is trading at $90,524.
- What’s bitcoin’s trading range in the past 24 hours? bitcoin ranged between $90,090 and $92,392 today.
- Is bitcoin showing bullish or bearish signals right now? bitcoin is consolidating, with mixed signals across timeframes.
- Where is bitcoin likely headed next?A breakout above $92,400 could trigger upside, while a drop below $89,800 adds downside risk.


