Ethereum is showing signs of strength again. The price has risen nearly 7% in the last 24 hours and continues its recovery, showing a clear upward trend on the 12-hour chart.
This breakout is no coincidence. Ethereum has just broken out of a cup and handle pattern – a structure that typically indicates a continuation of the uptrend if confirmed by volume.
Following the breakout, the $4,000 region has once again become the focus of attention. While the technical structure is quite positive, some momentum signals and on-chain data are warning that this upward trend still carries inherent risks and is not without danger.
Ethereum confirms cup and handle pattern with volume supporting an uptrend.
On the 12-hour timeframe, Ethereum has completed a cup and handle pattern with a slightly downward sloping neckline. This slope is crucial.
A downward neckline indicates that buying pressure needs to absorb selling pressure at multiple price levels, rather than just breaking through typical horizontal resistance. Simply put, this rally requires more strength, and that's why the price is rising gradually instead of surging sharply in a single move.
On January 13, 2024, Ethereum finally broke above this neckline, accompanied by a strong bullish candle. Volume was a crucial confirming factor.
The breakout was accompanied by an increase in green buying volume, indicating genuine buyer confidence, not just a price increase due to liquidation . This reduces the risk of a rapid reversal, although the upward momentum may be slow rather than explosive.
Want more insights into the Token market like this? Sign up for Editor Harsh Notariya's daily Cryptocurrency newsletter here .
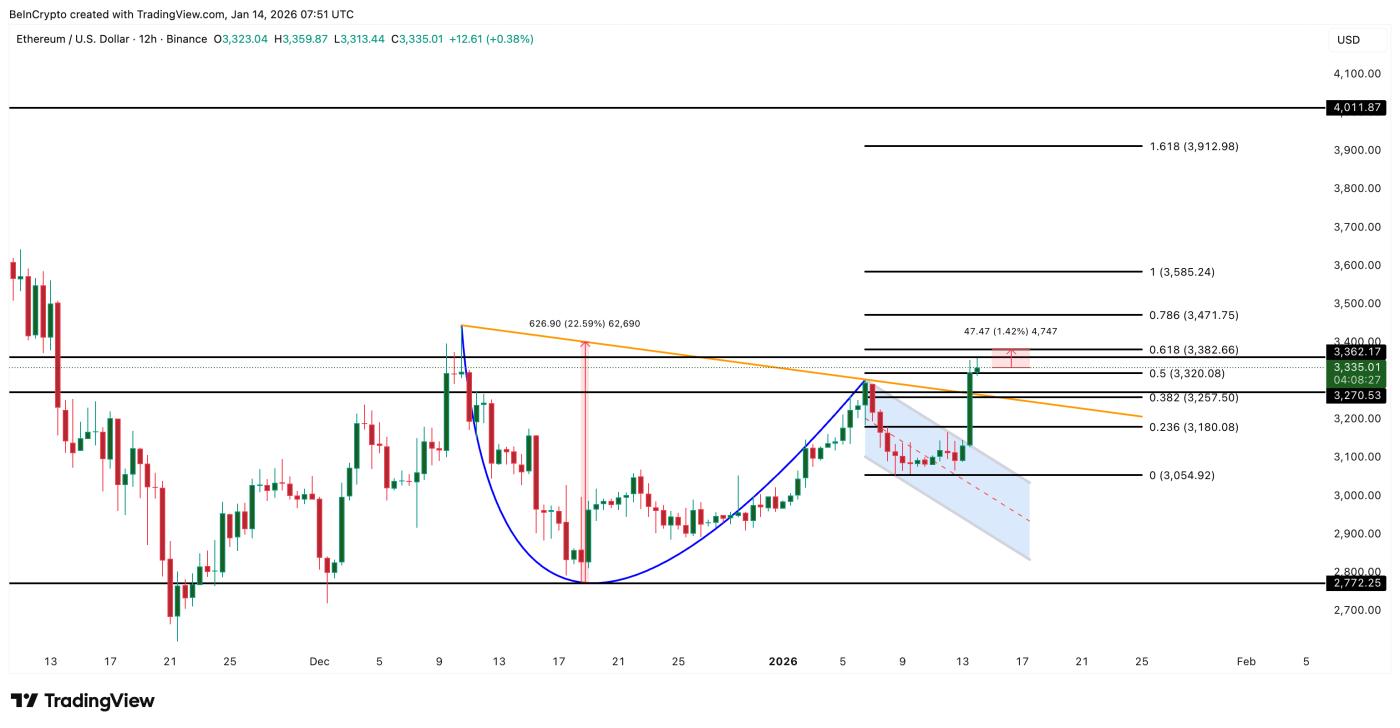
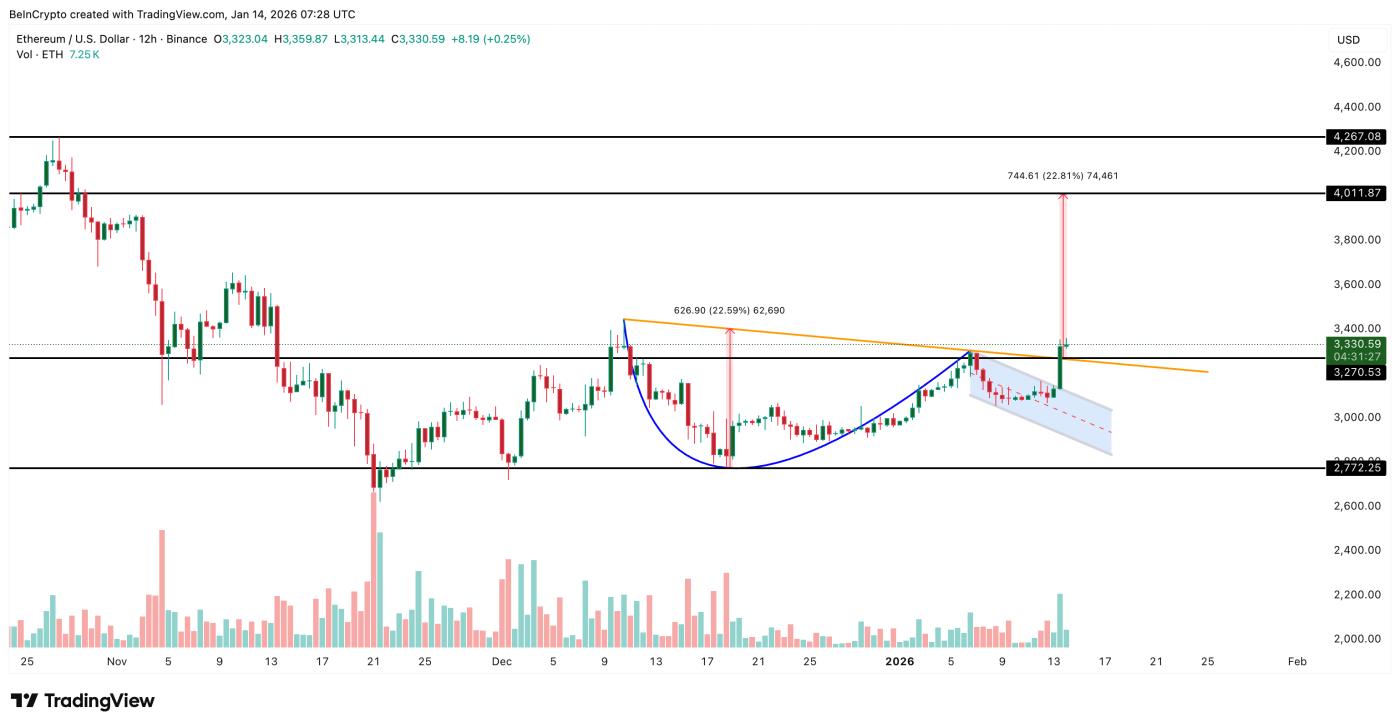 ETH Price Breakout: TradingView
Based on the pattern measured from the Dip of the cup, Ethereum's price could be heading towards the $4,010 region. This doesn't mean the price will go straight there, but it's the first time that price zone has reappeared on the technical map in several weeks.
With the technical pattern and volume in agreement, the uptrend is quite clear. The next question is whether the price momentum can be sustained.
Momentum risk arises when short-term returns increase.
Although the price structure is very stable, momentum indicators are showing some potential risks. On the 12-hour timeframe, Ethereum's Relative Strength Index (RSI) suggests a possible bearish divergence.
The RSI measures momentum by comparing recent price increases and decreases. A bearish divergence occurs when the price creates a new high while the RSI does not, often signaling weakening momentum. On a 12-hour chart, this could lead to a short-term correction.
From January 6th to January 14th, 2024, the price of Ethereum continuously increased, but the RSI Unconfirmed that strong momentum. This divergence is still forming and has not been confirmed. If Ethereum holds above the $3,360 region and the RSI continues to rise, this risk will decrease. However, for now, this is a risk, not a definitive conclusion.
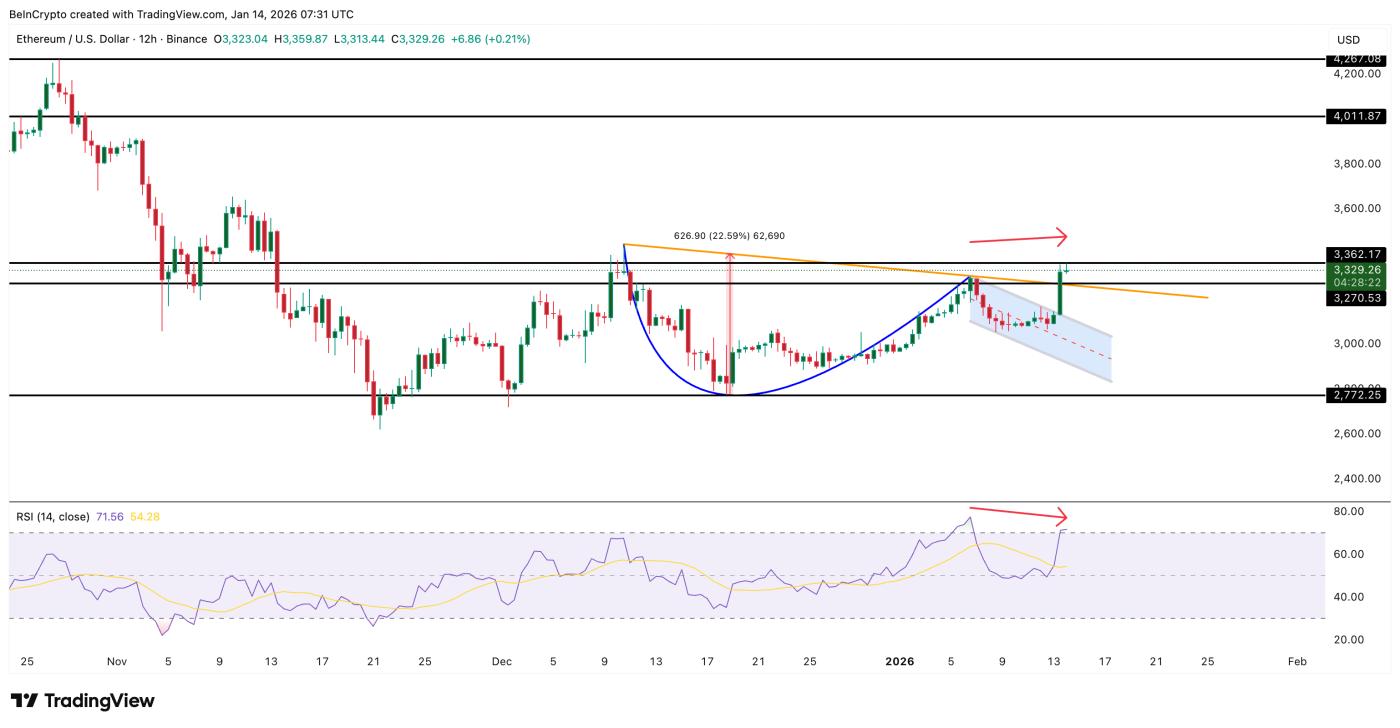 ETH RSI Divergence Developments : TradingView
on-chain data provides another perspective. The Net Unrealized Profit/Loss (NUPL) index for short-term investors has reached its highest level in about two months, although it remains within the "capitulation" zone. NUPL measures XEM investors are making a profit or a loss. When NUPL increases, it means more people are making a profit, and they may consider taking profits.
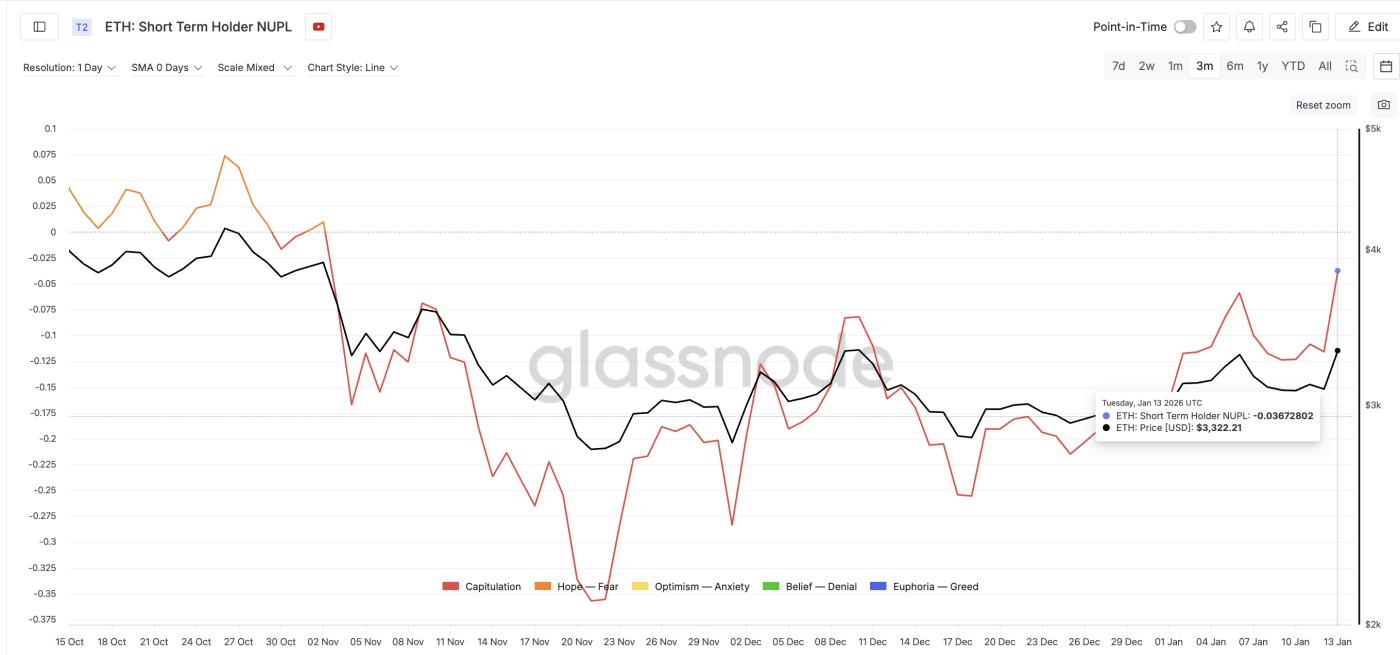 NUPL Rises: Glassnode
This is noteworthy because the last time short-term investor NUPL reached a local peak, Ethereum's price also corrected quite sharply. In early January 2024, when NUPL peaked, Ethereum reversed course and fell from around $3,295 to around $3,090, a drop of about 6%. History suggests that the current NUPL movement needs to be closely monitored.
However, there is one important difference this time. Data on coin consumption activity – measuring the number of recently purchased coins that have been moved or sold – remains relatively quiet. In the past 24 hours, the amount of coins in the 30-60 day age range that have been consumed has decreased by nearly 80% from the most recent peak, suggesting that even though profits haven't been fully realized, short-term investors are not in a hurry to sell.
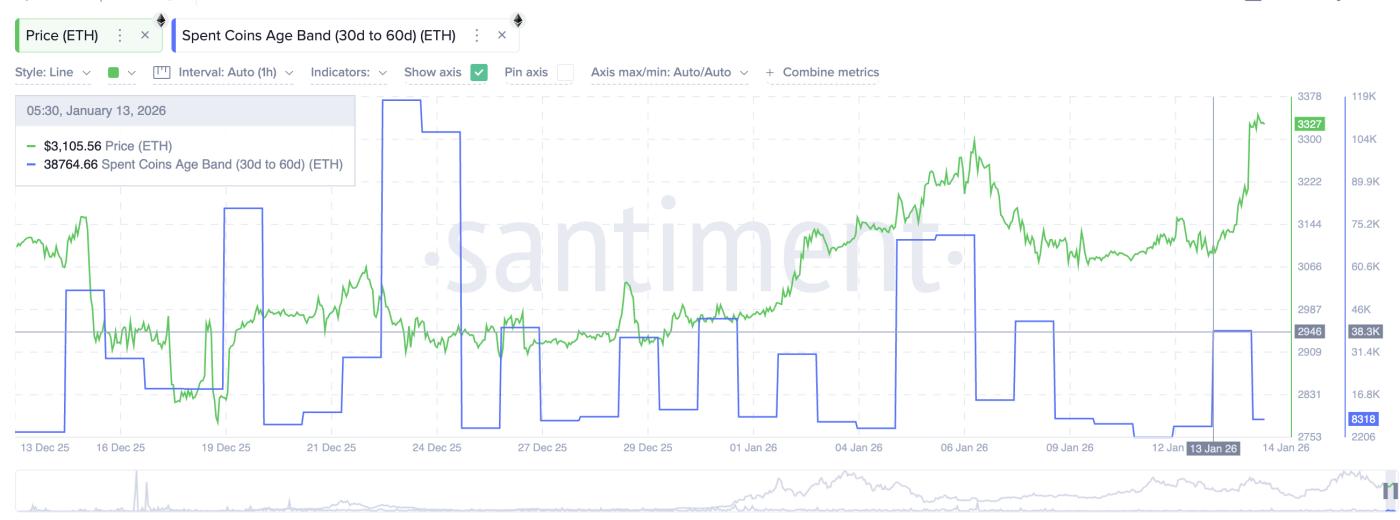 Coin Activity Drops Despite The Risk: Santiment
Despite the increase in NUPL, short-term investors have not yet engaged in mass selling. This indicates that profits are clear, but confidence has not been broken.
Current Ethereum price levels to watch.
With the trend leaning towards the buy side but risks remaining regarding upward momentum, Ethereum's next move will depend on key price levels. If Ethereum continues to hold above the $3,250-$3,270 range, a breakout remains possible. If it can maintain above the $3,360-$3,380 mark, the risk of a divergence in the Relative Strength Index (RSI) will lessen in the near future, giving upward momentum a chance to recover.
If the price closes above this zone clearly, Ethereum could continue toward target zones of $3,580, then $3,910, and finally the psychological range of $4,000–$4,010.
 Ethereum Price Analysis: TradingView
Conversely, if the bullish momentum risk occurs (when the next candle closes below $3,360), a correction is likely. A loss of the $3,250 level would weaken the short-term structure. In that case, the $3,180 and then $3,050 levels would become potential support points, especially if retail investors begin taking profits after accumulating unrealized gains.
Ethereum doesn't necessarily need to wait for all the perfect conditions to rise in price. The key is for volume to remain stable, momentum risk to diminish, and for retail investors to remain patient. If everything goes smoothly, the $4,000 target will no longer be a distant expectation but will become a significant price level.