Long-term holders' selling has slowed, institutional balance sheet cash flows have stabilized, and the spot market has begun to shift to a buy-dominated mode, suggesting that most of the selling pressure expected by the end of 2025 has now been absorbed.
Written by: glassnode
Compiled by: AididiaoJP, Foresight News
Bitcoin entered the new year with strong momentum, setting two consecutive highs and pushing the price to $97,000. This surge at the beginning of the year brought the price directly to a historically significant supply level.
Execution Summary
- Bitcoin remains in a low-volatility consolidation phase, with the compressed trading range masking rising inherent fragility and unresolved directional beliefs.
- The options market continues to price higher downside convexity, indicating that demand for tail risk remains robust despite improved spot and derivatives positioning.
- Volatility risks are being postponed rather than mitigated, and the market will be vulnerable to sudden repricing once liquidity conditions change.
- After a full de-risking cycle, institutional balance sheet cash flows have stabilized, but the accumulation remains uneven and event-driven rather than structurally sustainable.
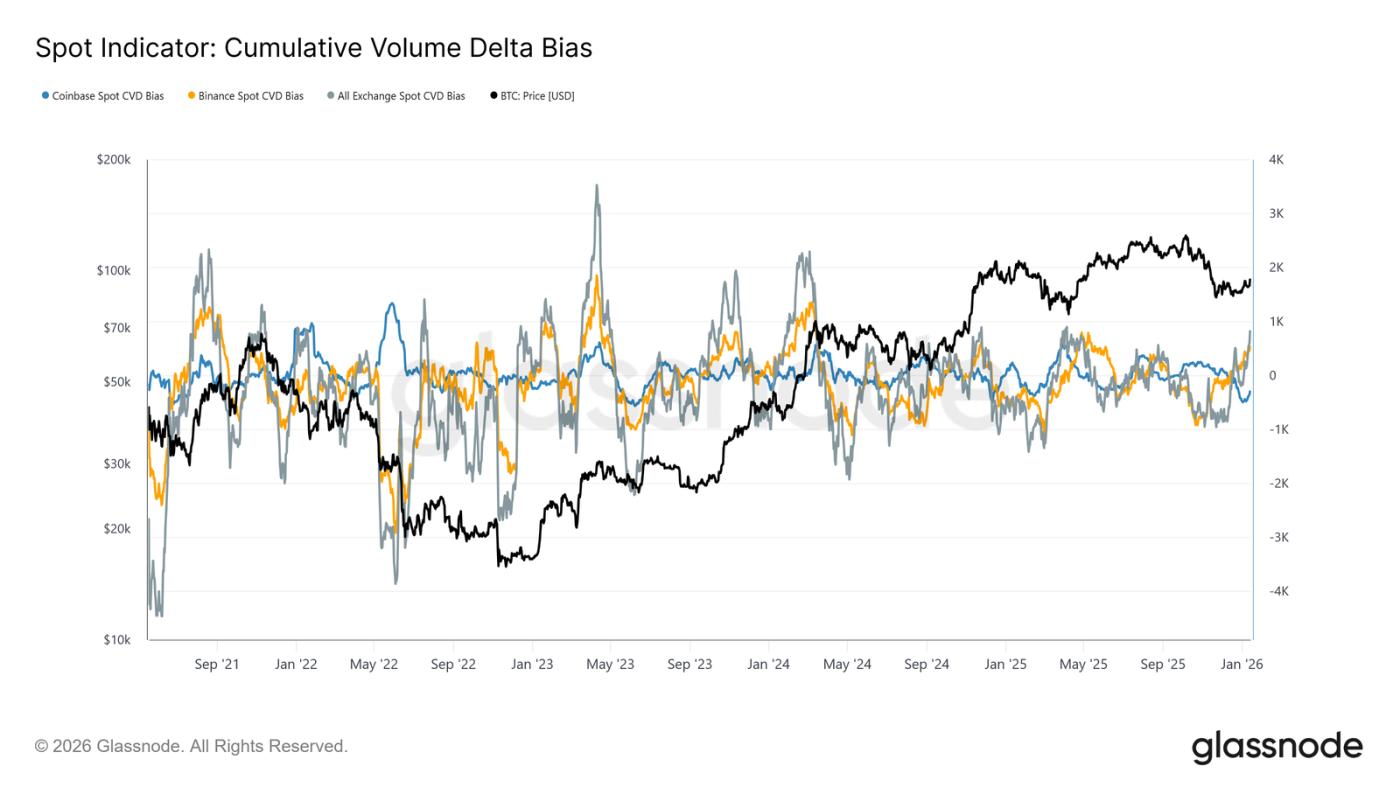
- Spot market behavior has shifted to a more constructive stance, with Binance and other exchanges aggregating fund flows into a buy-driven pattern, while selling pressure on Coinbase has eased significantly.
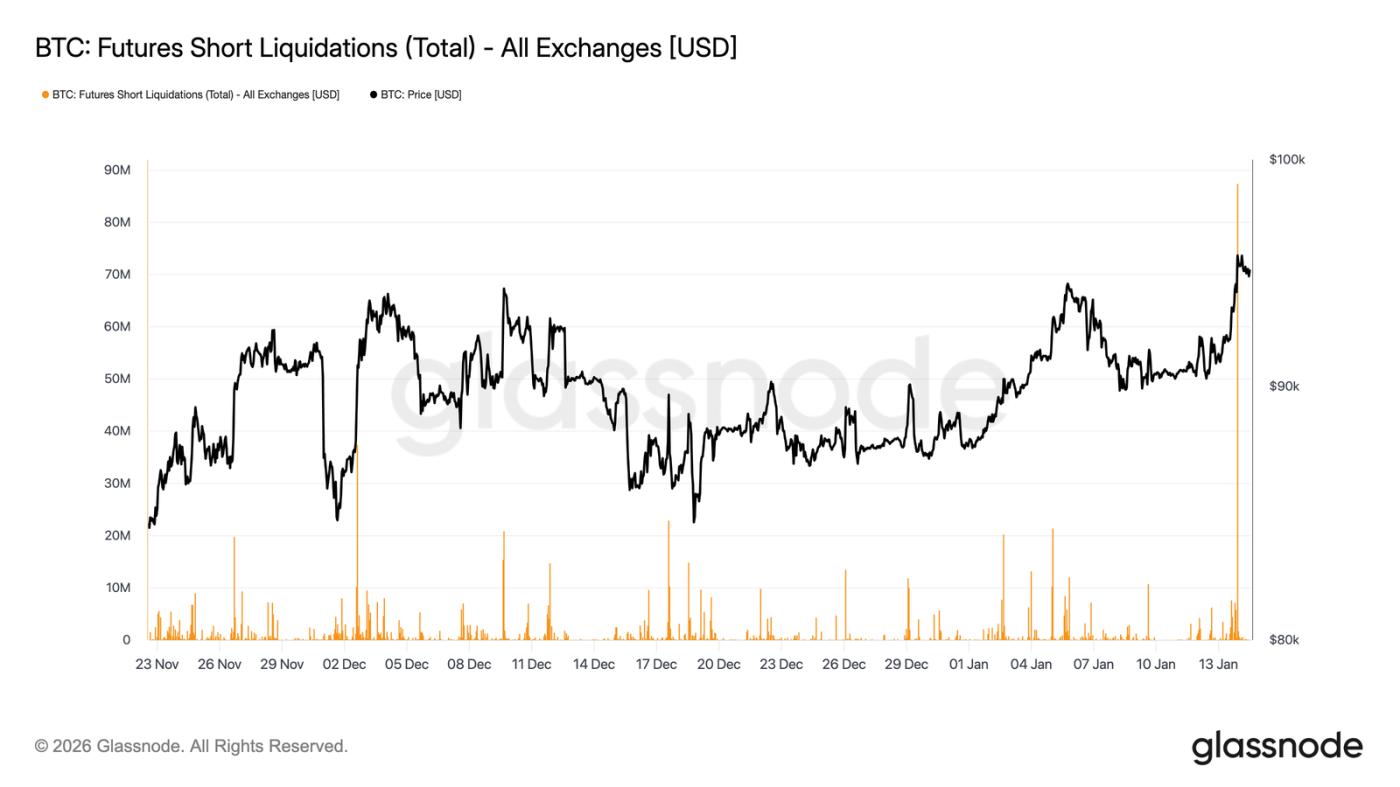
- The recent surge to the $96,000 area was primarily driven by a short squeeze dominated by derivatives, with relatively thin futures trading volume.
- Selling by long-term holders has slowed, and cost base clusters and confidence zones are forming an emerging structural price bottom.
- Until sustained cash accumulation re-emerges, broader market direction will increasingly depend on liquidity conditions and derivatives positions.
On-chain insights
Above supply test
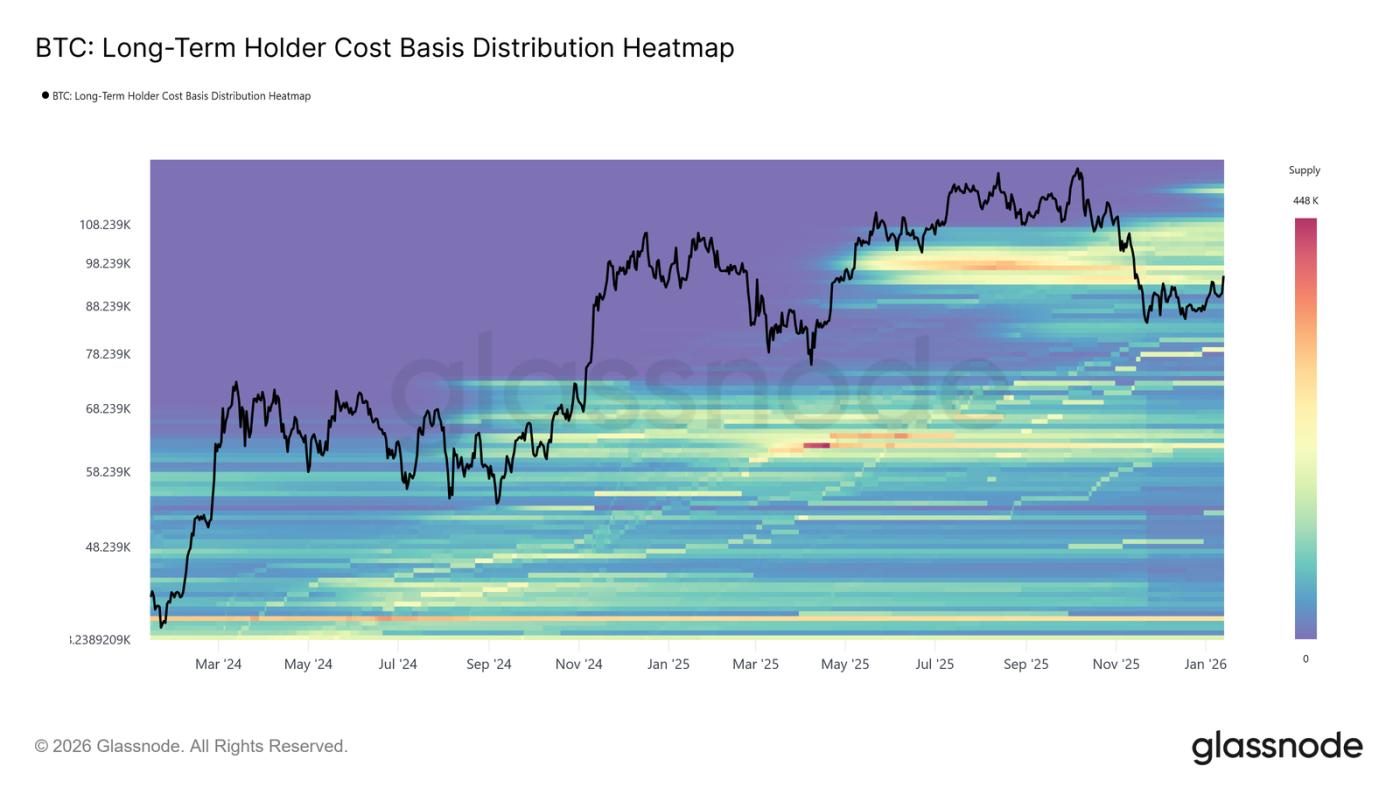
Bitcoin entered the new year with constructive momentum, hitting two consecutive highs and pushing the price to $97,000. However, this surge at the beginning of the year has directly brought the price to a historically significant supply zone. The current market price is within a dense cluster of long-term holders, which accumulated between April and July 2025, a period marked by sustained selling near cycle highs.
As shown in the long-term holder cost base distribution heatmap, the rebound since November 2025 has repeatedly stalled near the lower boundary of this cluster, which is roughly between $93,000 and $110,000. Each attempt to move higher has encountered new selling pressure, preventing a structural recovery in prices.
This area has consistently served as a transitional barrier, separating corrective phases from sustained bull market phases. With prices pushing back into this upper supply zone, the market now faces a familiar test of resilience, where absorbing sell-offs from long-term holders is a prerequisite for any broader trend reversal.
Cost base
Facing renewed selling pressure from top buyers, attention is turning to the cost base for short-term holders, currently at $98,300. This level represents the average entry price for recent investors and is a key indicator of market confidence. Continued trading above this level would suggest that new demand is absorbing the supply above, allowing recent buyers to remain profitable.
Historically, recovering and maintaining prices above short-term holders' cost basis has signaled a transition from a correction phase to a more sustained uptrend. Conversely, repeated failures to stabilize above this level could reinforce defensive behavior from new participants. Therefore, whether prices can consolidate above $98,300 remains essential for restoring confidence in the trend's continuation and establishing a foundation for a sustainable rebound.
Long-term LTH holders slow down selling.
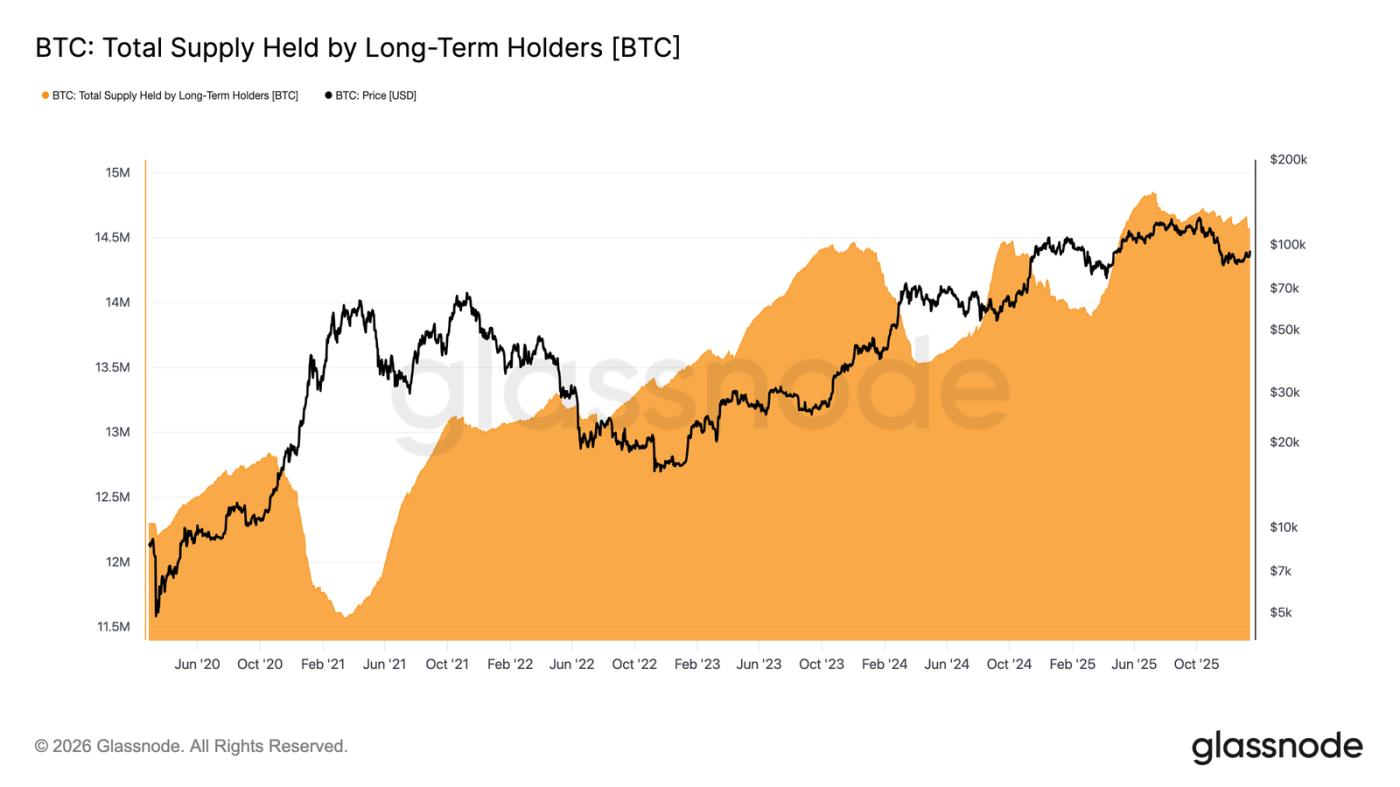
As prices push into the supply zone of long-term holders, the focus shifts to whether these investors are accelerating their sell-off or beginning to ease selling pressure. A useful metric is the total supply held by long-term holders, which reflects the balance between coins older than approximately 155 days (newly matured into long-term holding coins) and coins that have been spent.
Currently, the supply from long-term holders continues to decline, but the rate of decline has slowed significantly compared to the aggressive sell-off seen in the third and fourth quarters of 2025. This indicates that long-term holders remain net sellers, but the intensity of their selling is weakening.
For a sustainable rebound to occur, the market must transition to a state where newly matured supply exceeds the spending of long-term holders. This shift will increase LTH supply, a structure last observed between August 2022 and September 2023, and again between March 2024 and July 2025, both periods preceding stronger and more sustained trend resurgences.
Demand and Sell-off
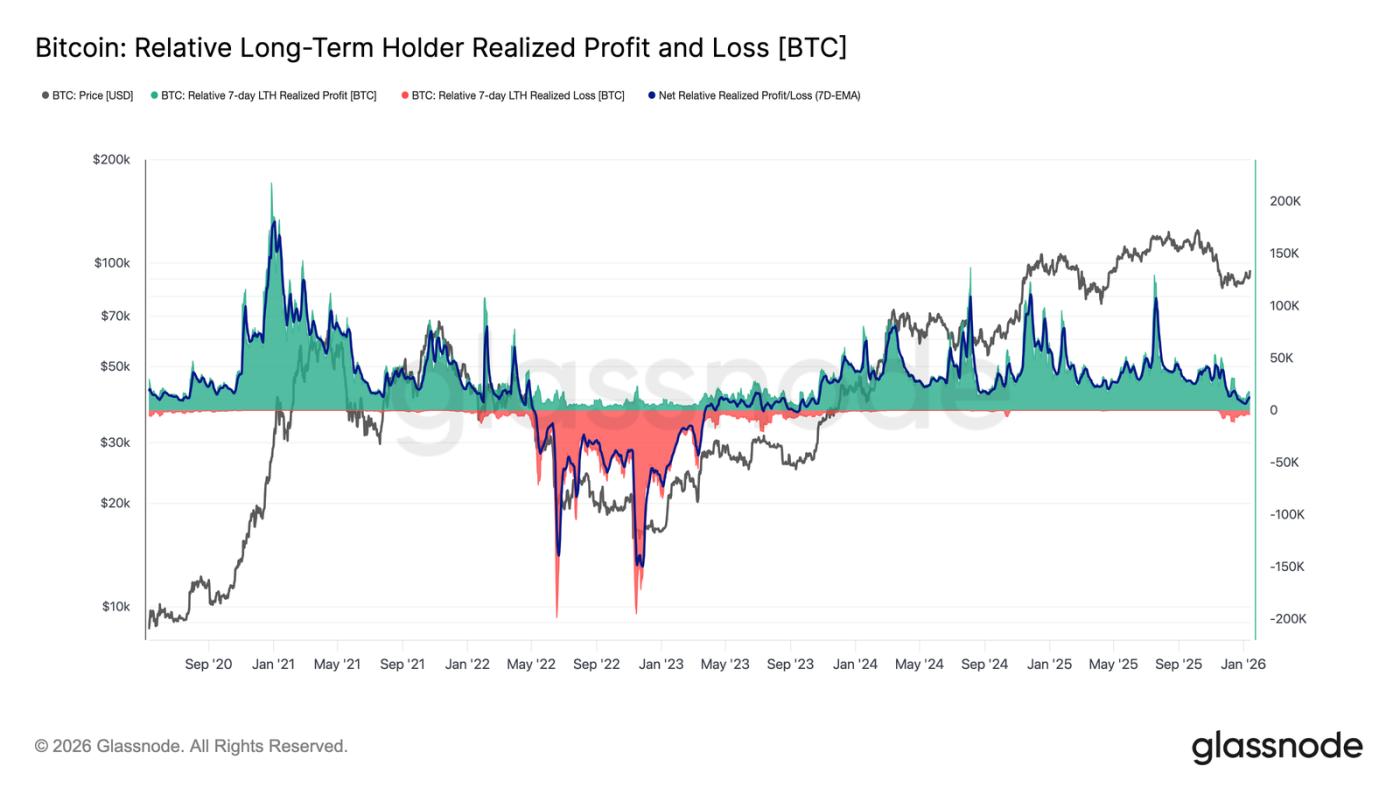
In summary, long-term holders who accumulated positions in the second quarter of 2025 remain the most likely source of selling pressure should prices decisively break through the supply cluster above. Their behavior is well captured by the long-term holder net realized profit/loss metric, which currently reflects a significantly milder selling pressure.
Currently, long-term holders are net realizing approximately 12,800 BTC per week, a significant slowdown compared to the peak of the cycle when it exceeded 100,000 BTC per week. This easing indicates that profit-taking remains active, but is far less aggressive than during previous sell-off phases.
Subsequent developments will largely depend on the demand side's ability to absorb this supply, particularly the supply accumulated by investors in the second quarter of 2025. In the long term, failure to maintain above the real market average of approximately $81,000 will significantly increase the risk of entering a deeper capitulation phase, similar to the situation between April 2022 and April 2023.
Off-chain insights
Institutional Fund Flow Reset
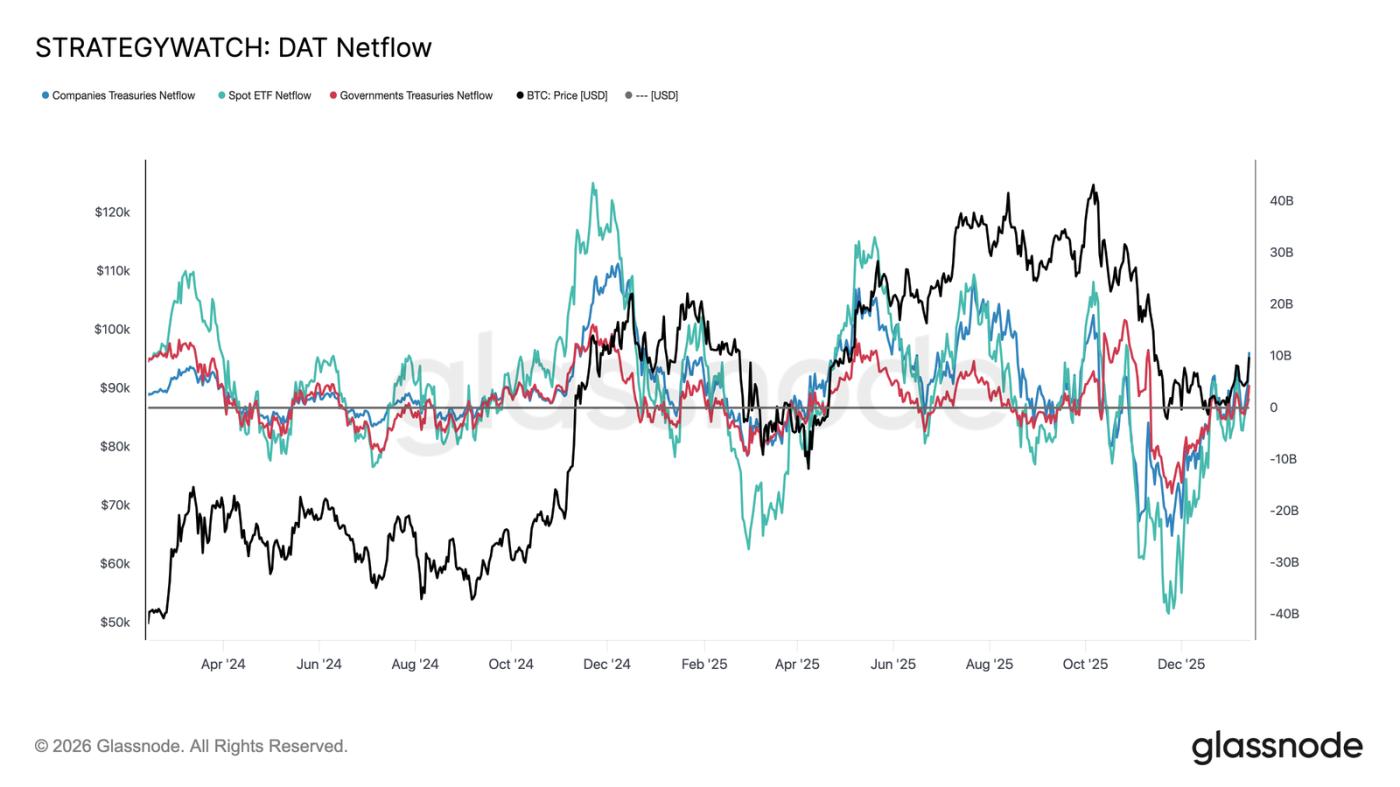
Over the past few months, institutional balance sheet flows have undergone a complete reset. After a prolonged period of significant outflows from spot ETFs, corporations, and sovereign entities, net flows have now stabilized, indicating a clear easing of selling pressure from long-term structural holders.
Cash ETFs were the first to turn around, returning to positive territory and re-establishing their position as major marginal buyers. Since their inception, cash ETFs have played a significant role in every expansion phase, and their renewed inflows indicate that real money allocators are once again beginning to rebuild their exposure, rather than simply trading volatility.
Corporate and sovereign treasury cash flows have also leveled off, with inflows appearing sporadically during consolidation phases. However, the cumulative effect remains uneven and event-driven, lacking consistency.
In this environment, balance sheet demand serves more as a price stabilizer than a growth engine, making near-term direction increasingly sensitive to derivatives positions and short-term liquidity conditions.
The flow of funds in the spot market is becoming more constructive.
Following the recent pullback, spot market behavior has begun to improve, with Binance and exchange-aggregated CVD indicators returning to a buy-dominant pattern. This reflects a shift from persistent selling pressure, indicating that market participants are once again absorbing supply rather than selling during periods of strength.
Meanwhile, Coinbase, which had been the most stable source of selling pressure throughout the consolidation period, has significantly slowed its selling activity. The easing of Coinbase-led selling pressure, eliminating a key source of supply, has helped stabilize prices and cleared the way for the current rebound.
While spot participation has not yet shown the sustained, positive accumulation typically seen during full-blown trend expansions, the return to net buying in major trading venues represents a constructive structural shift.
Futures traders squeeze short positions
While the push to the $96,000 area was mechanistically reinforced by short liquidation, this process also occurred against a backdrop of relatively thin derivatives trading volume. Futures turnover remains well below the high levels seen for most of 2025, even as prices have recovered to higher levels.
This indicates that the breakout occurred in a relatively illiquid environment, where even modest position changes could trigger a disproportionately large price reaction. In fact, a large influx of new funds is not required to squeeze short sellers out of the market and push prices above resistance.
This makes the market dependent on whether spot demand and sustained trading volume can now intervene to support the continuation of the trend, or whether the rebound will face the risk of fading once the mechanical buying pressure from forced liquidation is exhausted.
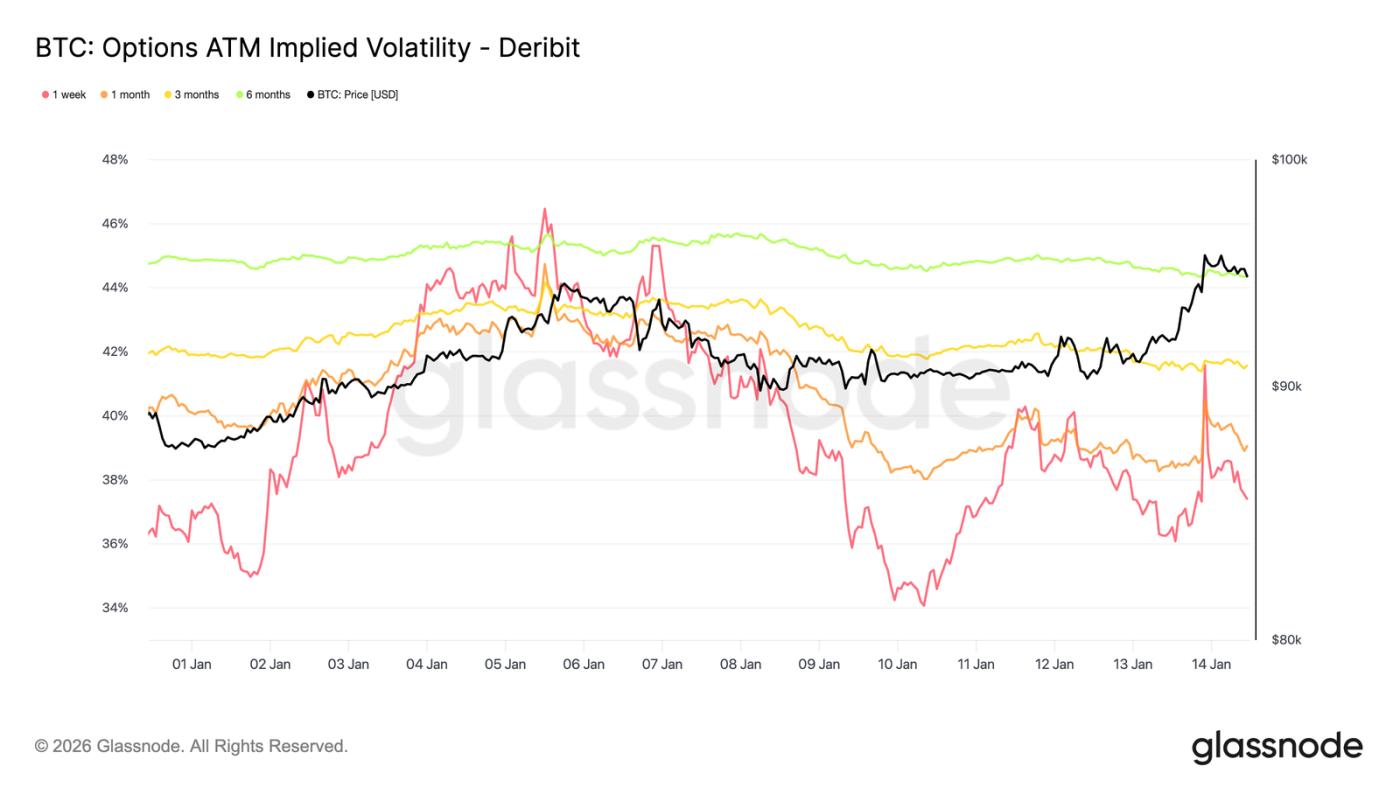
Low volatility, unresolved risks
Implied volatility remained low across the curve, reinforcing the calm observation of near-month price movements. Longer-term implied volatility has been trending slightly lower, while shorter-term implied volatility has been more directly responsive to spot price movements. However, these front-end reactions have not translated into longer-term movements, suggesting limited demand for near-term convexity.
This does not mean that uncertainty has disappeared. Rather, it indicates that risk is being postponed. The options market is not expressing confidence, but rather the view that any meaningful repricing is more likely to occur later than immediately.
Volatility gradually increases with maturity, indicating that uncertainty is attributed to time rather than specific near-term catalysts. The term structure is adjusting horizontally rather than changing shape, which is consistent with a market that expects short-term stability but remains exposed to potential risks.
This is important because volatility suppressed by position rather than market clarity tends to be suddenly repriced when conditions change.
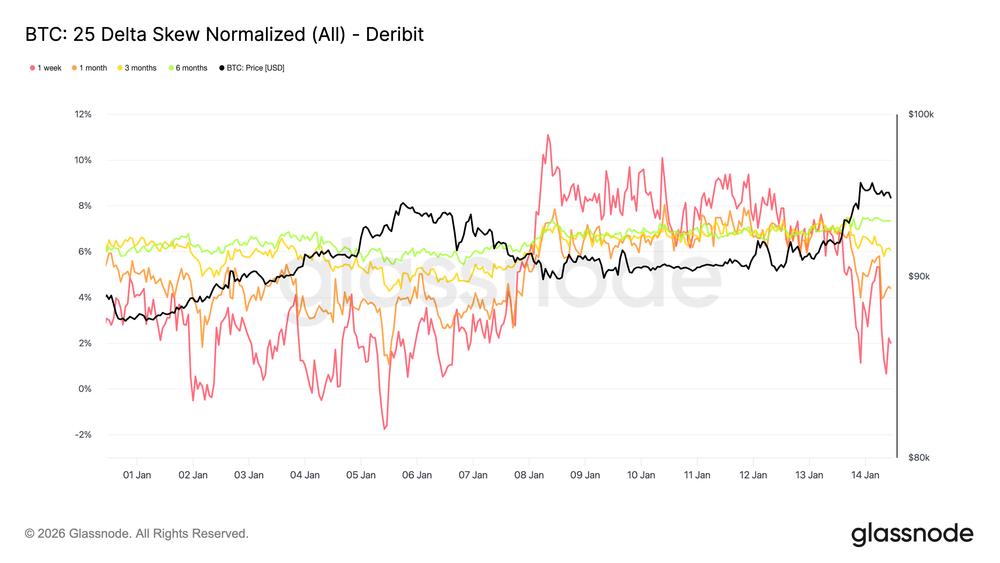
Downside asymmetry is still being firmly priced in.
While overall volatility remains low, skew continues to price downside risk. The 25-delta skew still favors put options, particularly in the medium and long term, indicating that demand for long-term downside protection will persist even if the spot market stabilizes and recovers the $95,000 level.
This reflects a market that is willing to hold exposure but unwilling to do so without insurance. The fact that protection was maintained rather than actively increased indicates caution rather than pressure. Short-term skew briefly balanced out before turning back in favor of put options, while long-term skew showed little reaction to prices returning above $95,000.
The coexistence of low volatility and negative skewness highlights a key paradox: participants are not positioning themselves for an impending downturn, yet they continue to pay for asymmetric protection.
This combination is typical in range-bound markets, where risks are recognized but not expected to materialize immediately.
fragile stability
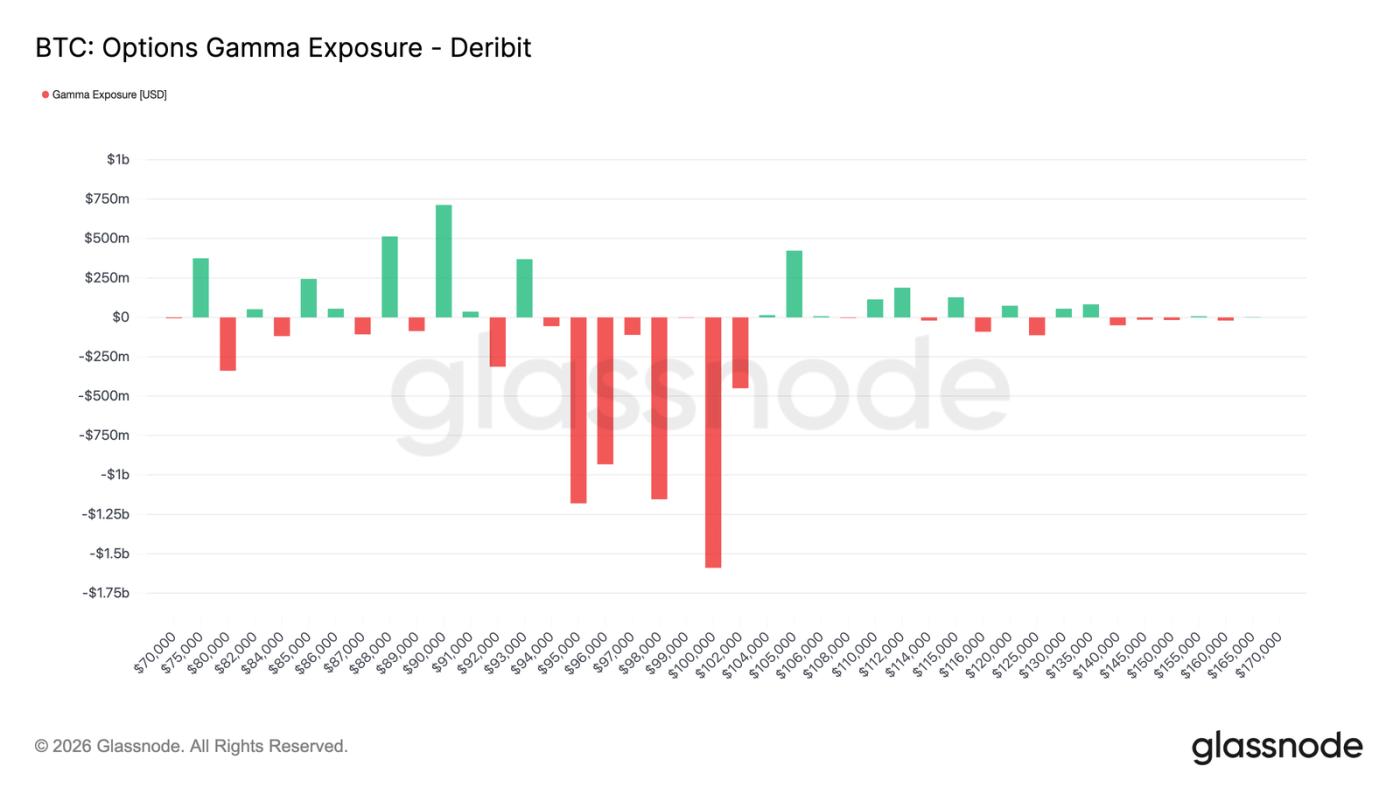
The current strike price distribution puts market makers in a negative position near the spot price, altering the market's short-term dynamics. In a negative environment, hedging flows no longer absorb price movements but tend to amplify them; market makers buy when prices rise and sell when prices fall.
At the time of writing, spot trading is near the $95,000 to $96,000 area, with prices entering a negative zone roughly extending from $94,000 to $104,000. Within this range, sustained price movements supported by trading volume are more likely to trigger directional hedging flows, increasing the likelihood of prices accelerating towards nearby high-interest strike prices, including the $100,000 level.
This structure creates a fragile stability. While volatility may remain low when prices are confined within a range, once momentum builds, price movements are more likely to accelerate than subside. In this context, calm price action reflects positioning rather than market equilibrium, making the market more susceptible to sudden repricing rather than gradual adjustments.
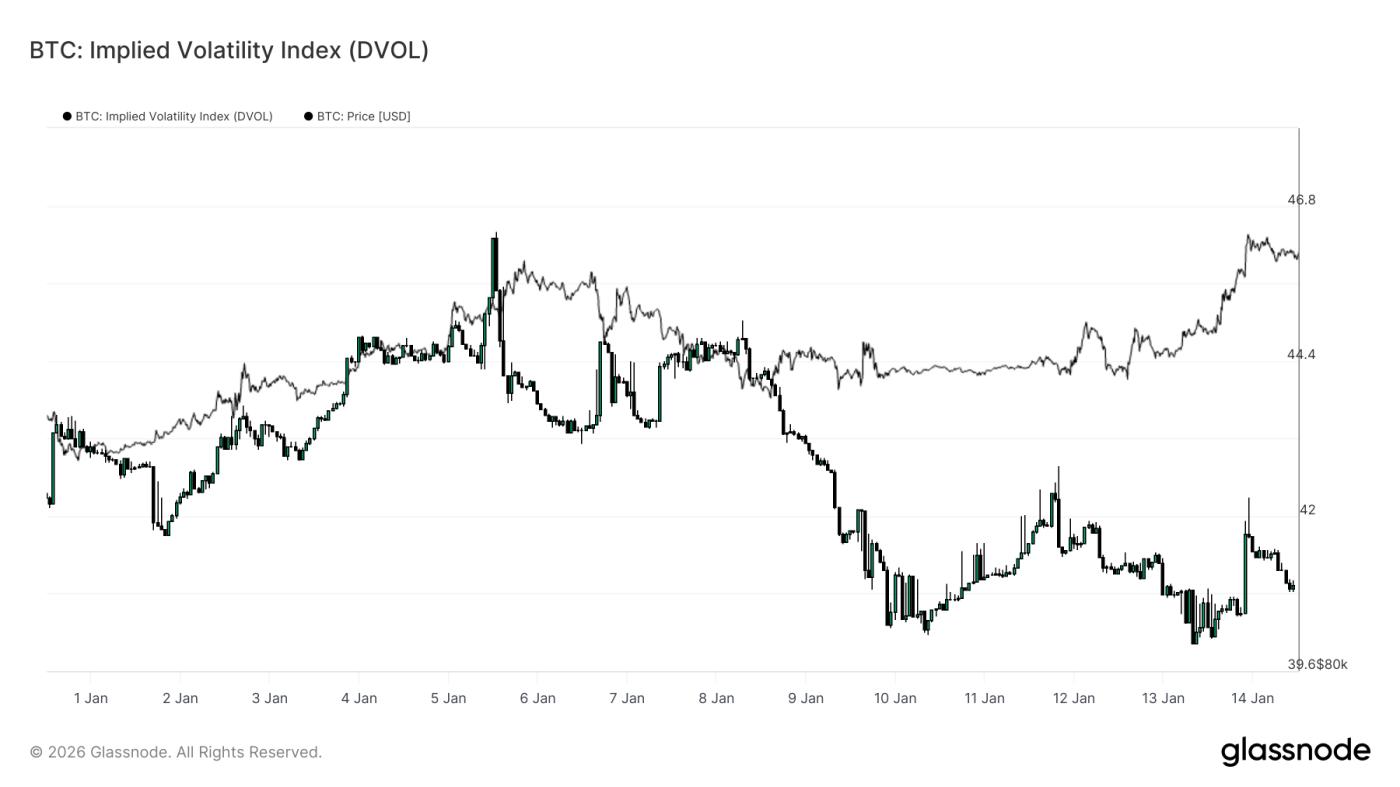
DVOL confirms volatility is being delayed.
The Implied Volatility Index (DVOL) provides a full-surface view of implied uncertainty for options by aggregating volatility across different strike prices and maturities. Unlike at-the-money (ATM) implied volatility, which only reflects pricing at a single point on the curve, DVOL captures how much volatility the market has priced in overall.
Currently, DVOL remains relatively low and range-bound, even though the spot market has broken through key levels. This confirms what the term structure and skewness suggest: the options market is not paying a premium for immediate volatility. Uncertainty is acknowledged, but not expressed through higher overall volatility pricing.
Importantly, this low DVOL reading coexists with a downward skew and negative Gamma positions near the spot market. Therefore, volatility is not compressed by stable hedging flows, but merely delayed at the surface level. This combination creates conditions where volatility may remain dormant, but will be sharply repriced once a catalyst forces position adjustments.
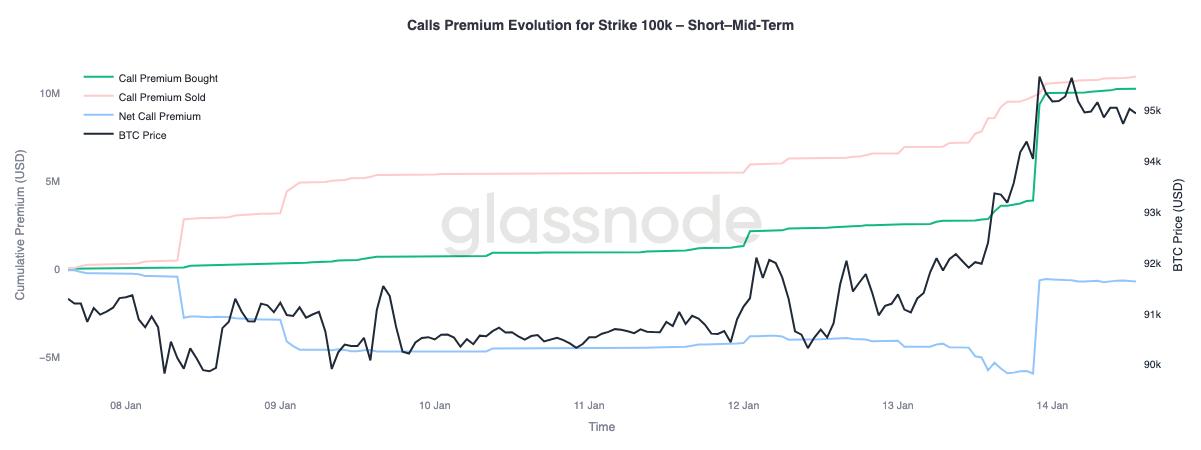
A call option premium signal indicates a conditional upward trend.
A close examination of the premium behavior of the $100,000 call option strike price reveals significant differences across different expiration dates. This level remains the next major psychological threshold, and option fund flows show how the market positions itself around this level.
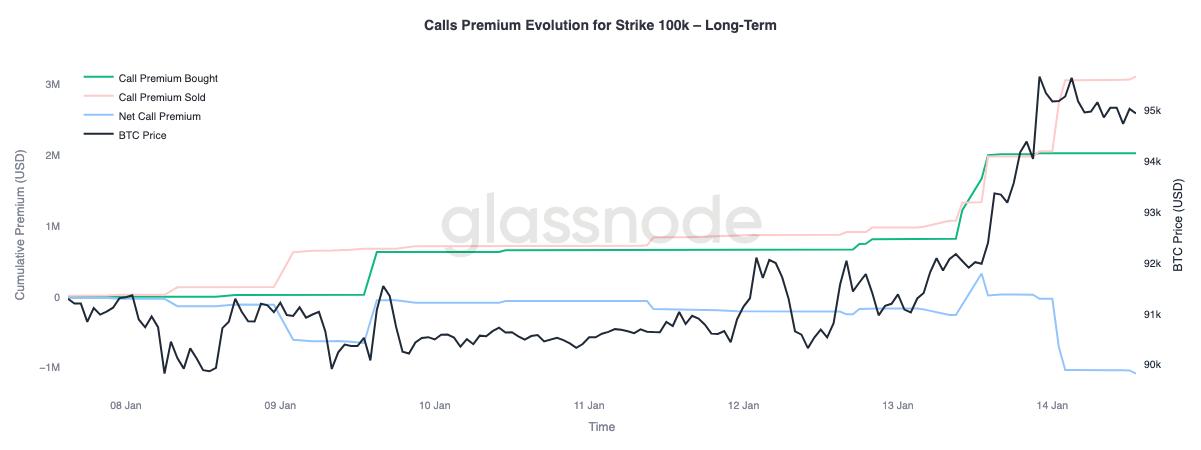
In short to medium-term timeframes (roughly three months), the premium for bought call options significantly exceeds that for sold call options. This imbalance pushes up the net call option premium, indicating active demand for near-term upside exposure as the spot market approaches this level. In contrast, longer timeframes show the opposite behavior. As the spot market rebounds, the more expensive call option premiums on the longer-term curve are used as opportunities to sell on rallies.
This divergence suggests that the market is positioning itself for a potential retest of the $100,000 area, while also expressing hesitation about whether it can sustain above that level for an extended period. Upside has been tactically targeted recently, but profit-taking has occurred over the longer term.
in conclusion
Bitcoin has entered a transitional phase characterized by stabilizing structural cash flows, improved spot market behavior, and a derivatives system still shaped by deferred volatility risk. Selling by long-term holders has slowed, institutional balance sheet cash flows have stabilized, and the spot market has begun to shift towards a buy-driven pattern, suggesting that much of the selling pressure expected by the end of 2025 has now been absorbed.
However, the recent move into the $96,000 area has been driven more by institutional positioning dynamics than by broad organic demand. Futures liquidity remains thin, and while spot participation has improved, it has not yet shown the sustained accumulation typically seen during periods of broad-based trend expansion.
Looking ahead to the first quarter, the underlying market structure appears increasingly constructive. With selling pressure easing and volatility risk being postponed rather than released, relatively modest inflows could trigger another significant price reaction. If spot accumulation and ETF-driven institutional demand continue to rebuild, the current consolidation phase could form the basis for a new trend extension.