

Blockchain tracking tool and on-chain transaction tracking.
1. Blockchain Explorers (Etherscan, BscScan, Solscan,…)
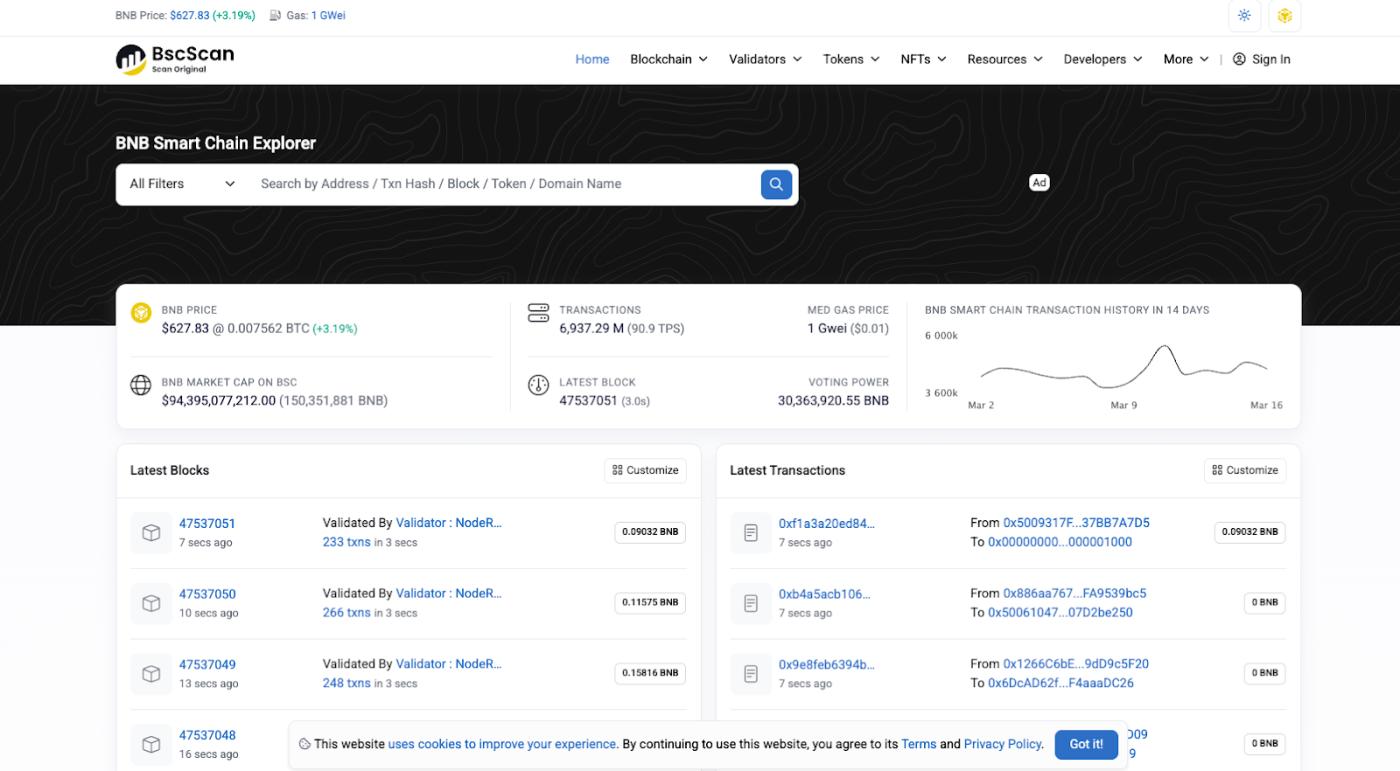
These tools help track transaction information directly on blockchains such as Ethereum, BNB Chain, Solana, etc. Users can look up transaction history, check wallet balances, Token issuance, and detect large transactions or unusual transactions by large investors (whales) early on, effectively supporting the assessment of the transparency and security of crypto projects.
Why should you use Blockchain Explorer?
✅ Verify transaction: Confirm XEM the transaction has been successfully executed.
✅ Track wallet addresses: XEM the balance, transaction history, and activity of any wallet.
✅ Inspect the smart contract: XEM the source code details and contract functionalities.
✅ Money flow detection: Tracking large sums of money moving across the blockchain helps predict market trends.
Each blockchain has its own data explorer tool. Here are some popular explorers:
Calcium | Blockchain Explorer | Path |
Ethereum (ETH) | Etherscan | |
Binance Smart Chain (BSC) | BscScan | |
Polygon (POL) | Polygonscan | |
Solana (SOL) | Solscan | |
Arbitrum (ARB) | Arbiscan | |
Avalanche (AVAX) | SnowTrace | |
Fantom (FTM) | FTMScan | |
Optimism (OP) | Optimal Explorer | optimistic.etherscan.io |
2. DeBank
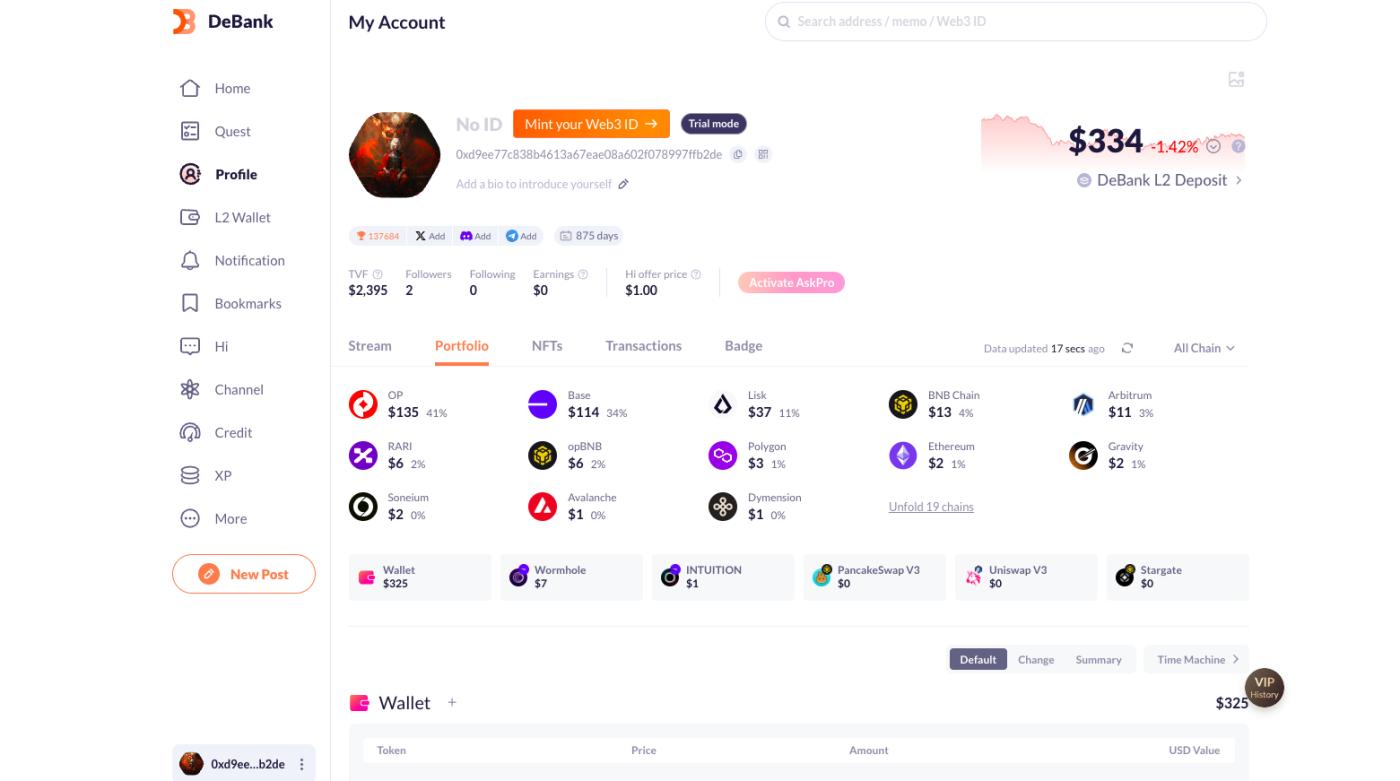
DeBank is a specialized platform that helps users track DeFi assets, analyze portfolios, and monitor the activity of wallet addresses across multiple blockchains. It supports most popular DeFi protocols, making it easy for investors to manage their assets and evaluate their investment performance.
Key features of DeBank
Supports more than 30 blockchains, including Ethereum, BNB Chain, Polygon, Arbitrum, Optimism, Avalanche, Fantom, Solana, zkSync, etc.
Automatically displays the user's net worth across all networks.
Displays Token, Non-Fungible Token, stablecoins, and assets being Stake in DeFi protocols.
Advanced crypto project analysis and evaluation tools
1. Messari
Messari is a specialized crypto market research and analysis platform that provides financial and on-chain data for numerous cryptocurrency projects. The platform stands out with its in-depth reports from leading industry experts, giving investors and institutions a more comprehensive and accurate overview of the market. Additionally, Messari offers powerful data filtering tools, allowing users to search and evaluate potential projects based on various criteria such as ROI, market Capital , cash flow, and ecosystem development. This enables investors to make more informed decisions when choosing projects to invest in.
Practical applications:
Monitor the financial reports and on-chain data of each project to assess its progress.
Filter the data to find projects with the best ROI over time.
Read market reports to understand long-term trends.
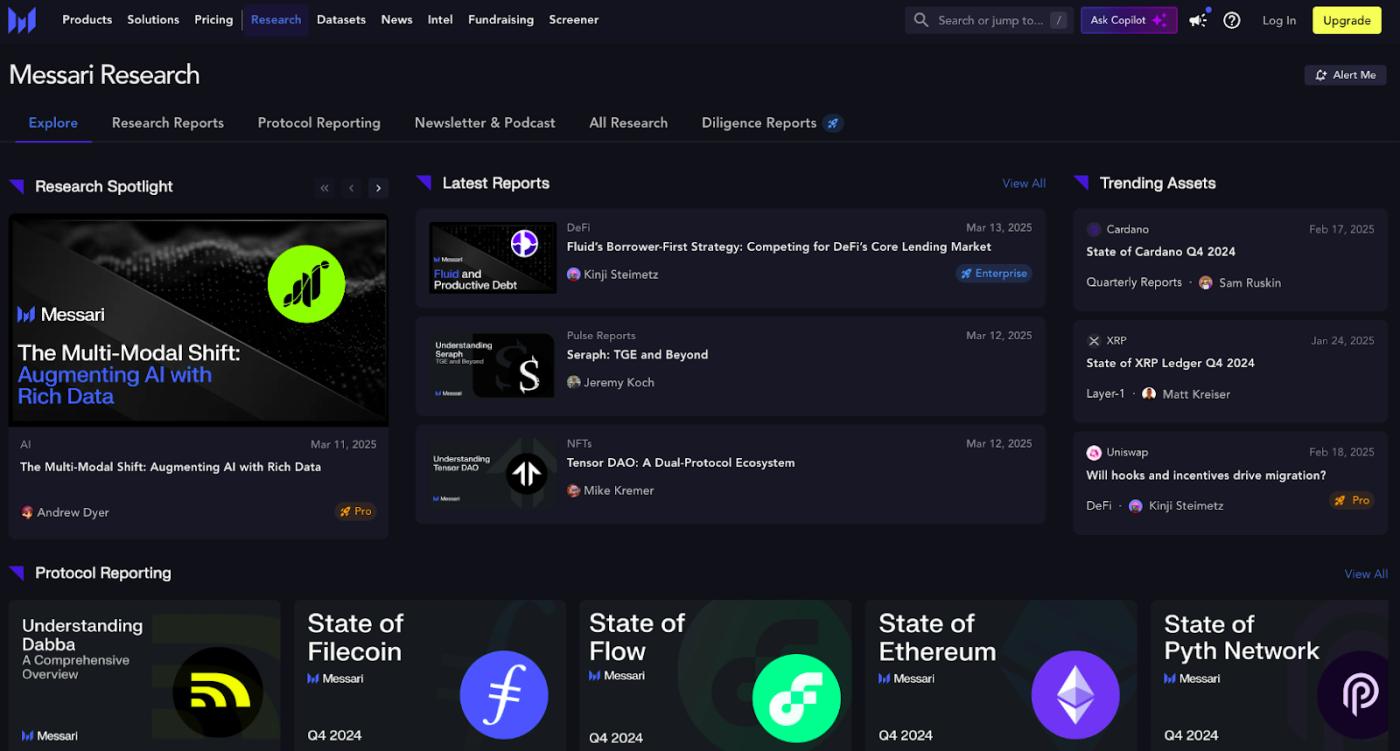
Messari reports are highly regarded for their completeness and detail, covering everything from projects and ecosystems to market overviews.
2. CryptoQuant
CryptoQuant is a platform specializing in providing on-chain data that helps investors track money flows in the crypto market. It's an extremely useful tool for analyzing investor sentiment, detecting signs of accumulation, distribution, or price manipulation by whales and large institutions.
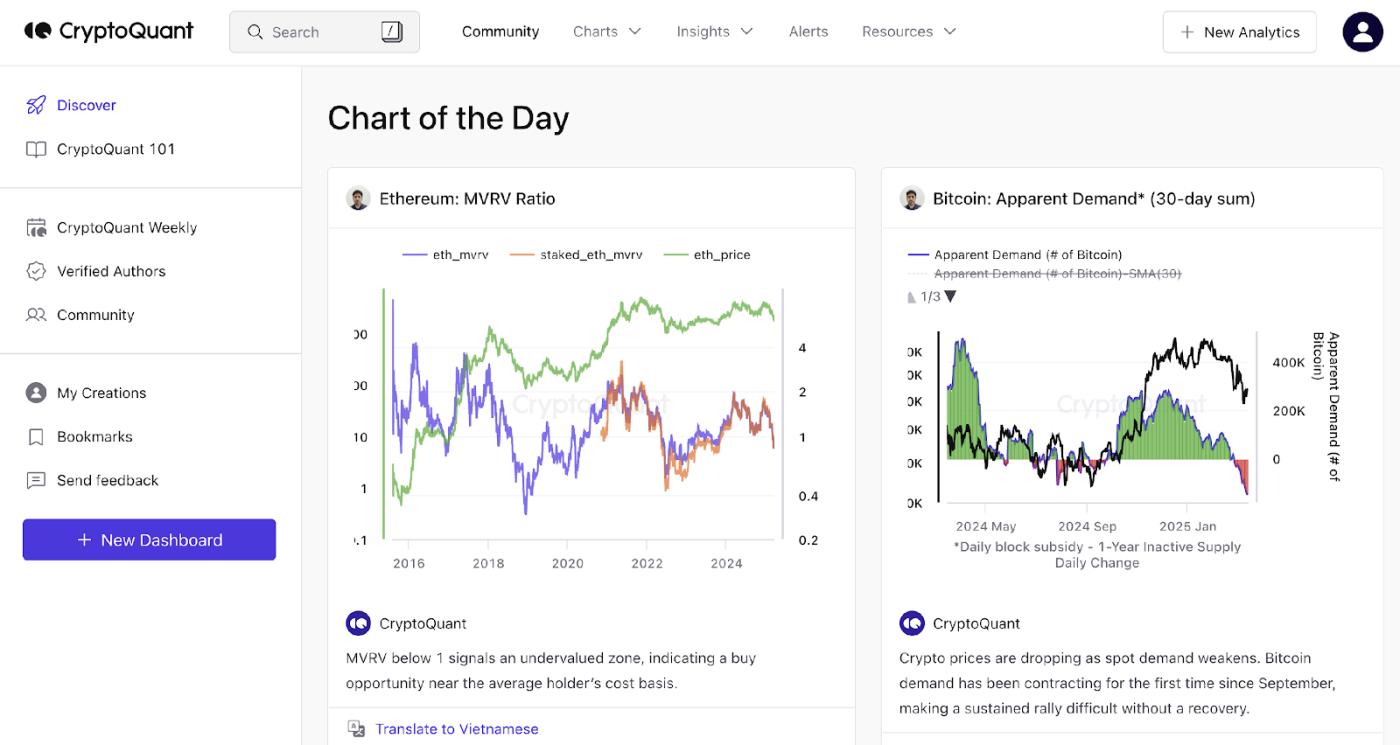
CryptoQuant provides data on:
The flow of funds deposited and withdrawn from the exchange helps to determine the buying/selling trend of the market.
Whale Flow → monitors large transactions and changes in investment behavior.
The amount of stablecoins on exchanges measures the market's willingness to invest.
Miners Position Index (MPI) tracks whether miners are selling BTC to cover their costs.
Market sentiment analysis → predicts whether investors are experiencing fear (FUD) or excitement (FOMO).
Key indicators on CryptoQuant
Index | Meaning | Practical applications |
Exchange Inflows | Amount of BTC/ ETH sent to the exchange | If the inflow of money into the market increases sharply → Investors may prepare to sell, and prices may fall. |
Exchange Outflows | Amount of BTC/ ETH withdrawn from exchange | If the outflow of funds from the exchange increases → Investors are accumulating, and the price may rise. |
Stablecoin Reserves (Stablecoin reserves on exchanges) | Total number of stablecoins (USDT, USDC, BUSD, etc.) currently on the exchange. | If the amount of stablecoins on exchanges is high → This is a sign that money is about to flow into crypto, and the market may rise. |
Miner Position Index ( Miners) | XEM whether Miners are selling BTC . | If MPI increases → Miners are selling BTC to cover costs, which could put downward pressure on the price. |
Whale Ratio (Ratio of whales trading on the exchange) | Measure the proportion of transactions from whales relative to the total Volume. | If the Whale Ratio is high, whales may be manipulating the price; caution is needed. |
BTC Futures Open Interest | Total number of open contracts in the Derivative market | If open interest increases sharply → The market could experience significant volatility. |
Funding Rate ( Futures Contract funding rate) | Measure the difference between futures prices and spot prices. | If the Funding Rate is too high → Many traders are placing Longing orders, a correction may be imminent. |
Spent Output Profit Ratio (SOPR) | Determine XEM BTC is being sold at a profit or a loss. | If SOPR < 1 → Investors are selling at a loss, which could be a buying opportunity. |
Longing-Term Holder Supply | The amount of BTC held by long-term investors. | If this amount of BTC increases → Long-term investors are accumulating, the price may rise. |
3. Glassnode
Glassnode is one of the most powerful on-chain data analytics platforms in the crypto market. It helps investors, traders, and financial institutions track and evaluate investor behavior, blockchain flows, and key metrics related to Bitcoin (BTC), Ethereum (ETH), and many other digital assets.
Glassnode collects data directly from the blockchain, processes it, and provides metrics that help users better understand supply and demand, whale behavior, market trends, and the level of asset accumulation or distribution.
Practical applications of Glassnode:
Determine XEM BTC is in an uptrend or downtrend based on historical data.
Track whales and large institutions to see whether they are accumulating or distributing.
Assess market activity through the number of active wallets.
Determine a fair price to buy/sell BTC based on profit or loss indicators.
Key metrics on Glassnode
Index | Meaning | Practical applications |
Active Addresses (Number of active wallet addresses) | Measure the number of daily active wallets on the blockchain. | If the number of active wallets increases → The market is showing significant interest, which could be a bullish signal. |
Exchange Balances (Number of BTC/ ETH on the exchange) | Total amount of BTC or ETH remaining on the exchange | If BTC leaves the exchange → Investors are accumulating, the price may rise. |
Net Unrealized Profit/Loss (NUPL) | To measure the profit or loss of investors in the market. | If too many people are making profits → A wave of profit-taking may be imminent, and prices could fall. |
Spent Output Profit Ratio (SOPR) | Assess XEM BTC is being sold at a profit or a loss. | If SOPR < 1 → Investors are selling at a loss, which could be a buying opportunity. |
Longing-Term Holder Supply (Amount of BTC held by long-term investors) | Measure the amount of BTC held in the wallet over 155 days. | If the amount of BTC held long-term increases → A sign of accumulation, the market may continue to rise. |
Exchange Inflows ( BTC/ ETH deposits into exchanges) | Total amount of BTC/ ETH deposited on the exchange | If the inflow of money into the market increases sharply → Investors may prepare to sell, and prices may fall. |
Exchange Outflows ( BTC/ ETH withdrawals from exchanges) | Total amount of BTC/ ETH withdrawn from exchanges | If the outflow of funds from the market increases → Investors are accumulating, which could be a bullish signal. |
Miner Position Index (MPI - Miners Selling Activity) | Measure the amount of BTC that Miners are selling. | If Miners sell a lot of BTC → There could be downward pressure on the price. |
Whale Ratio (Ratio of whales trading on the exchange) | Measure the amount of BTC traded by whales relative to the total Volume. | If this ratio is too high → Whales may be manipulating the price, caution is needed. |
Realized Cap (Realized Market Capital ) | Calculate the total value of BTC based on the price at which each BTC coin was purchased. | If this value increases → More BTC is being bought at a higher price, the market may be in an uptrend. |
MVRV Ratio (Market Capital to Actual Capital Ratio) | Compare the market value with the Medium purchase price of BTC. | If MVRV is too high → Investors are making large profits, a price correction may be imminent. |
HODL Waves (Amount of BTC over the holding period) | Analyzing BTC holding duration by investor group | If there is a large amount of unmoved BTC → This indicates the market is consolidating. |
ADVICE FOR BEGINNERS
For those new to the crypto market, the first step is to familiarize yourself with basic tools for tracking prices and market trends. CoinMarketCap and CoinGecko are two of the most popular platforms, helping users stay updated on price, market Capital , volume , and key indicators for each cryptocurrency. This is a foundational step to help you understand how the market operates before delving into advanced analysis.
Next, you need to learn how to use Blockchain Explorer to check transactions and track wallet addresses. Platforms like Etherscan, BscScan, and Solscan provide detailed information about each transaction on the blockchain, helping you check XEM a transaction was successful, track the wallets of large investors, and detect anomalies such as price manipulation or fraud. Understanding how these explorers work will help you avoid many unnecessary risks in crypto trading.
One of the most important advantages in crypto investing is on-chain data analysis. Tools like Glassnode and CryptoQuant help track money flows, whale behavior, and market sentiment. Understanding how whales move assets and changes in on-chain indicators can help you identify the right time to buy or exit the market. If there is a large outflow of BTC from exchanges, it could be a sign of accumulation; conversely, if the amount of BTC deposited into exchanges increases sharply, it could signal a sell-off.
In addition to on-chain data, you should also monitor investment funds and large whales to see where money is flowing. Nansen and DeBank are two powerful tools for tracking the wallets of large institutions and influential investors in the crypto market. If a whale starts accumulating a new Token , it could be a sign of an uptrend. Conversely, if large investment funds withdraw from a project, you need to XEM its sustainability.
A key principle when analyzing the market is not to rely on a single data source. Combining various analytical methods such as technical analysis (TA), on-chain on-chain , and market news will give you a more comprehensive picture. The crypto market is highly susceptible to manipulation, so relying on only one factor can lead to flawed decisions.
Furthermore, regularly updating your knowledge is essential. The cryptocurrency market is rapidly changing, with many new trends constantly emerging. Platforms like Messari and defillama provide in-depth market reports and analyses, helping you stay abreast of new trends and avoid being left behind. Reading these reports will give you a better understanding of the overall market landscape, leading to more informed investment decisions.
Finally, always be wary of scam projects. Before investing in any project, check the smart contract on Etherscan, analyze the tokenomics, and evaluate the project's community through LunarCrush or Santiment. Projects showing signs of Rug Pull , opaque Token distribution mechanisms, or manipulation by a small group of large investors are red flags that you should avoid. Checking the Token 's transaction history and community engagement on Capital media is also a good way to assess the sustainability of a project.
By combining these analytical tools, you will have a more solid investment strategy, avoid common pitfalls, and optimize profits in the volatile crypto market.


