

XRP is one of the large- Capital Token that has performed poorly this week. The price of XRP has fallen by approximately 6% over the past seven days, putting pressure on short-term retail investor sentiment.
However, the recent correction may not be the end. According to charts and on-chain data, XRP is at a critical juncture where the next trend will depend on whether the Token repeats the pattern that appeared four months ago.
The price chart shows a familiar pattern.
On the daily chart, XRP is forming an inverse Vai and Vai pattern. This pattern typically signals a potential uptrend reversal, but only if key price levels are reclaimed. Currently, the neckline of the pattern is near the $2.52 mark, which is almost 28% higher than the current price.
To open up this recovery path, XRP must first reclaim the 100-day exponential moving Medium (100-day EMA) – the light blue line on the chart. The EMA reflects nearby price with added weight, so it usually reacts faster to volatility than a simple moving Medium . In the past, the 100-day EMA area has repeatedly Vai as a key juncture determining the direction of XRP price. In September 2023, when the price reclaimed the 100-day EMA, it led to a surge of approximately 12%. In the same month, another breakout above the 100-day EMA helped the price jump another 16%.
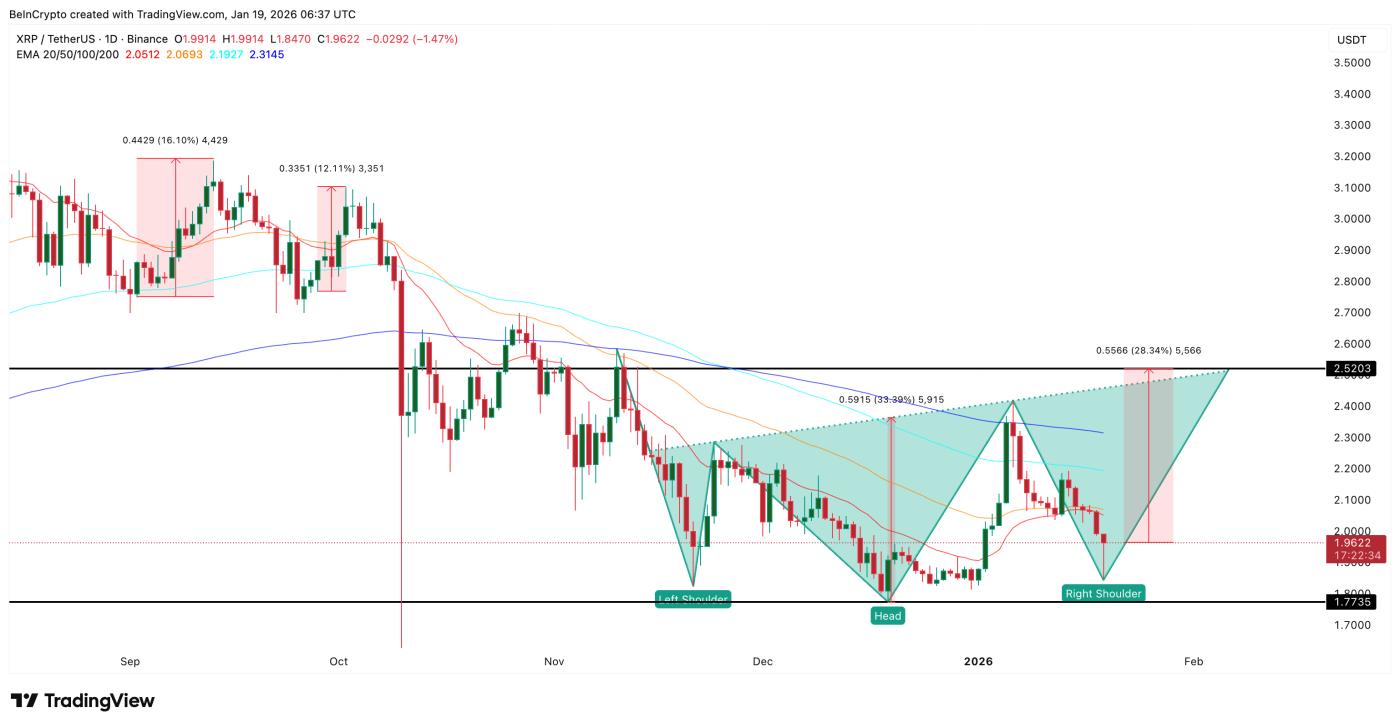 XRP's bullish pattern: TradingView
Want more Token analysis updates like this? Sign up for the daily Crypto Newsletter by Editor Harsh Notariya here .
To date, XRP has failed to hold above the short-term EMAs (20-day and 50-day EMA) and continues to be rejected at the 100-day EMA on January 14, 2024. However, this sell-off resulted in a very long lower wick, indicating that buying pressure emerged during the sharp price drop. This means that buying demand remains, helping to maintain the bullish pattern, provided that XRP can reclaim the 100-day EMA in the near future.
Whales and holder are in position early, but simply buying spot may not be enough.
on-chain data reveals a significant inflow of funds behind the scenes. Whales holding between 10 million and 100 million XRP have increased their wallet balances from approximately 11.14 billion to 11.17 billion XRP, equivalent to about $60 million at current prices.
Smaller whales, holding between 1 million and 10 million XRP, were even more active buyers. Their Token balances increased from 3.54 billion to 3.59 billion XRP, nearly $100 million. This buying activity began around January 14, 2024, before many long-term investors started accumulating. Although they sold off a small amount of Token on January 15, 2024, when the XRP price began to correct, the overall accumulation since January 14, 2024, remains positive.
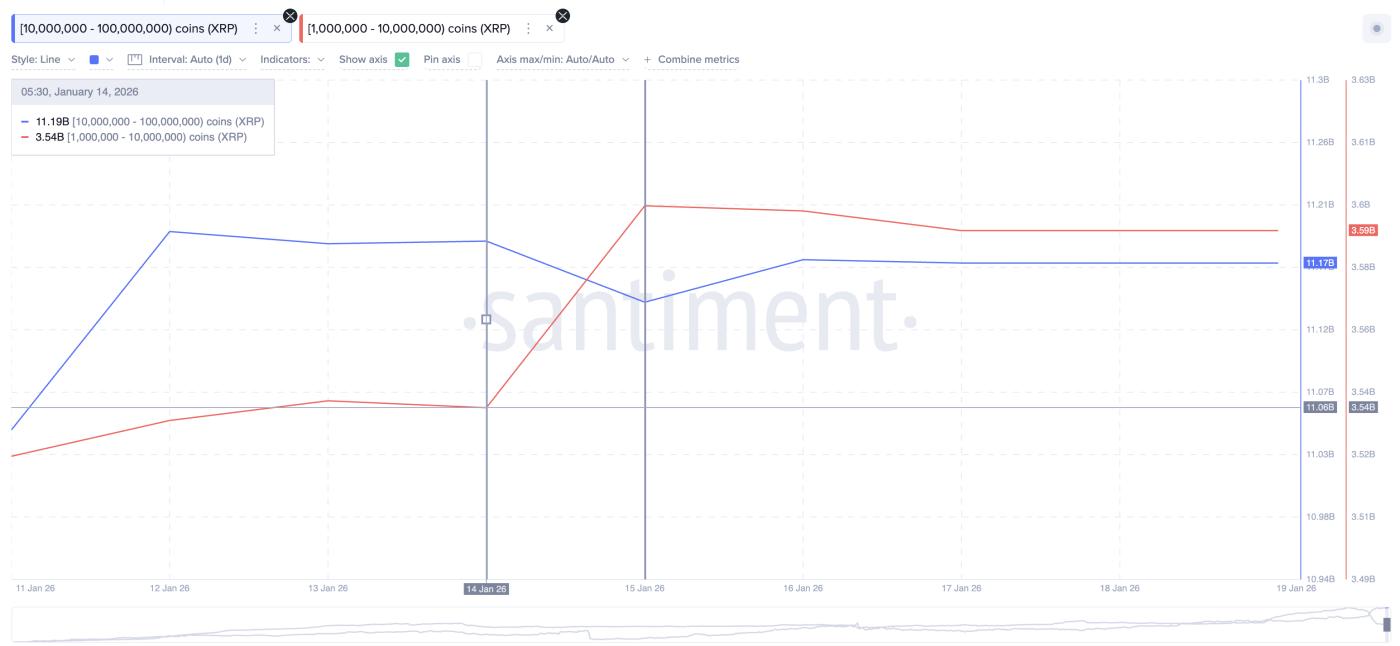 XRP whale money flow: Santiment
Following the whales, long-term investors also joined the accumulation. From January 16, 2024, the net volatility of long-term holder shifted to a clear upward trend. This index tracks wallets holding XRP for approximately 155 days or more, reflecting long-term confidence rather than just short-term trading.
On January 16, 2024, this group held nearly 223,201,195 XRP. By January 18, 2024, the total had increased to approximately 234,886,841 XRP – an increase of about 11.69 million XRP, representing a 5.2% rise in just two days.
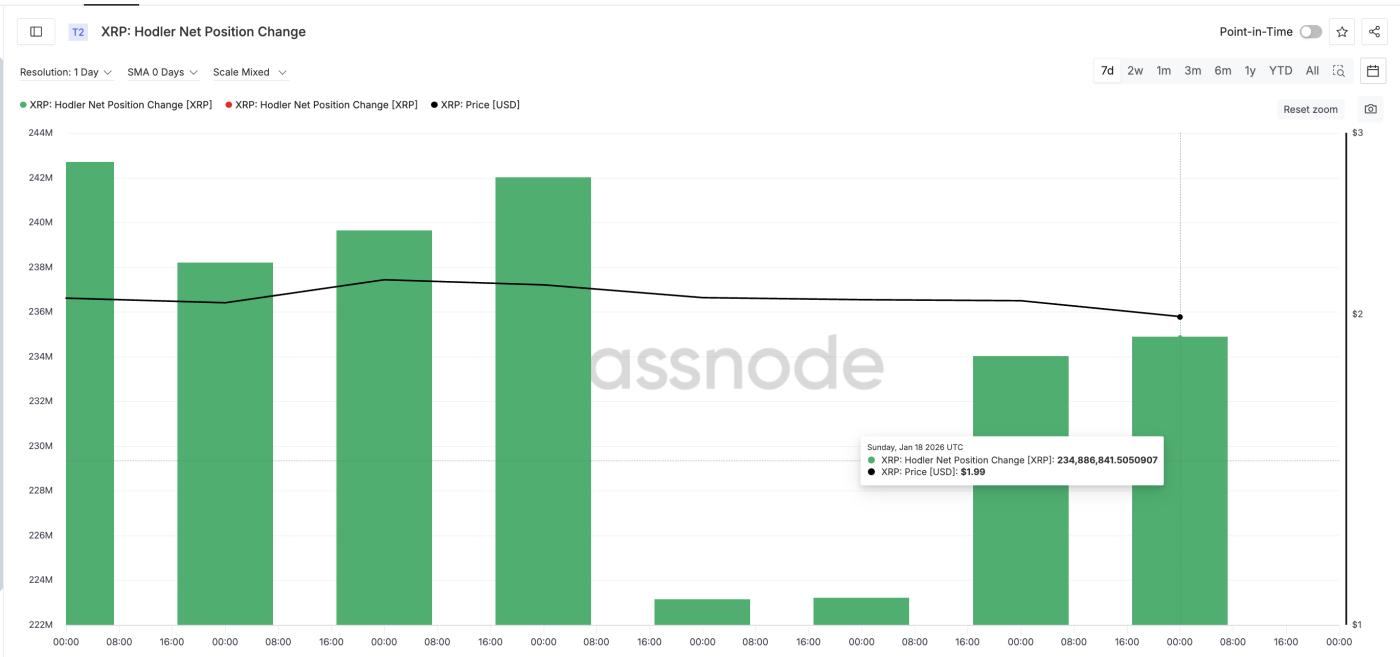 Long-term holder are increasing their holdings: Glassnode
The timing of the accumulation is also quite noteworthy. Whales had been accumulating early on when XRP corrected, while long-term holder only started buying after January 16, 2024. This indicates deliberate buying activity, not emotional buying driven by price dips.
The Derivative spread creates the momentum, while the XRP price determines the outcome.
The Derivative market presents a noteworthy factor. On XRP perpetual Derivative exchanges , the leverage for liquidating Short positions is nearly $520 million, while Longing positions are only around $22 million. This means the market is skewed towards Short positions by more than 95%.
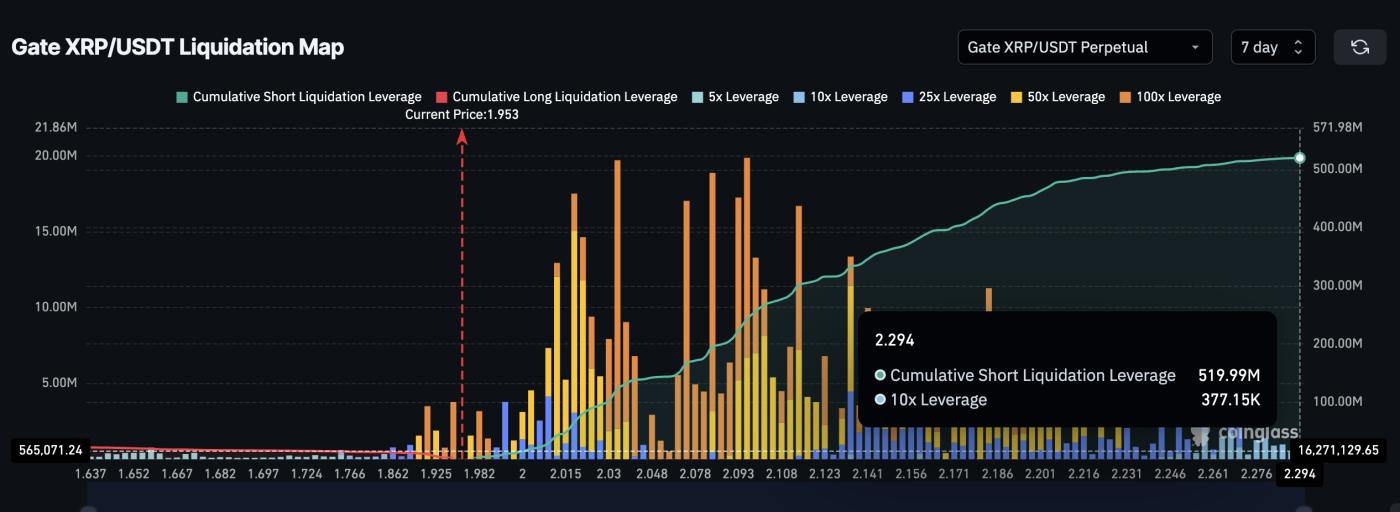 XRP Liquidation Map : Coinglass
This imbalance will act as a "trigger" when prices rise slightly, potentially squeezing Short sellers and intensifying buying pressure if prices break through key resistance levels.
The support and resistance levels are very clear. XRP needs to close above $2.24 to confirm the uptrend and reclaim the 100-day EMA. If this happens, XRP could move into the $2.48–$2.52 price range and trigger a bullish pattern. At that point, XRP could potentially retrace its initial 33% uptrend.
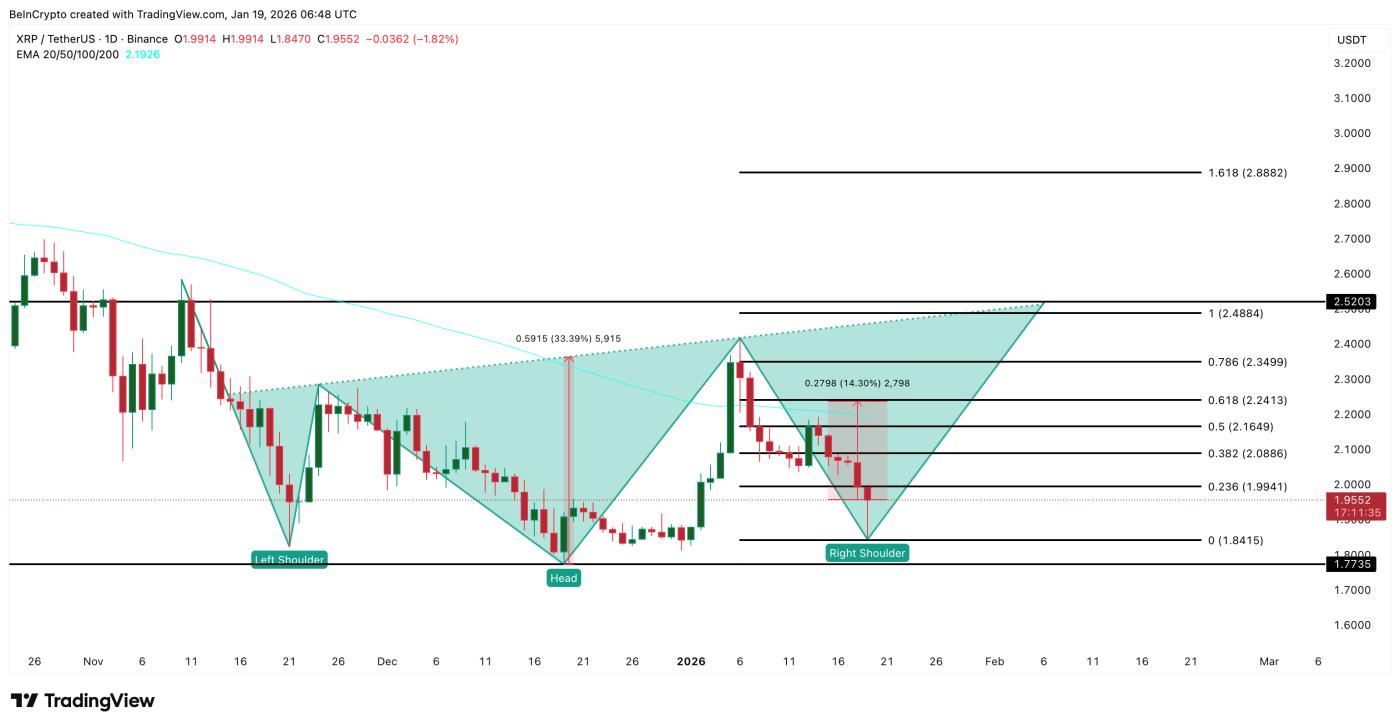 XRP Price Analysis: TradingView
Conversely, if XRP falls below $1.84, the uptrend will weaken, and if it drops below $1.77, this recovery will be completely invalidated. Currently, XRP shows no signs of a breakout. However, if it can replicate the strong rally seen in September 2023, the uptrend could restart.


