In financial market analysis and trading, the biggest mistake is to focus only on short-term, superficial statistical similarities while ignoring long-term, macroeconomic, and fundamental driving factors.
Written by: Garrett
Compiled by: Saoirse, Foresight News
Recently, some analysts have been comparing the current price movement of Bitcoin with its movement in 2022.
Admittedly, their short-term price movements may appear somewhat similar. However, from a long-term perspective, such a comparison is utterly absurd.
Whether from the perspective of long-term price patterns, macroeconomic background, or investor composition and supply/demand/holding structure, the underlying logics of the two are fundamentally different.
In financial market analysis and trading, the biggest mistake is to focus only on short-term, superficial statistical similarities while ignoring long-term, macroeconomic, and fundamental driving factors.
Completely opposite macroeconomic background
In March 2022, the United States was mired in high inflation and an interest rate hike cycle, driven by factors including:
- Excess liquidity during the COVID-19 pandemic;
- The chain reaction triggered by the Ukraine crisis has further and significantly pushed up inflation.
At that time, risk-free interest rates continued to rise, liquidity was systematically withdrawn, and the financial environment continued to tighten.
In such an environment, the primary goal of capital is to avoid risk. The Bitcoin price movement we are seeing is essentially a high-level distribution pattern within a tightening cycle.
The current macroeconomic environment is quite the opposite:
- The situation in the conflict in Ukraine continues to ease (partly due to US efforts to reduce inflation and lower interest rates);
- Both the Consumer Price Index (CPI) and the US risk-free interest rate are trending downward.
- More importantly, the technological revolution in artificial intelligence has significantly increased the likelihood of the economy entering a prolonged deflationary cycle. Therefore, from a longer-term perspective, interest rates have already entered a phase of decline.
- Central banks around the world are injecting liquidity back into the financial system;
- This means that capital is currently exhibiting a "risk-averse" characteristic.
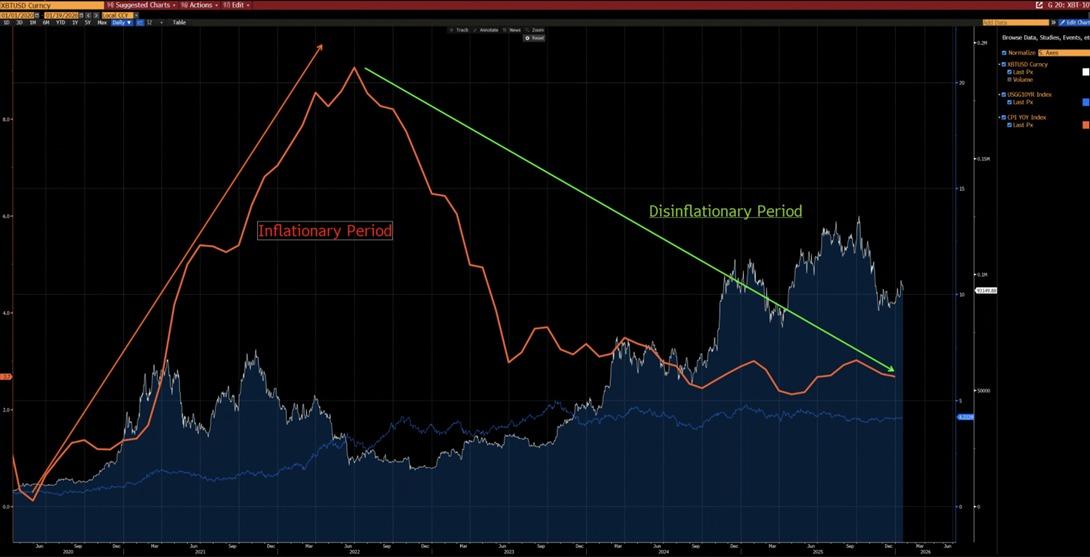
As can be seen from the chart below, since 2020, Bitcoin and the year-on-year change in CPI have shown a clear negative correlation—Bitcoin tends to fall during periods of rising inflation, while it tends to rise during periods of slowing inflation.
Against the backdrop of a technological revolution driven by artificial intelligence, prolonged deflation is highly probable—a view shared by Elon Musk, which further confirms our argument.
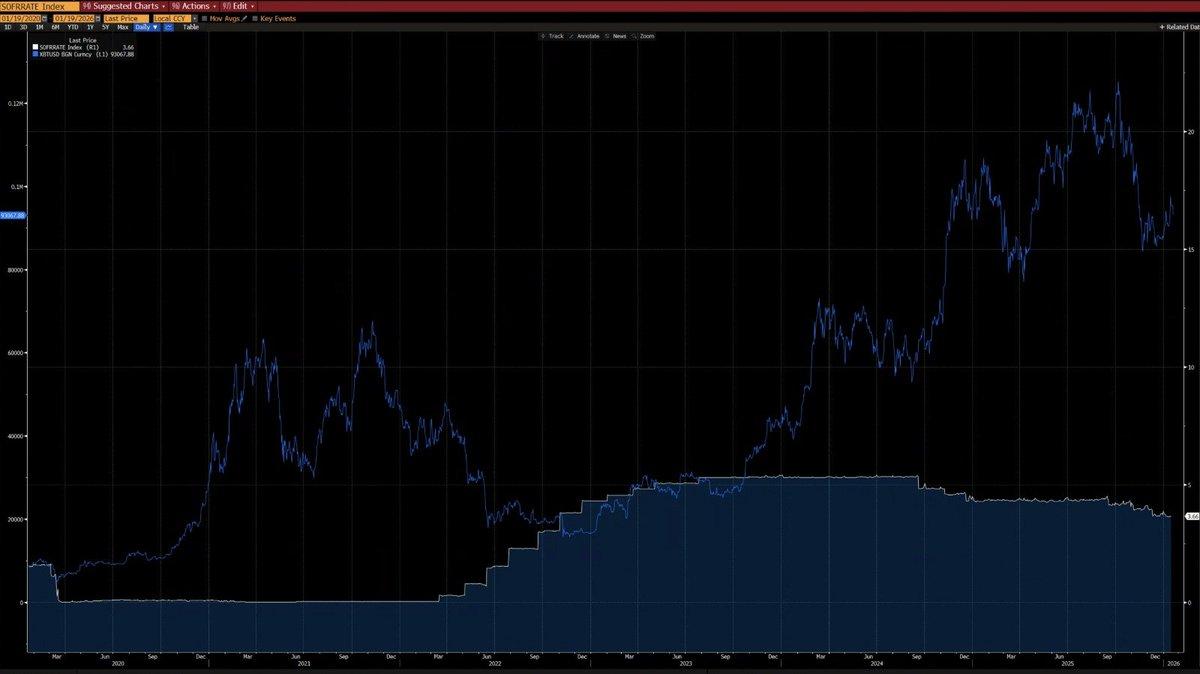
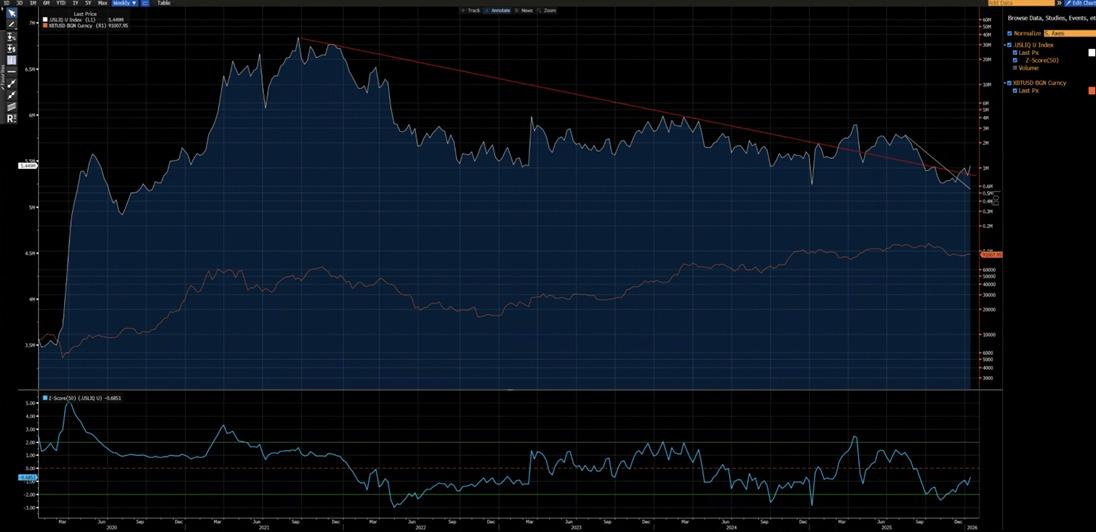
Another chart below shows that since 2020, Bitcoin has shown a very strong correlation with the US liquidity index (excluding the data deviation in 2024 due to ETF inflows). Currently, the US liquidity index has broken through the short-term (white line) and long-term (red line) downward trend lines—a new upward trend is emerging.
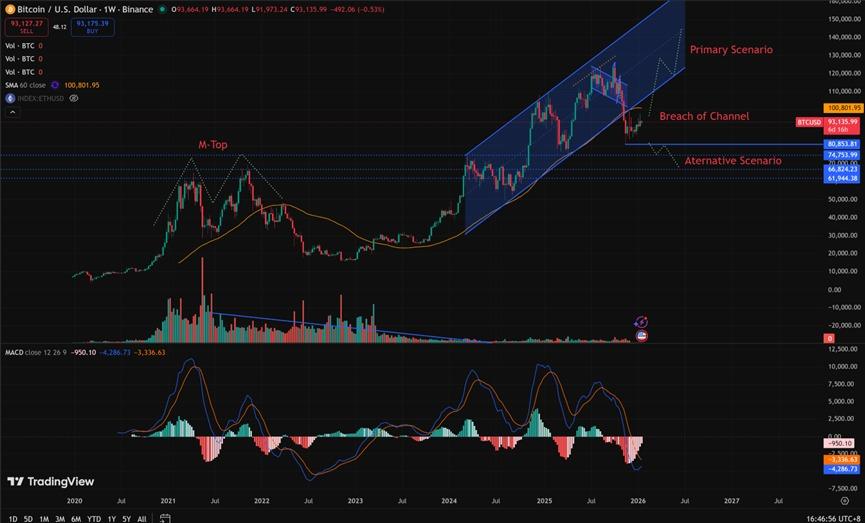
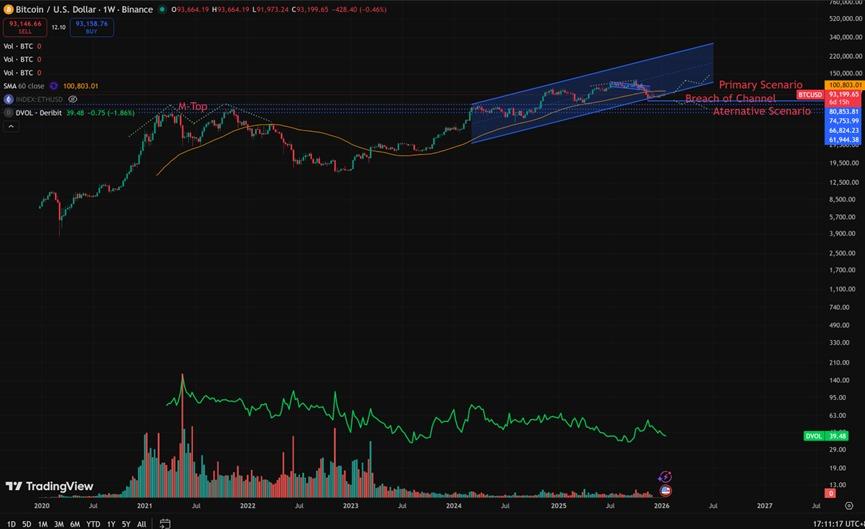
Completely different technical structures
- 2021-2022: The weekly chart shows an "M-top" structure. This type of pattern is usually associated with the top of a long-term market and will suppress price movements for a considerable period of time.
- 2025 (influencing the trend at the beginning of 2026): The weekly chart shows a break below the upward channel. From a probability perspective, this is more likely a "bear trap" before a rebound back into the channel.
Of course, we cannot completely rule out the possibility that the current trend will evolve into a continuation of the 2022-style bear market. However, it must be noted that the $80,850-$62,000 range has experienced large-scale consolidation and exchange of shares.
This initial accumulation phase provides a far superior risk-reward ratio for bullish positions—the upside potential significantly outweighs the downside risk.
What conditions would be needed for a repeat of the 2022-style bear market?
For a bear market like that of 2022 to recur, the following stringent conditions must be met:
- A new round of inflationary shocks or a major geopolitical crisis of similar scale to that of 2022 may occur.
- Central banks around the world are restarting interest rate hikes or quantitative tightening (QT) policies on their balance sheets;
- Bitcoin prices experienced a decisive and sustained drop below the $80,850 mark.
Before all these conditions are met, it is premature to declare that the market has entered a structural bear market, and such a statement is a speculative judgment rather than a conclusion based on rational analysis.
Significantly Different Investor Structures
- 2020-2022: The market was dominated by retail investors with limited institutional participation, especially long-term allocation institutions.
- Since 2023: The introduction of Bitcoin ETFs has introduced "structured long-term holders", effectively locking up a portion of the Bitcoin supply, significantly reducing trading activity, and significantly lowering volatility.
2023 marked a structural turning point for Bitcoin as an asset, both from a macroeconomic and quantitative perspective.
Bitcoin's volatility range has also undergone a fundamental shift:
- Historical volatility: 80%-150%
- Current volatility: 30%-60%
This change signifies a fundamental shift in Bitcoin's asset attributes.
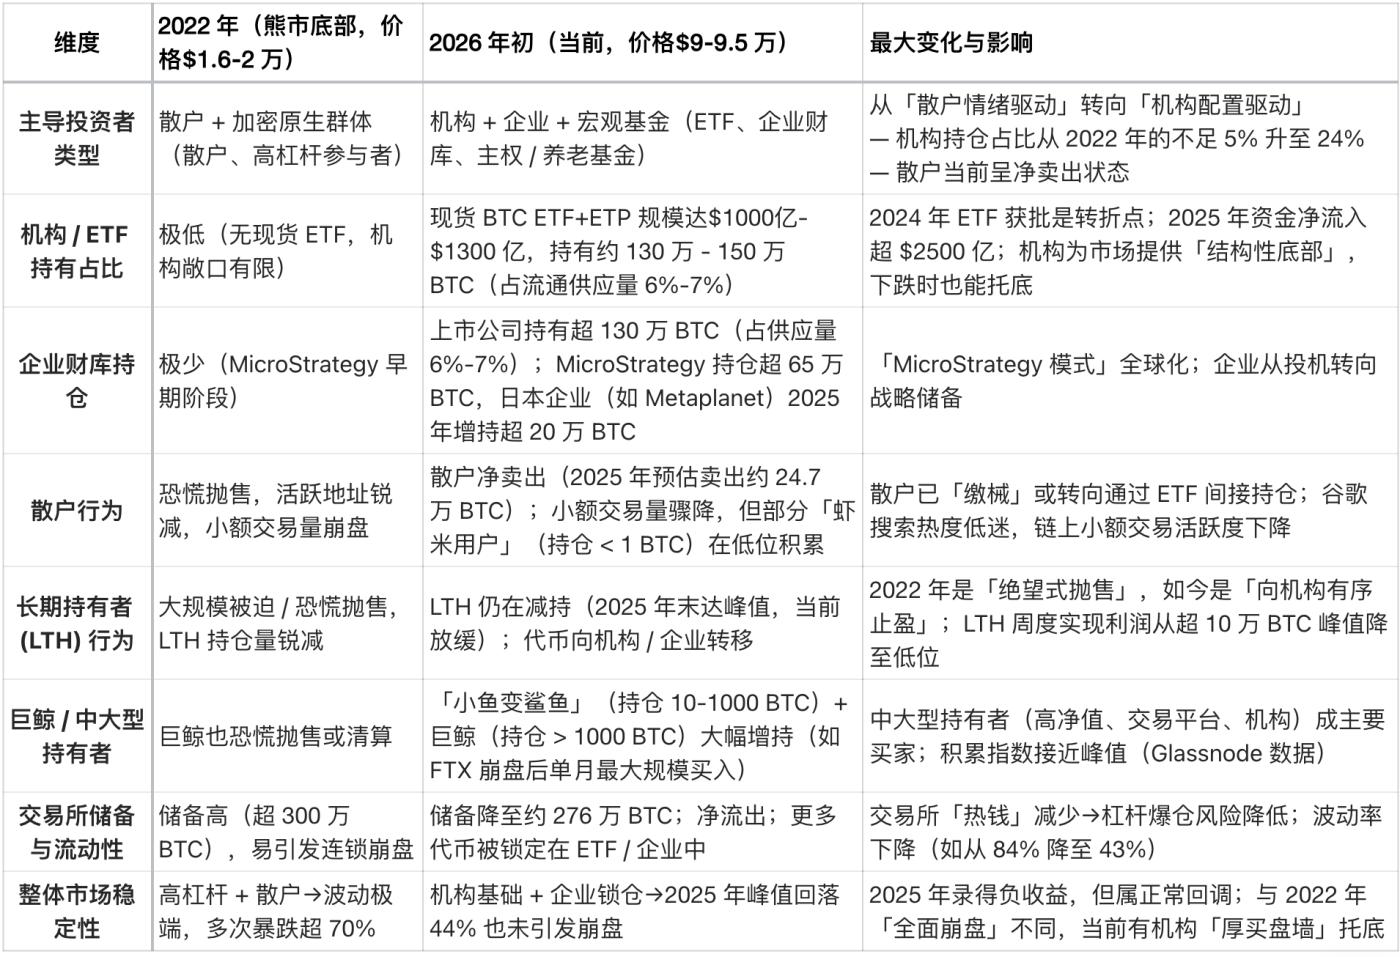
Core structural differences (current vs. 2022)
The biggest difference in the structure of Bitcoin investors in early 2026 compared to 2022 is that the market has shifted from "retail-driven, high-leverage speculation" to "institution-driven, structurally long-term holding".
In 2022, Bitcoin experienced a typical "crypto-native bear market," triggered by panic selling by retail investors and a chain of leveraged liquidations.
Today, Bitcoin has entered a much more mature "institutional era," characterized by:
- Stable underlying requirements
- Some supplies were locked up for a long time.
- Volatility reaches institutional level
The following is a key comparison by Grok based on on-chain data (such as Glassnode and Chainalysis) and institutional reports (such as Grayscale Investments, Bitwise, and State Street Bank) from mid-January 2026 (when Bitcoin's price was in the $90,000-$95,000 range):