In her latest 2026 New Year's letter to investors, ARK Invest founder Cathie Cathie Wood released a macroeconomic outlook, comparing the next three years to "Reaganomics on steroids."
She pointed out that with the integration of deregulation, tax cuts, sound monetary policy, and innovative technologies, the US stock market will usher in another "golden age," while the upcoming surge in the dollar may bring an end to the upward trend in gold prices.
Specifically, Cathie Wood believes that although real GDP has continued to grow over the past three years, the US economy has actually experienced a rolling recession and is currently in a "coiled spring" state, with the potential for a strong rebound in the coming years.
She emphasized that with David Sacks becoming the first AI and cryptocurrency czar to lead deregulation and the effective corporate tax rate moving toward 10%, the US economy will receive a huge policy dividend.
At the macro level, Wood predicts that inflation will be further brought under control, and may even turn negative, driven by a productivity boom.
She predicts that the US nominal GDP growth rate will remain in the range of 6% to 8% over the next few years, driven primarily by productivity gains rather than inflation.
In terms of market impact, Wood predicts that the relative advantage of US investment returns will drive the dollar exchange rate significantly higher, repeating the near doubling of the dollar's value in the 1980s.
She warned that despite the significant rise in gold prices over the past few years, the strengthening dollar will suppress gold prices, while Bitcoin, due to its supply mechanism and low asset correlation, will exhibit a different trend than gold.
Regarding the market valuation issue that investors are concerned about, Wood does not believe that an AI bubble has formed.
She pointed out that although the current price-to-earnings ratio is at a historical high, as technologies such as AI and robotics drive productivity growth, corporate profit growth will digest the high valuations, and the market may achieve positive returns while the price-to-earnings ratio is compressed, similar to the bull market path in the mid-to-late 1990s.
The following is the original text of the letter to investors:
Happy New Year to ARK's investors and other supporters! We are very grateful for your support.
As I explained in this letter, we truly believe that investors have many reasons to remain optimistic! Hopefully, you enjoy our discussion. From an economic history perspective, we are at a crucial juncture.
A spring poised to burst forth
Despite the continued growth of U.S. real GDP over the past three years, the underlying structure of the U.S. economy has experienced a rolling recession and is gradually evolving into a spring that has been compressed to its limit, which may rebound strongly in the coming years.
In response to the supply shocks related to the COVID-19 pandemic, the Federal Reserve raised the federal funds rate sharply from 0.25% in March 2022 to 5.5% in the 16 months ending in July 2023, a record increase of 22 times.
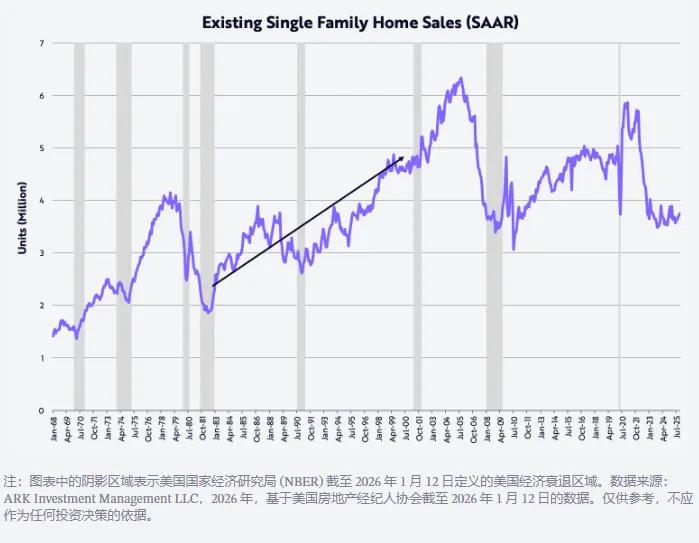
This interest rate hike pushed housing, manufacturing, non-AI-related capital spending, and low- and middle-income groups in the United States into recession, as shown in the figure below.
Measured by existing home sales, the housing market fell 40% from an annualized rate of 5.9 million units in January 2021 to 3.5 million units in October 2023.
This level was last seen in November 2010, and existing home sales have fluctuated around this level over the past two years.
This shows how tightly the spring is compressed: current levels of existing home sales are comparable to those in the early 1980s, when the U.S. population was about 35% smaller than it is now.
According to the U.S. Purchasing Managers' Index (PMI), the manufacturing sector has been in contraction for approximately three consecutive years. Based on this diffusion index, 50 is the dividing line between expansion and contraction, as shown in the figure below.
![]()
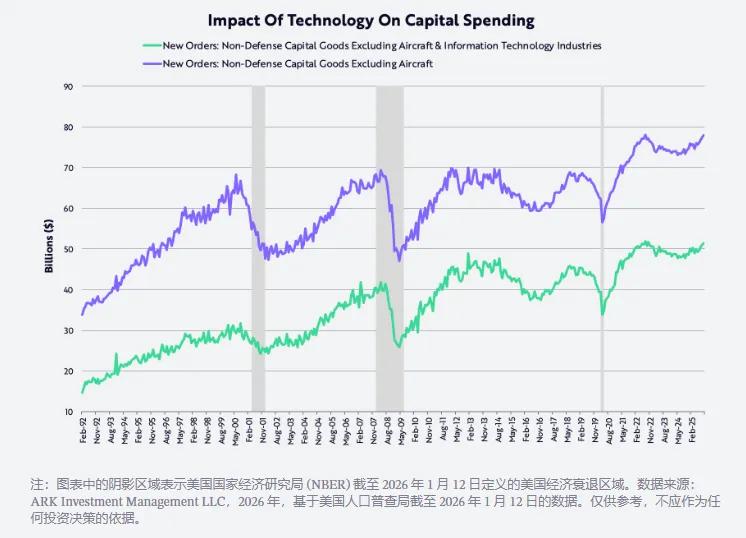
Meanwhile, capital expenditures, measured by non-defense capital goods (excluding aircraft), peaked in mid-2022 and have since returned to that level, regardless of technological influences.
In fact, this capital expenditure metric had struggled for more than 20 years since the bursting of the tech and telecommunications bubble, until 2021 when the COVID-19-related supply shock forced both digital and physical investments to accelerate.
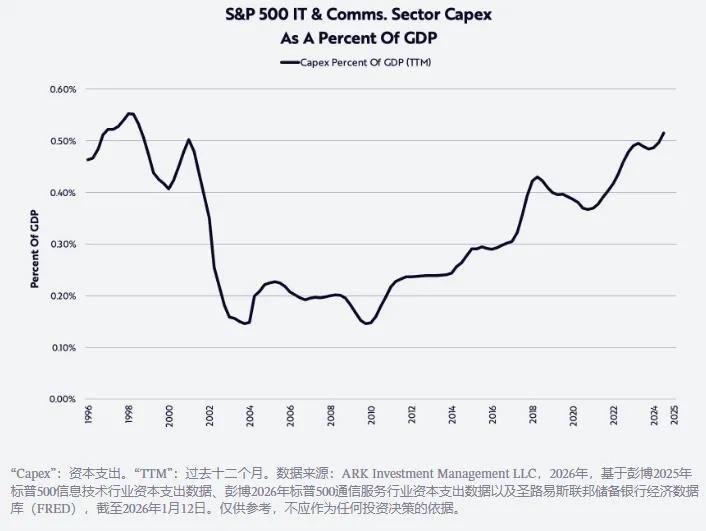
The previous spending ceiling seems to have turned into a spending floor, as artificial intelligence, robotics, energy storage, blockchain technology, and multi-omics sequencing platforms are ready to usher in a golden age.
Following the tech and telecom bubble of the 1990s, a peak in spending of approximately $70 billion lasted for 20 years. Now, as the chart below illustrates, this may be the strongest capital expenditure cycle in history. We believe that an artificial intelligence bubble is still a long way off!
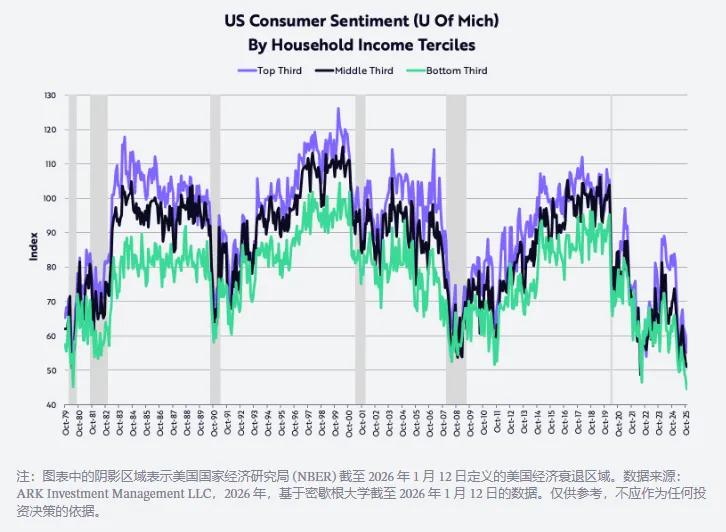
Meanwhile, data from the University of Michigan shows that confidence among low- and middle-income groups has fallen to its lowest point since the early 1980s.
At the time, double-digit inflation and high interest rates severely weakened purchasing power and plunged the U.S. economy into a prolonged recession.
Furthermore, as shown in the chart below, consumer confidence has also declined in recent months. In our view, consumer confidence is one of the most tightly compressed "springs" with the greatest potential for rebound.
Deregulation, while lowering taxes, inflation, and interest rates.
Thanks to a combination of factors, including deregulation, tax cuts (including tariffs), inflation, and interest rates, the rolling recession that the United States has experienced in recent years may reverse rapidly and dramatically in the coming year and beyond.
Deregulation is unleashing innovation across various sectors, particularly in artificial intelligence and digital assets, spearheaded by David Sacks, the first “AI and cryptocurrency czar.”
At the same time, reductions in tips, overtime pay, and Social Security taxes will provide substantial tax refunds to U.S. consumers this quarter, potentially pushing the annualized growth rate of real disposable income up from about 2% in the second half of 2025 to about 8.3% this quarter.
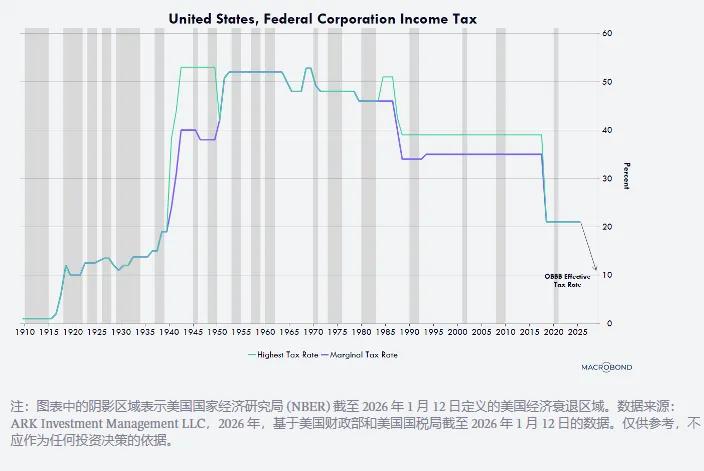
Furthermore, with accelerated depreciation of manufacturing facilities, equipment, software, and domestic R&D expenditures, the effective tax rate for businesses will be reduced to close to 10% (as shown in the figure below), and corporate tax refunds are expected to increase significantly, while 10% is one of the lowest tax rates in the world.
For example, any company that starts construction on a manufacturing plant in the United States before the end of 2028 can depreciate the entire value of the building in the first year it is put into use, instead of depreciating it over 30 to 40 years as in the past.
Equipment, software, and domestic R&D expenditures can also be depreciated at 100% in the first year. This cash flow incentive was permanently established in last year's budget and is retroactive to January 1, 2025.
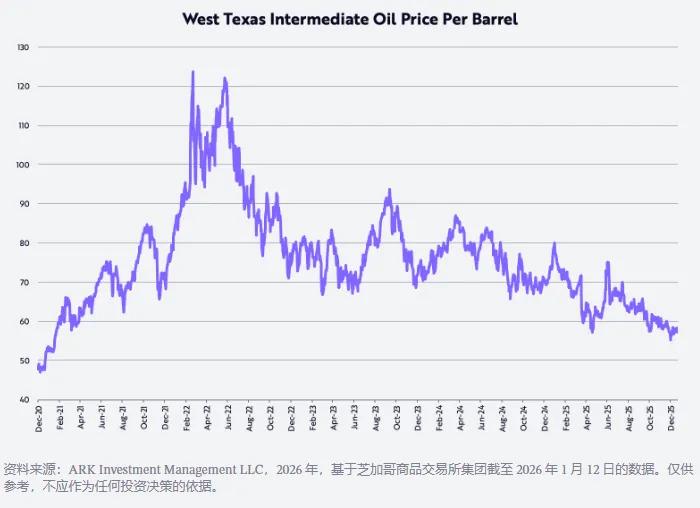
For the past few years, inflation, as measured by the Consumer Price Index (CPI), has stubbornly hovered in the 2% to 3% range, but in the coming years, for several reasons as shown in the chart below, the inflation rate is likely to fall to a surprisingly low level—or even negative.
First, West Texas Intermediate (WTI) crude oil prices have fallen by about 53% since their post-COVID-19 high of around $124 per barrel on March 8, 2022, and are currently down about 22% year-over-year.
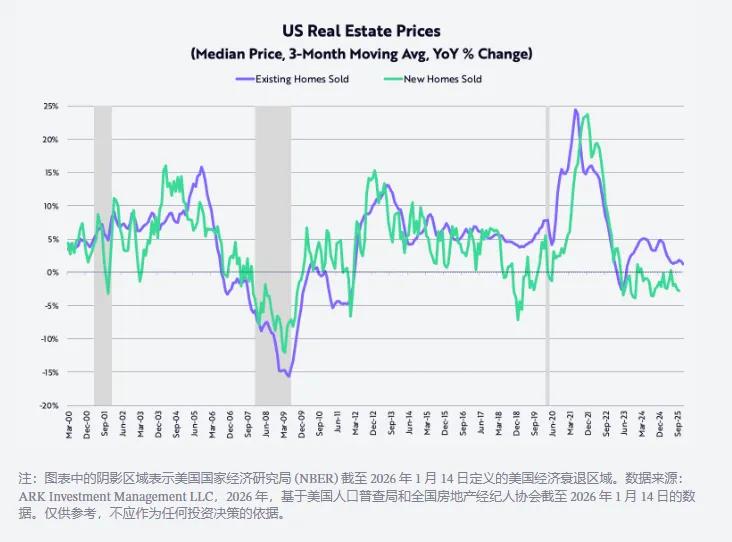
Since peaking in October 2022, the sales price of newly built detached homes has fallen by about 15%; meanwhile, the inflation rate of existing detached home prices—based on a three-month moving average—has fallen to about 1.3% year-over-year from a peak of about 24% in June 2021, after the COVID-19 pandemic, as shown in the chart below.
In the fourth quarter, in order to digest nearly 500,000 new single-family homes in inventory (as shown in the chart below, the highest level since the eve of the global financial crisis in October 2007), the three major homebuilders significantly lowered their prices, with year-on-year declines of -10% for Lennar, -7% for KBHomes, and -3% for DRHorton.
The effects of these price declines will be reflected in the Consumer Price Index (CPI) with a lag over the next few years.
![]()
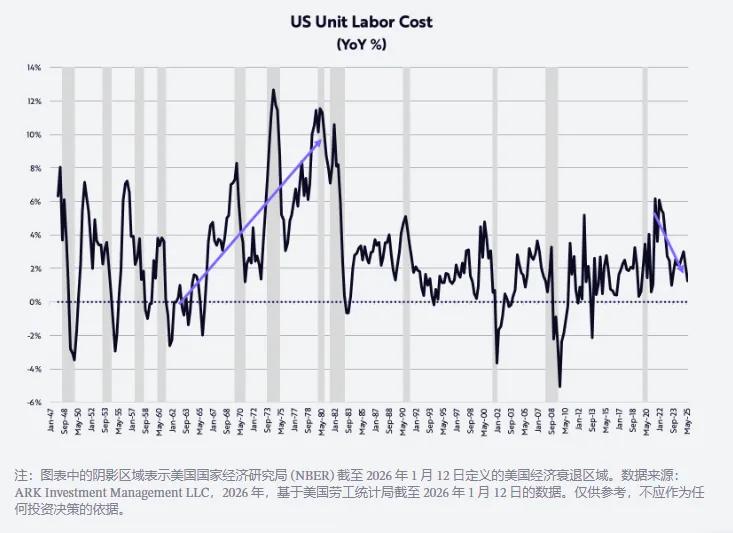
Finally, nonfarm productivity, one of the most powerful forces at curbing inflation, bucked the trend and grew by 1.9% year-on-year in the third quarter, amid a continued recession.
In stark contrast to the 3.2% increase in hourly wages, productivity gains have reduced unit labor cost inflation to 1.2%, as shown below. This figure does not reflect the cost-push inflation seen in the 1970s!
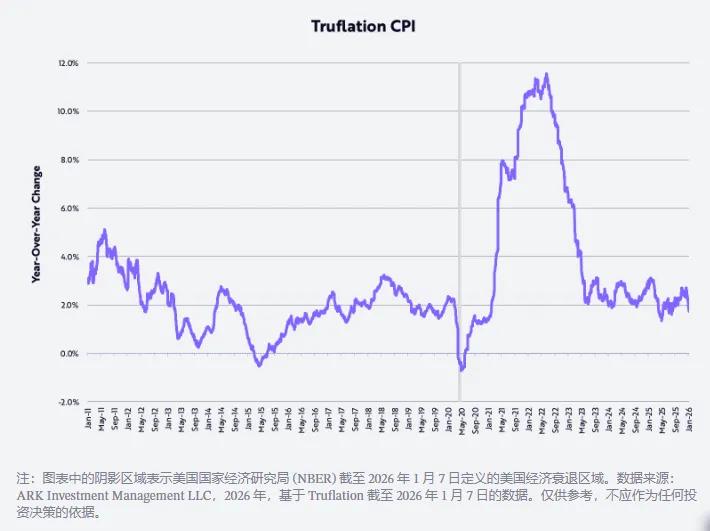
This improvement has also been validated: the inflation rate, as measured by Truflation, has recently fallen to 1.7% year-over-year, as shown in the chart below, which is nearly 100 basis points (bps) lower than the inflation rate calculated by the U.S. Bureau of Labor Statistics (BLS) based on the CPI.
Productivity boom
In fact, if our research on technology-driven disruptive innovation is correct, then in the next few years, influenced by cyclical and long-term factors, the growth rate of non-agricultural productivity should accelerate to 4-6% per year, thereby further reducing inflation per unit of labor cost.
The convergence of major innovation platforms currently under development—artificial intelligence, robotics, energy storage, public blockchain technology, and multi-omics technology—is expected not only to drive productivity growth to new sustainable highs but also to create enormous wealth.
Increased productivity could also correct significant geoeconomic imbalances in the global economy.
Companies can channel the benefits of increased productivity into one or more of the following four strategic directions: expanding profit margins, increasing R&D and other investments, raising compensation and/or lowering prices.
In China, increasing the wages of more productive employees and/or improving profit margins can help the economy overcome the structural problem of overinvestment.
Since joining the World Trade Organization (WTO) in 2001, China's investment as a percentage of GDP has averaged approximately 40%, almost twice that of the United States, as shown in the chart below. Raising wages will drive China's economy towards a consumption-driven transformation, moving away from a commoditized path.
![]()
However, in the short term, technology-driven productivity gains may continue to slow U.S. job growth, causing the unemployment rate to rise from 4.4% to over 5.0%, and prompting the Federal Reserve to continue cutting interest rates.
Subsequently, deregulation and other fiscal stimulus measures should amplify the effects of low interest rates and accelerate GDP growth in the second half of 2026.
At the same time, inflation is likely to continue to slow, not only due to lower oil prices, housing prices and tariffs, but also thanks to technological advancements that drive productivity growth and lower unit labor costs.
Surprisingly, the cost of AI training is decreasing by 75% annually, while the cost of AI inference (i.e., the cost of running AI application models) is decreasing by as much as 99% annually (according to some benchmark data).
The unprecedented decline in the cost of various technologies should drive a surge in their unit growth.
Therefore, we expect the US nominal GDP growth rate to remain in the range of 6% to 8% over the next few years, mainly due to productivity growth of 5% to 7%, labor force growth of 1%, and inflation rate of -2% to +1%.
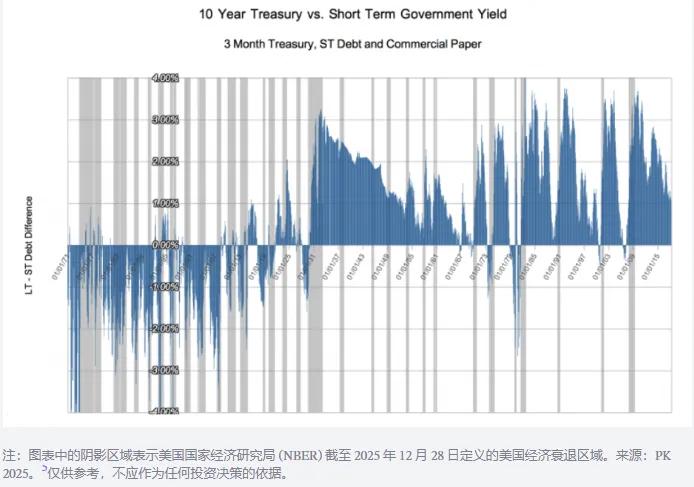
The deflationary effects of artificial intelligence and the other four major innovation platforms will continue to accumulate and shape an economic environment similar to that of the last major technological revolution, which lasted for 50 years up to 1929 and was triggered by the internal combustion engine, electricity, and telephone.
During that period, short-term interest rates moved in tandem with nominal GDP growth, while long-term interest rates responded to the deflationary undercurrents accompanying the technological boom, causing the yield curve to invert by an average of about 100 basis points, as shown in the figure below.
Other New Year Reflections
Gold prices rise while Bitcoin prices fall
During 2025, the price of gold rose by 65%, while the price of Bitcoin fell by 6%.
Many observers attribute the surge in gold prices from $1,600 to $4,300 per ounce—a 166% increase—since the end of the U.S. stock market bear market in October 2022, to inflation risks.
However, another explanation is that global wealth growth (as evidenced by the 93% increase in the MSCI World Equity Index) has outpaced the approximately 1.8% annualized growth rate of global gold supply.
In other words, the increase in gold demand may have outpaced the growth in its supply. Interestingly, during the same period, the price of Bitcoin rose by 360%, while its annualized supply growth rate was only about 1.3%.
It's worth noting that gold and Bitcoin miners may react very differently to these price signals: gold miners will respond by increasing gold production, while Bitcoin miners cannot.
According to mathematical calculations, Bitcoin will grow at an annual rate of approximately 0.82% over the next two years, after which its growth rate will slow to approximately 0.41% per year.
Looking at gold prices from a long-term perspective
Measured by the ratio of market capitalization to M2 money supply, the price of gold has only exceeded this level once in the past 125 years: during the Great Depression in the early 1930s. At that time, the price of gold was fixed at $20.67 per ounce, while the M2 money supply plummeted by about 30% (as shown in the chart below).
Recently, the ratio of gold to M2 has surpassed its previous peak, which occurred in 1980 when inflation and interest rates soared to double digits. In other words, from a historical perspective, gold prices have reached extremely high levels.
The chart below also shows that the long-term decline in this ratio is closely related to the robust returns of the stock market. According to research by Ibbotson and Sinquefield, the compound annual return of stocks has been approximately 10% since 1926.
After the ratio reached two major long-term peaks in 1934 and 1980, stock prices as measured by the Dow Jones Industrial Average (DJIA) achieved returns of 670% and 1015% over 35 years and 21 years, respectively, through 1969 and 2001, which translates to annualized returns of 6% and 12%, respectively.
It is worth noting that the annualized returns for small-cap stocks were 12% and 13%, respectively.
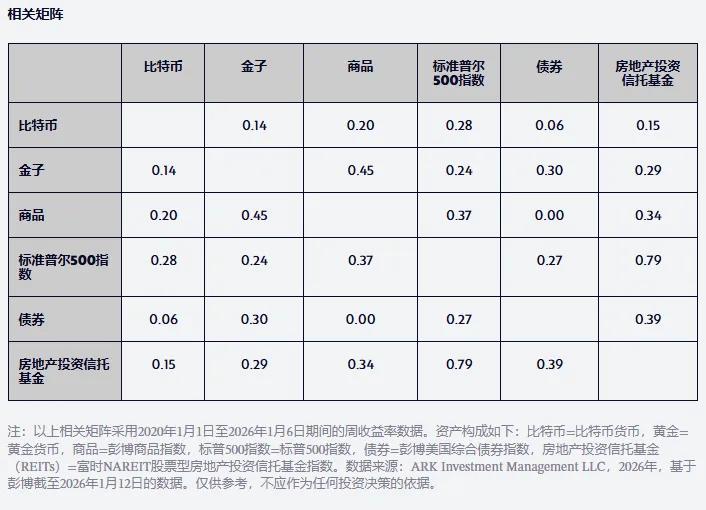
For asset allocators, another important consideration is the low correlation between Bitcoin's returns and those of gold, as well as its returns with other major asset classes since 2020, as shown in the table below.
It's worth noting that Bitcoin's correlation with gold is even lower than the correlation between the S&P 500 and bonds. In other words, for asset allocators seeking higher risk-reward returns in the coming years, Bitcoin should be a good diversification option.
US Dollar Outlook
In recent years, a popular narrative has been that American exceptionalism has come to an end, with the dollar experiencing its biggest drop in the first half of the year since 1973 and its biggest drop for the year since 2017.
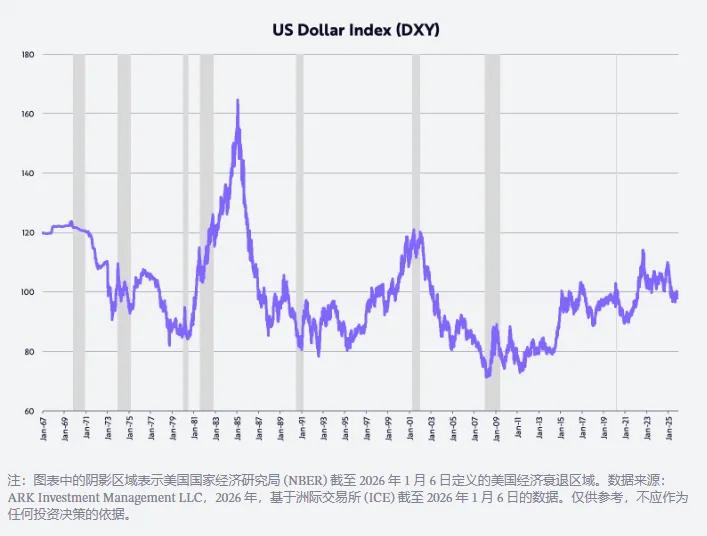
Last year, the dollar fell 11% in the first half of the year and 9% for the whole year, as measured by the trade-weighted dollar index (DXY). If our predictions regarding fiscal policy, monetary policy, deregulation, and U.S.-led technological breakthroughs are correct, then the U.S. rate of return on investment will be higher relative to the rest of the world, thus pushing up the dollar's exchange rate.
The Trump administration's policies mirrored those of the Reagan era in the early 1980s, when the dollar's exchange rate nearly doubled, as shown in the chart below.
Artificial intelligence hype
As shown below, the booming development of artificial intelligence is driving capital expenditures to their highest level since the late 1990s.
In 2025, investment in data center systems (including computing, networking, and storage devices) grew by 47% to nearly $500 billion, and is projected to grow by another 20% to approximately $600 billion in 2026, far exceeding the long-term trend of $150 billion to $200 billion annually in the decade before the launch of ChatGPT.
Such a massive investment inevitably raises the question: "What will be the return on this investment, and where will it be realized?"
In addition to semiconductor companies and large publicly traded cloud companies, unlisted AI-native companies are also benefiting from growth and returns on investment.
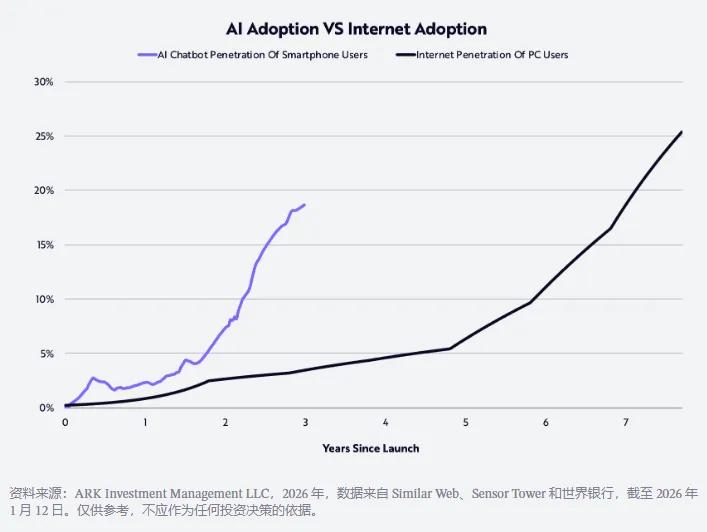
AI companies are among the fastest-growing businesses in history. Our research shows that consumers are adopting AI at twice the rate they adopted the internet in the 1990s, as shown below.
According to reports, by the end of 2025, OpenAI and Anthropic's annualized revenue will reach $20 billion and $9 billion respectively, representing a 12.5-fold and 90-fold increase compared to $1.6 billion and $100 million in the same period of the previous year!
Rumors suggest that both companies are considering an initial public offering (IPO) within the next year or two to raise funds for the large-scale investments needed to support their product models.
As Fidji Simo, CEO of OpenAI's Applications Division, said, "AI models are capable of far more than most people experience in their daily lives, and 2026 is the year to bridge that gap. The leaders in the field of AI will be those companies that can translate cutting-edge research into products that are truly useful to individuals, businesses, and developers."
This year, with a more human-centered, intuitive, and integrated user experience, we expect to make substantial progress in this area.
ChatGPTHealth is an early example; it's a section within the ChatGPT platform dedicated to helping users improve their health based on their personal health data.
In enterprises, many AI applications are still in their early stages, hampered by bureaucracy, inertia, and/or preconditions such as restructuring and building data infrastructure, resulting in slow progress.
By 2026, organizations may realize that they need to use their own data to train models and iterate rapidly, or risk being left behind by more aggressive competitors.
AI-driven use cases should be able to provide instant and superior customer service, faster product launches, and help startups create more value with fewer resources.
Market valuation is too high
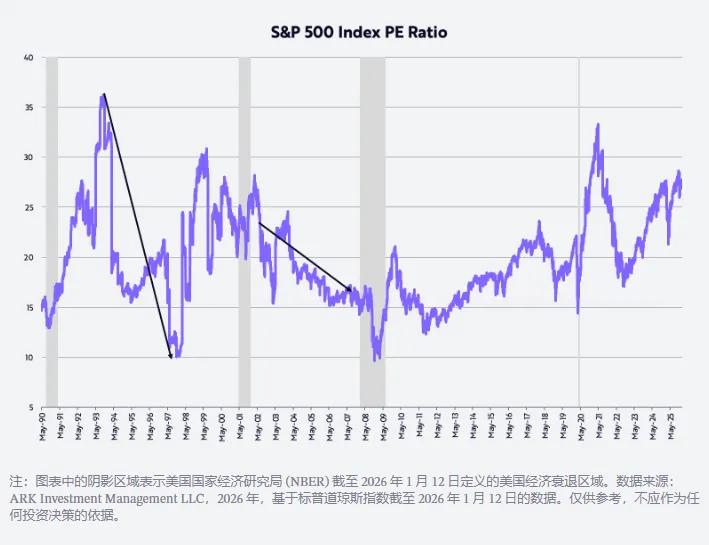
Many investors are concerned that the stock market is overvalued, currently at historical highs, as shown in the chart below.
Our own valuation assumption is that the price-to-earnings ratio (P/E) will fall back to around 20 times the average level of the past 35 years. Some of the most significant bull markets have been accompanied by a compression of the P/E ratio.
For example, from mid-October 1993 to mid-November 1997, the S&P 500 index had an annualized return of 21%, and its price-to-earnings ratio dropped from 36 to 10.
Similarly, from July 2002 to October 2007, the S&P 500's annualized return was 14%, and its price-to-earnings ratio fell from 21 to 17. Given our expectation that real GDP growth will be driven by productivity gains and slowing inflation, the same dynamics should repeat themselves in this market cycle, and may even be more pronounced.
As always, I am very grateful to ARK's investors and other supporters, and also to Dan, Will, Katie and Keith for helping me write this long New Year's message!
Cathy