AI, Bitcoin, RWA, and DeFi as seen through the eyes of "Cathie Wood".
Written by: ARK Invest
Compiled by: Saoirse, Foresight News
编者按:本文选编自「Cathie Wood」Cathie Wood 旗下ARK Invest 发布的旗舰报告《 Big Ideas 2026 》。原文覆盖AI、区块链、生物科技、太空探索等13 个核心创新趋势,由于内容过长,本文将重点编译加密货币与AI 两大板块内容。以下是编译内容:
Accelerated Innovation: Technological Convergence Ushers in a New Turning Point for Economic Growth
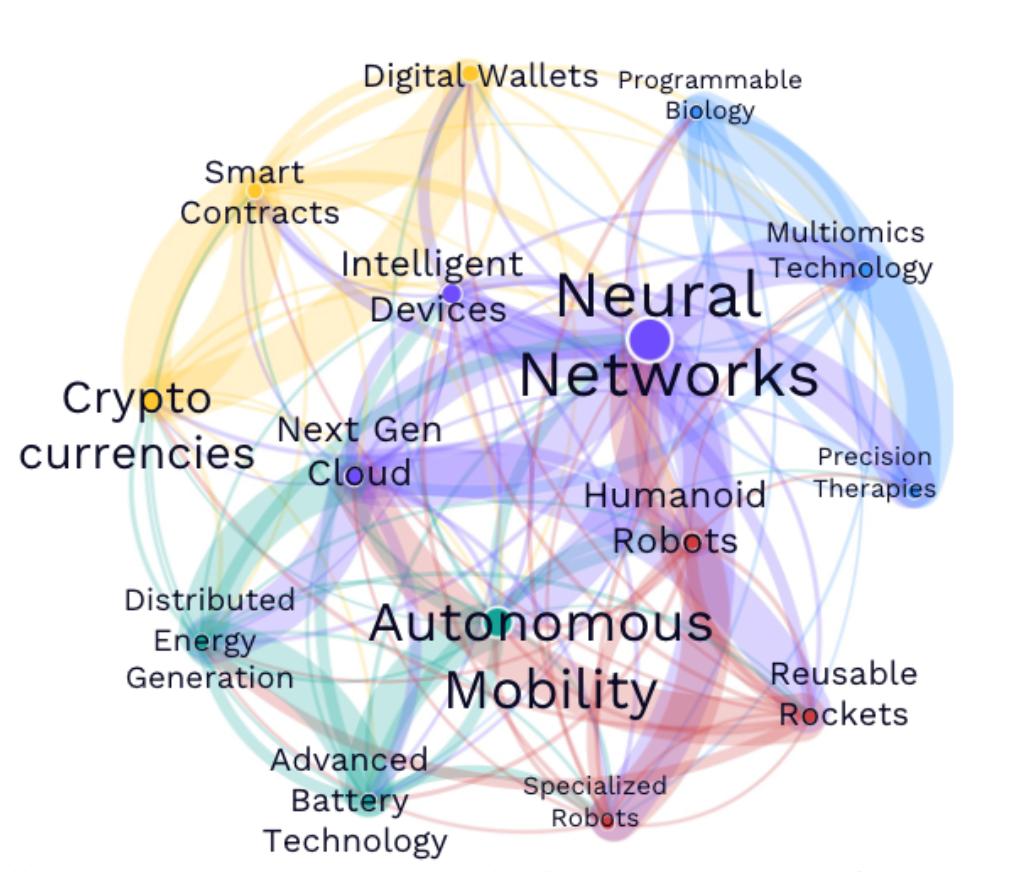
A diagram illustrating the collaboration among five major innovation platforms—presenting the mutually empowering relationships between AI, blockchain, robotics, energy storage, and multi-omics in a network structure, with arrows marking key collaborative scenarios.
Currently, five major innovation platforms—AI, blockchain, robotics, energy storage, and multi-omics technologies—are deeply interconnected. Breakthroughs in one area can empower other areas—for example, reusable rockets carrying AI chips support next-generation cloud computing, and multi-omics data in digital wallets accelerate the development of precision medicine. By 2025, the intensity of technological integration is projected to increase by 35%, with AI as the core enabler, and robotics and reusable rockets playing a catalytic role. Energy storage and smart contracts are also key supports. Meanwhile, space computing is breaking through the bottleneck of ground-based computing power (potentially reducing costs by 25% and increasing rocket demand by 60 times). Investment in innovation as a percentage of GDP is approaching the peak of the railway era, with AI software, data centers, and space exploration becoming growth engines.
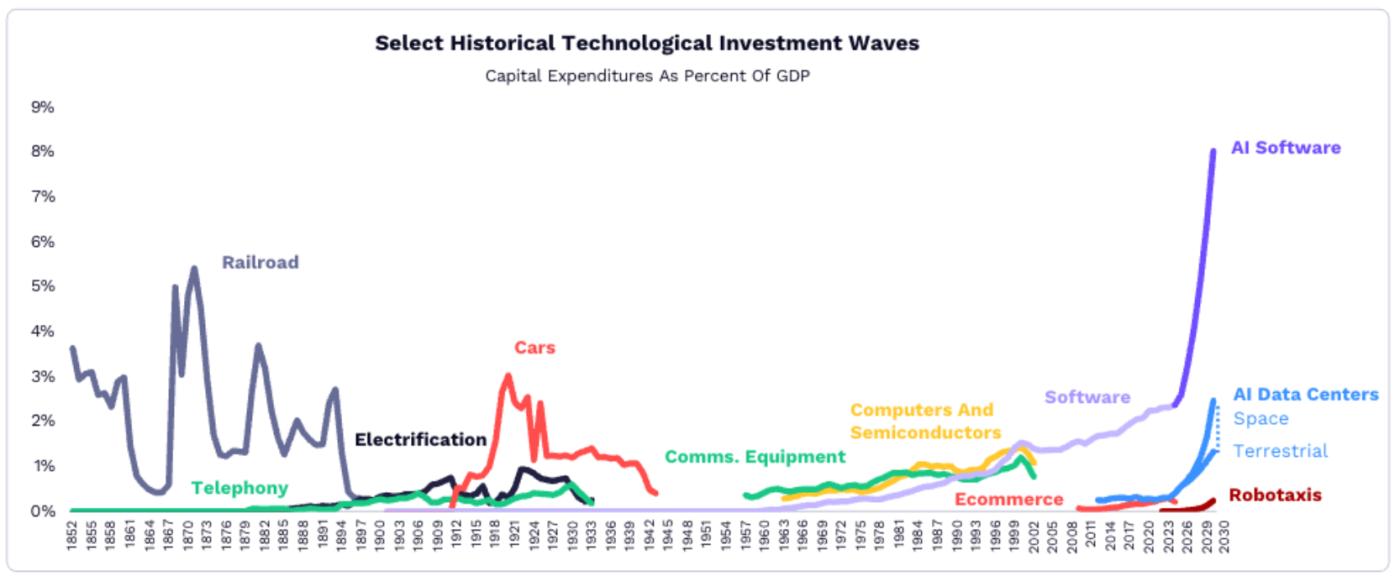
A comparison of the proportion of investment in GDP during historical technological waves. The blue bars show that the current innovation era accounts for 4.5%, approaching the peak of the railway era (5%), and surpassing the automobile and computer eras.
The following is an analysis of the core innovation areas:
Artificial Intelligence: The Core Engine Reshaping All Industries
AI Infrastructure: Defining the Next Generation of Cloud Computing
- Explosive demand: From December 2024 to January 2026, the demand for AI computing on OpenRouter (an API platform that integrates multiple large language models) increased 25 times; inference costs (the cost of AI models processing data) dropped by more than 99% in the past year, driving the widespread adoption of AI by enterprises and consumers.
- Data center investment is surging: Global investment in data center systems will reach $500 billion in 2025, 2.5 times the average level from 2012 to 2023, and is expected to increase to $1.4 trillion by 2030, with a compound annual growth rate of 29%.
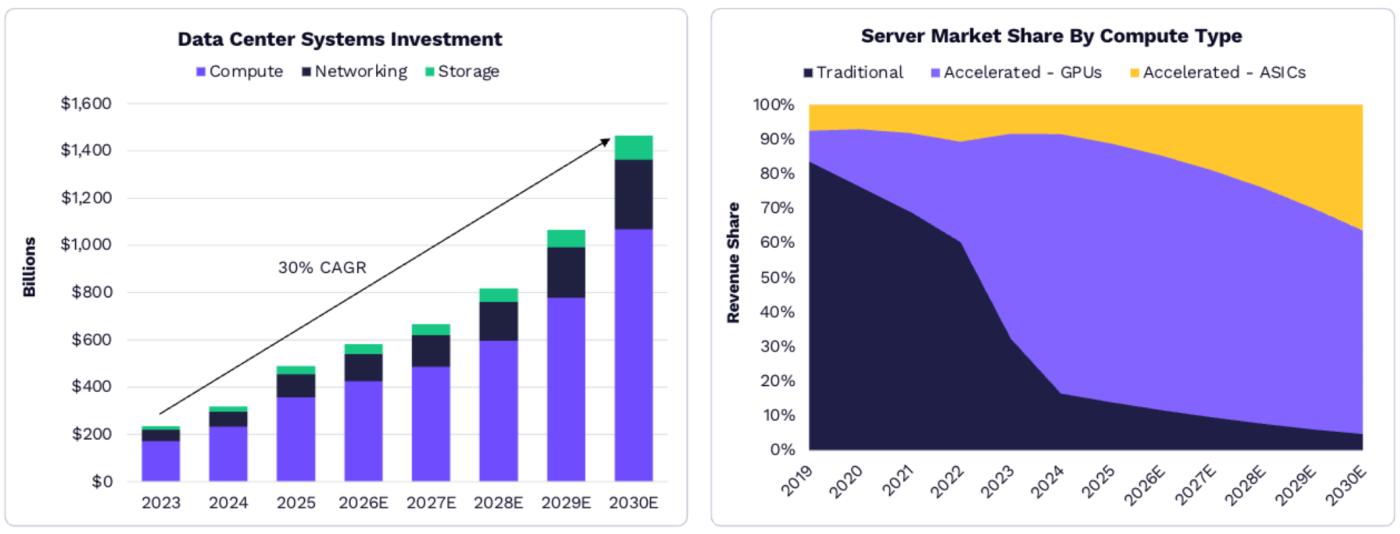
The left chart shows global data center investment growth from 2025 to 2030; the right chart shows server market share by computing type.
Shifting competitive landscape: Nvidia holds an 85% share of the GPU market thanks to its early investments in AI chip design, software, and networking. However, competitors such as AMD and Google are gradually catching up in areas like small-model inference. In the future, application-specific integrated circuits (ASICs) designed by companies like Broadcom and Amazon Annapurna Labs are expected to capture more market share in cost-sensitive computing scenarios.
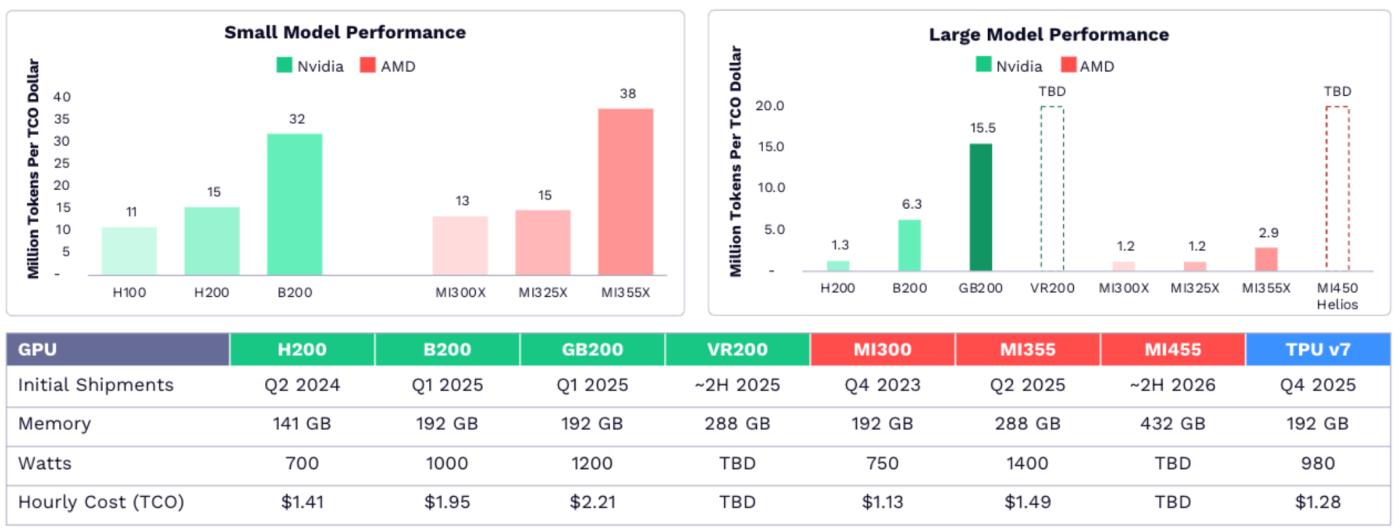
AI Chip Market Share in 2025 – In the table, green represents Nvidia, red represents AMD, and blue represents Google.
AI Consumer Operating System: Transforming Business and Transactions
- A paradigm shift in user interaction: AI models are becoming the new underlying architecture of the internet, with users interacting more frequently with AI agents (rather than traditional applications), and the adoption rate of AI far exceeding that of the internet. For example, the penetration rate of AI chatbots among smartphone users has increased faster than the early internet penetration rate among PC users.
- Leap in transaction efficiency: AI-powered purchasing agents are drastically reducing the consumer decision-making process, from one hour in the pre-internet era to approximately 90 seconds in the AI era. Anthropic's open-source Model Context Protocol (MCP) and OpenAI's Agent Business Protocol (ACP) are driving AI to achieve seamless information access and secure transactions.
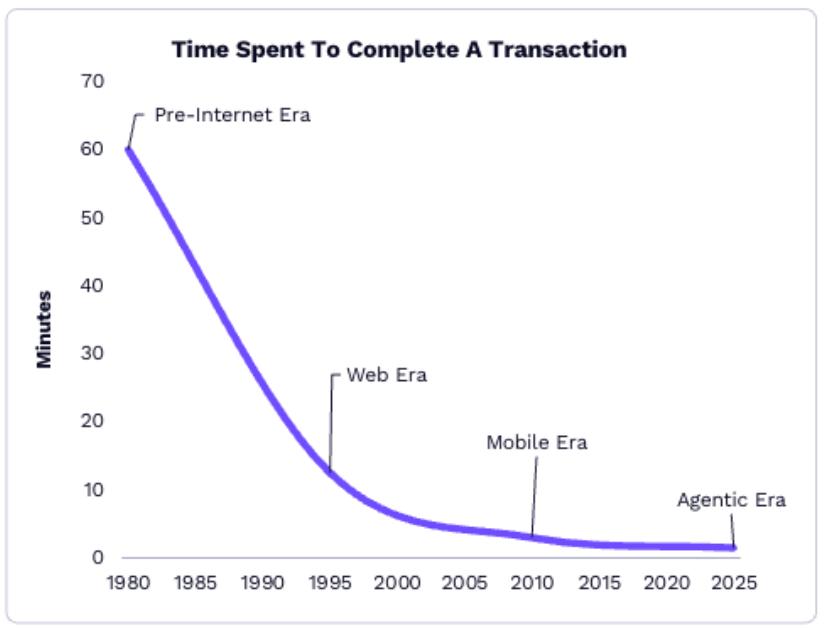
Comparison of consumer decision-making time across different eras – The timeline from left to right represents the pre-internet era (1980s), the Web era (2000s), the mobile era (2010s), and the AI era (2025), with the following time intervals: 60 minutes → 15 minutes → 5 minutes → 1.5 minutes.
Market size forecast: By 2030, the scale of online consumption facilitated by AI agents is expected to exceed US$8 trillion, accounting for 25% of the total global online consumption; the proportion of AI search traffic will rise from 10% in 2025 to 65%, and related advertising expenditure will grow at an annual rate of about 50%. It is estimated that by 2030, AI-mediated consumption-related revenue (advertising, lead generation, etc.) will reach US$900 billion.
AI Productivity: Unlocking Economic Potential
- AI capabilities continue to upgrade: By 2025, the time it takes for AI agents to reliably complete tasks will increase from 6 minutes to 31 minutes, a 5-fold increase in efficiency; for example, knowledge workers in the United States can save 50 minutes per day by using ChatGPT, and the subscription cost recovery period is only half a day.
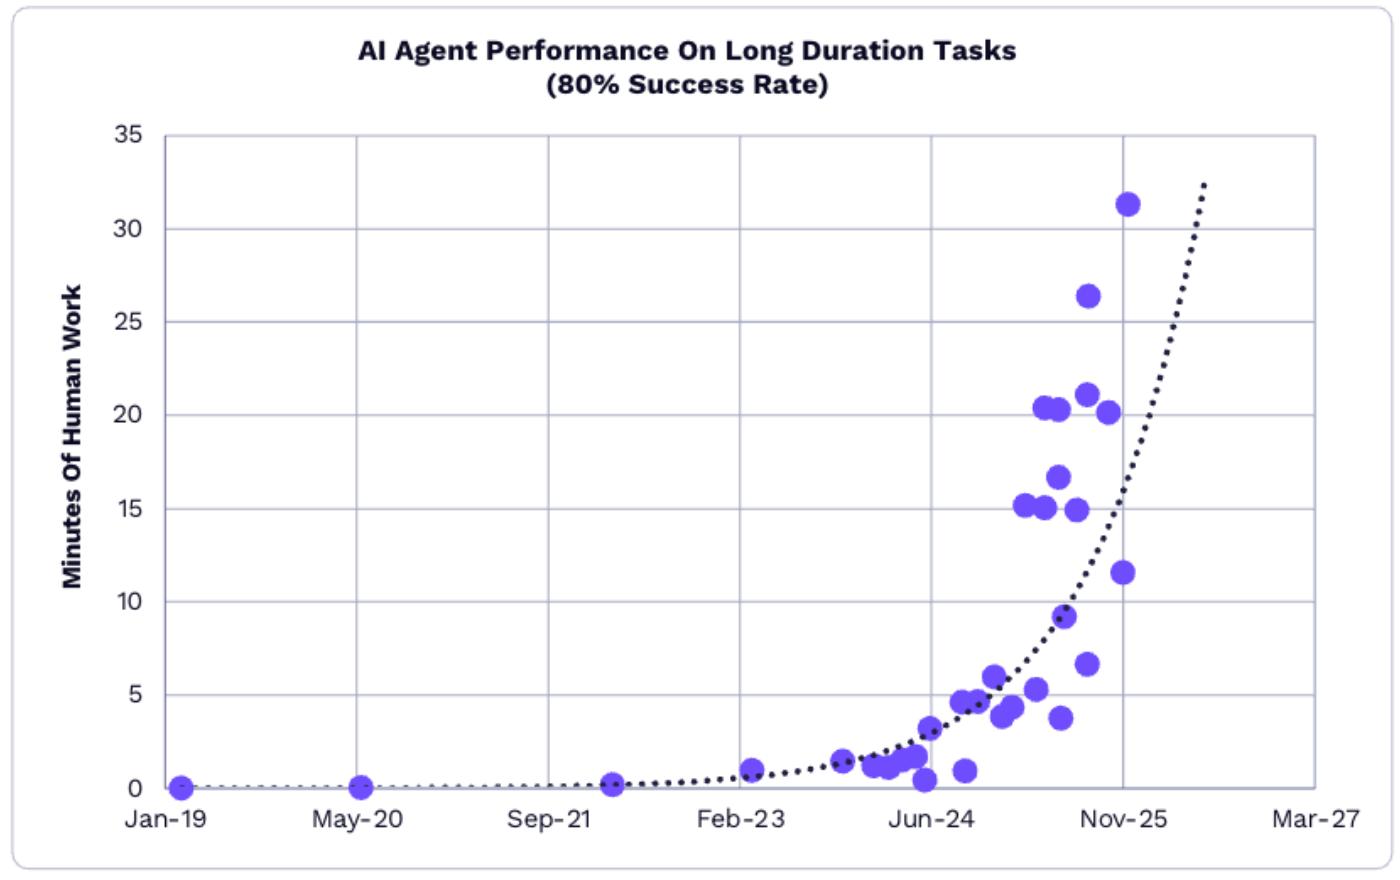
The duration of AI agent tasks will increase in 2024-2025.
- Exponential cost decline: The cost of AI models is declining exponentially across multiple fields. From April to December 2025, the cost of AI models related to software development dropped from $3.5 per million tokens to $0.32, a decrease of 91%.
- Global Competition and Economic Impact: The US leads China by about six months in AI model performance, but China holds an advantage in the open-source model field (occupying eight of the top ten highest-performing open-source models globally). If enterprises widely adopt AI to improve the efficiency of knowledge workers, global software spending growth may rise from 14% in the past decade to 19%-56% between 2025 and 2030, potentially unlocking $117 trillion in economic value in the long term.
Blockchain and Digital Assets: Reconstructing the Financial and Asset System
Bitcoin: Leading the Development of a New Asset Class
Bitcoin is maturing and becoming a core part of a new institutional asset class.
In 2025, Bitcoin prices exhibited a volatile upward trend, with key events continuously propelling its institutionalization process: the U.S. Securities and Exchange Commission (SEC) approved the listing standards for general-purpose cryptocurrency exchange-traded funds (ETFs), Morgan Stanley opened Bitcoin fund investment access to its clients, the Wisconsin pension fund included Bitcoin in its portfolio, Texas launched a Bitcoin strategic reserve, Fidelity launched cryptocurrency individual retirement accounts (IRAs), and President Trump signed an executive order establishing a "strategic Bitcoin reserve" during his inauguration. Despite the market volatility on October 10th, which saw the liquidation of $19 billion in leveraged positions, Bitcoin as a whole demonstrated stronger resilience.
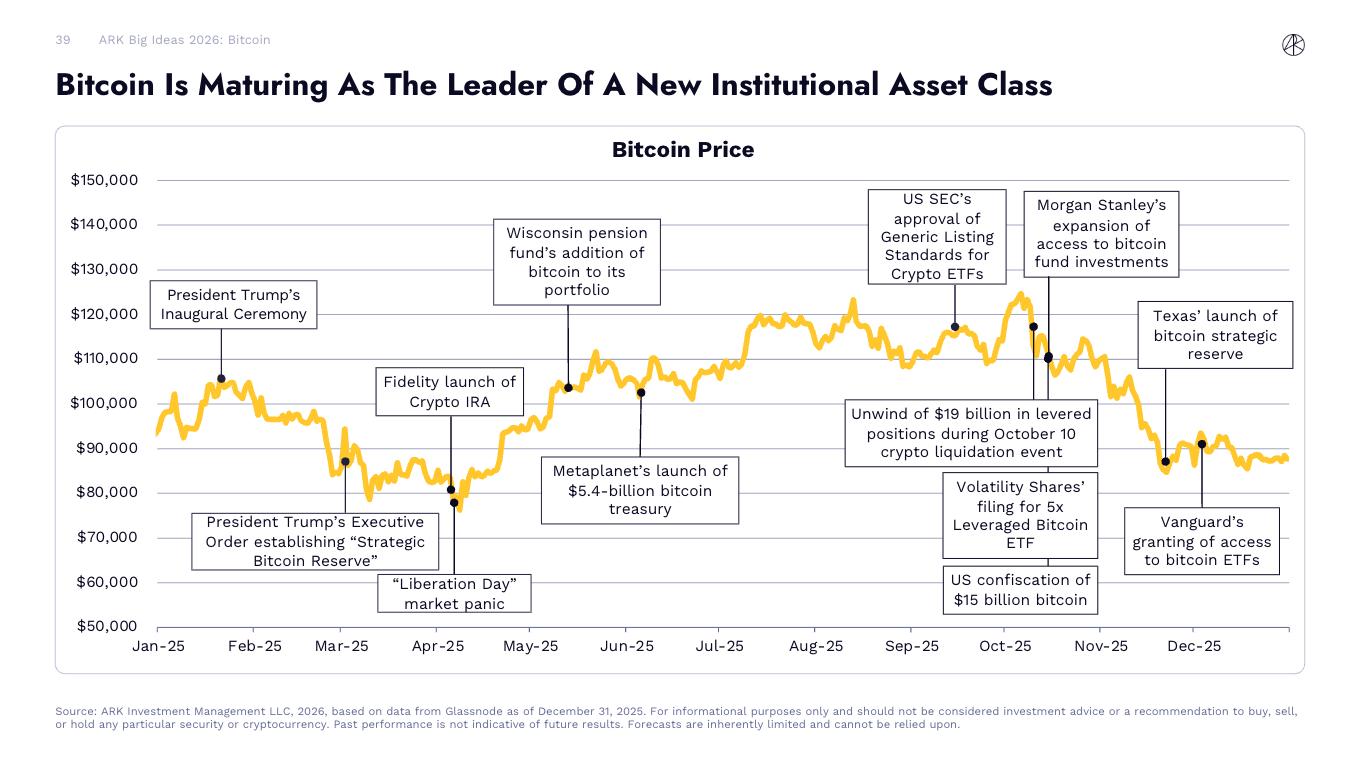
Bitcoin price movement from January to December 2025, highlighting key events.
US ETFs and listed companies hold 12% of Bitcoin.
In 2025, holdings in US Bitcoin ETFs increased by 19.7% to 1.29 million Bitcoins, while holdings in publicly traded companies increased by 73% to 1.09 million Bitcoins, from approximately 598,000. Driven by this, the proportion of Bitcoin held by ETFs and publicly traded companies in the total circulating supply rose from 8.7% to 12%, indicating a continued deepening of institutional investors' acceptance of Bitcoin.
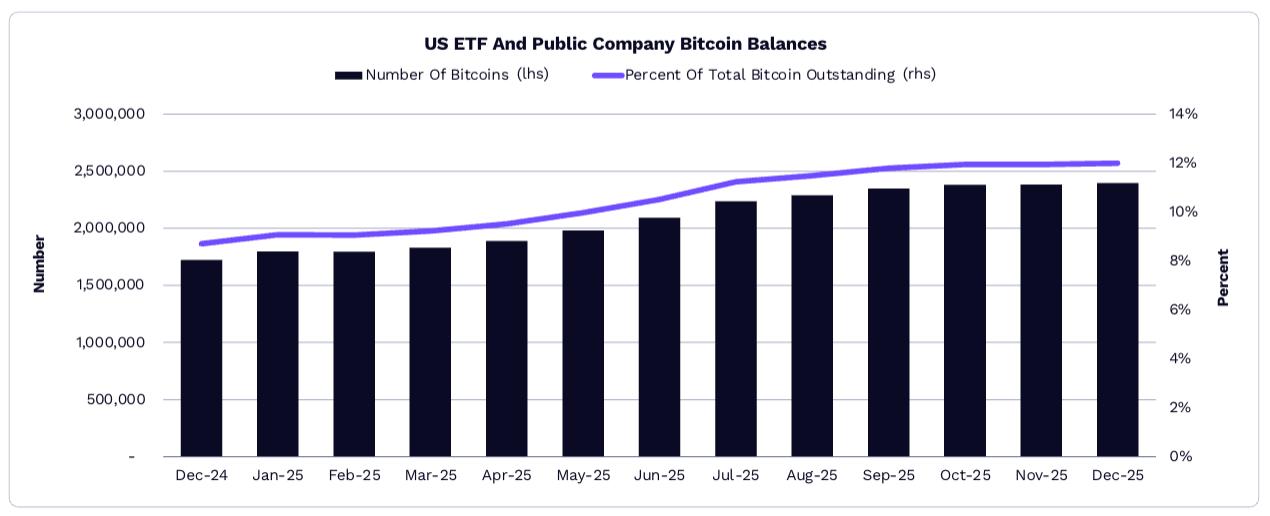
Changes in Bitcoin holdings and their percentage of total supply in US ETFs and publicly traded companies from December 2024 to December 2025.
Bitcoin's risk-adjusted returns have consistently outperformed its competitors.
In the long run, Bitcoin's annualized risk-adjusted return (Sharpe ratio) has outperformed the overall cryptocurrency market. For most of 2025, Bitcoin's risk-adjusted return surpassed that of ETH, SOL, and the other nine constituent coins in the CoinDesk 10 index. Since November 2022 (the low point of this cycle), early 2024, and early 2025, Bitcoin's average annual Sharpe ratio has also been higher than those of the aforementioned cryptocurrencies.
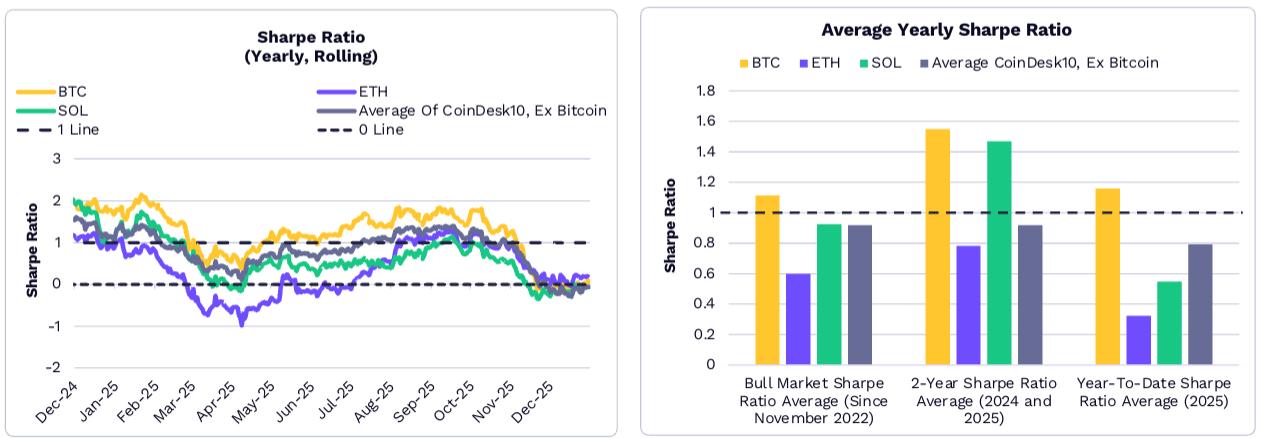
The left chart shows the rolling annualized Sharpe ratio of Bitcoin and other cryptocurrencies from December 2024 to December 2025; the right chart compares the average annual Sharpe ratio for different time periods (2025, 2024-2025, and November 2022 to present).
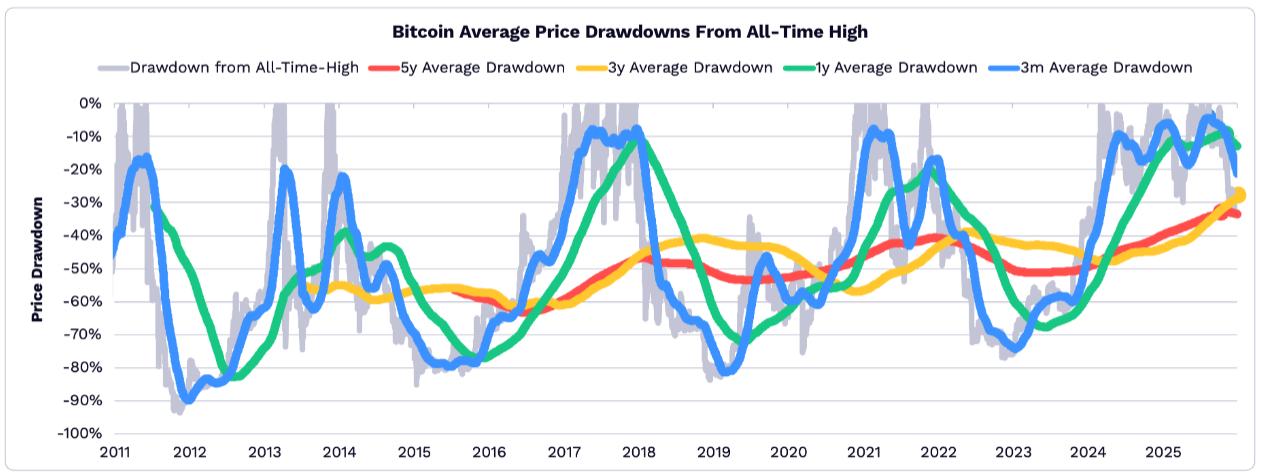
Bitcoin price pullback in 2025 hits record low
As Bitcoin's safe-haven asset attributes gradually strengthen, its volatility continues to decrease. In 2025, looking at four time dimensions—5 years, 3 years, 1 year, and 3 months—the average retracement of Bitcoin's price relative to its historical high was lower than historical levels, making it the year with the shallowest retracement across all time dimensions in history.
Bitcoin 2030 Prediction: Assumptions Adjusted but Overall Outlook Stable
ARK's overall forecast for Bitcoin's market capitalization in 2030 remains stable, but adjustments have been made to two core assumptions:
- The target market size (TAM) for "digital gold" is projected to increase by 37% in 2025, from approximately $18 trillion to $24.4 trillion, driven by a 64.5% surge in the market capitalization of gold.
- Penetration rate of "safe-haven assets in emerging markets": Due to the much faster-than-expected adoption of stablecoins in developing countries, the predicted penetration rate of Bitcoin in this scenario has decreased by 80%, from the original 0.5%-6% to 0.1%-1.3%.
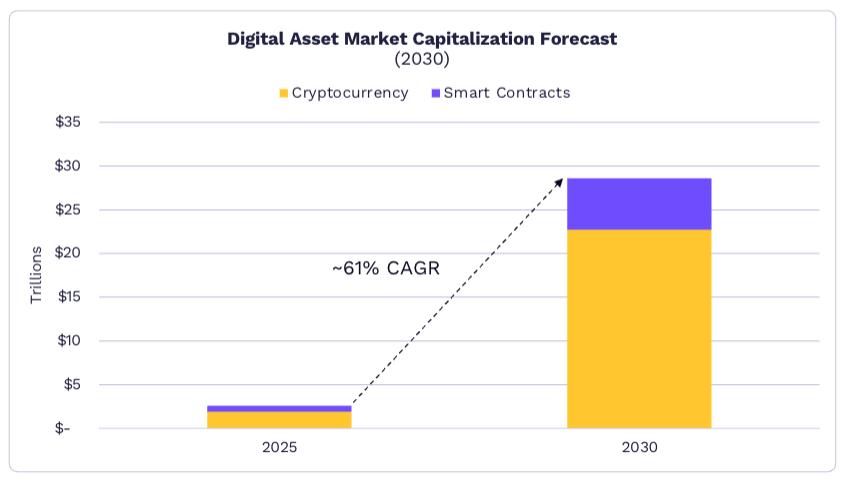
Even so, ARK still predicts that the global digital asset market will reach $28 trillion by 2030, with Bitcoin expected to account for 70% of the market, a market capitalization of about $16 trillion, and a compound annual growth rate of about 63%.
Tokenized assets: Driving trillions of dollars in assets toward the blockchain
The GENIUS Act is prompting institutions to accelerate their expansion.
The GENIUS Act provided a clear regulatory framework for stablecoins and asset tokenization, directly driving stablecoin trading activity to record highs. Numerous companies and institutions announced related initiatives: Circle, BitGo, Paxos, and Ripple obtained conditional banking licenses; Stripe launched Tempo, a Layer 1 blockchain focused on stablecoins, and applied for a national bank trust license; Tether-backed Layer 1 blockchain Plasma launched its mainnet; BlackRock disclosed plans for its self-developed tokenization platform; YouTube enabled creators to receive payments via PayPal's PYUSD stablecoin; and JPMorgan Chase launched JPM Coin on the Base blockchain, among others.
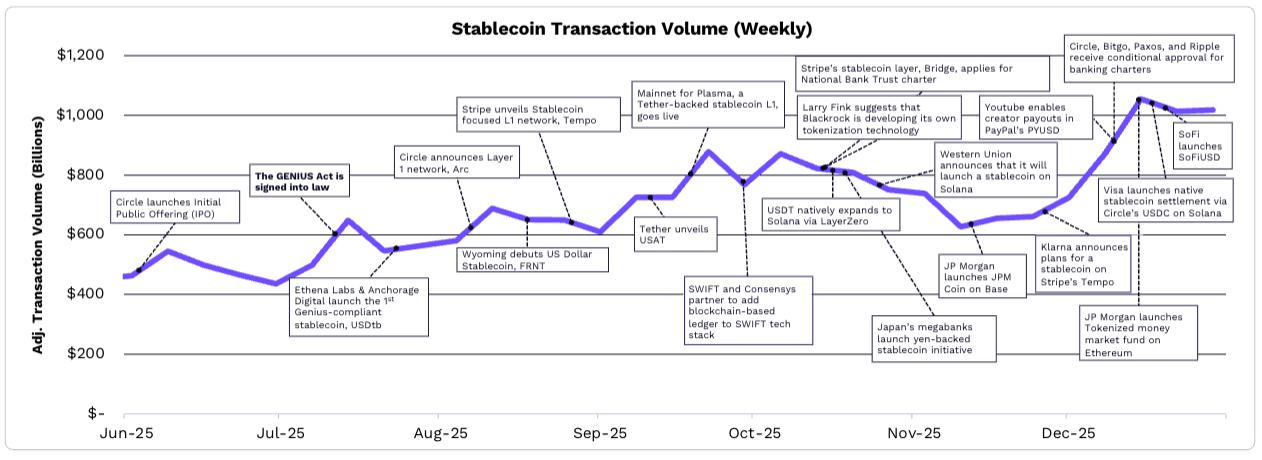
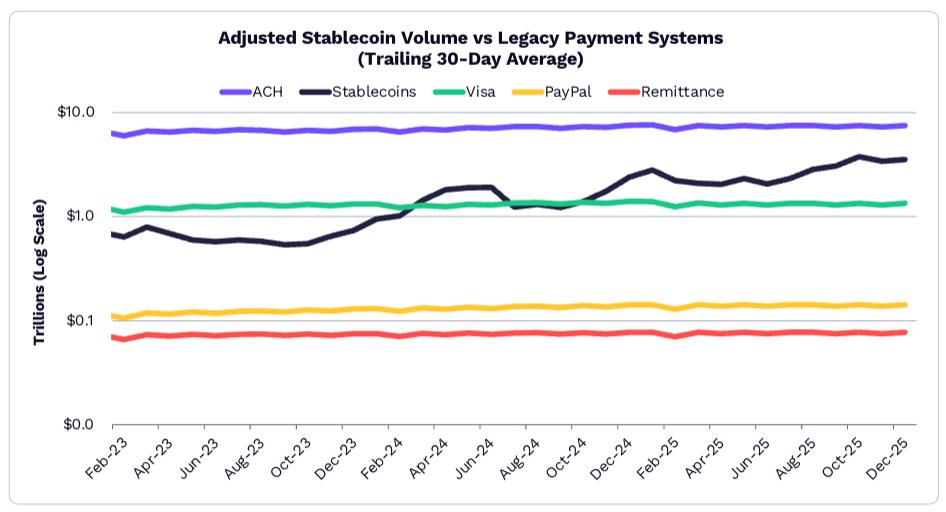
Weekly adjusted trading volume of stablecoins from June to December 2025 (excluding miner withdrawable value and exchange trading).
Stablecoin transaction volume far exceeds that of most traditional payment systems
In December 2025, the 30-day average adjusted trading volume of stablecoins reached $3.5 trillion, 2.3 times the combined trading volume of PayPal, remittance services, and Visa. Circle's USDC accounted for approximately 60% of the adjusted trading volume, while Tether's USDT accounted for approximately 35%. In 2025, the total supply of stablecoins increased by 50% from $210 billion to $307 billion, with USDT and USDC accounting for 61% and 25% respectively. Sky Protocol was the only stablecoin besides these two with a market capitalization exceeding $1 billion, while PayPal's PYUSD saw its market capitalization increase more than sixfold to $3.4 billion.
Tokenized Reality Assets (RWA) are projected to grow by 208% by 2025.
With US Treasury bonds and commodities at their core, the global market capitalization of tokenized real-world assets (RWA) is projected to increase from $6.1 billion to $18.9 billion by 2025, representing a growth of 208%. Specifically:
- US Treasury bonds: Total tokenization reached $9 billion, with BlackRock's $1.7 billion BUIDL money market fund accounting for 20%;
- Commodities: Tether's XAUT (tokenized gold) and Paxos' PAXG (tokenized gold) have market capitalizations of $1.8 billion and $1.6 billion respectively, accounting for 83% of the tokenized commodities market.
- Stocks: The scale of tokenized public stocks is close to $750 million, gradually becoming a new growth point for asset tokenization.
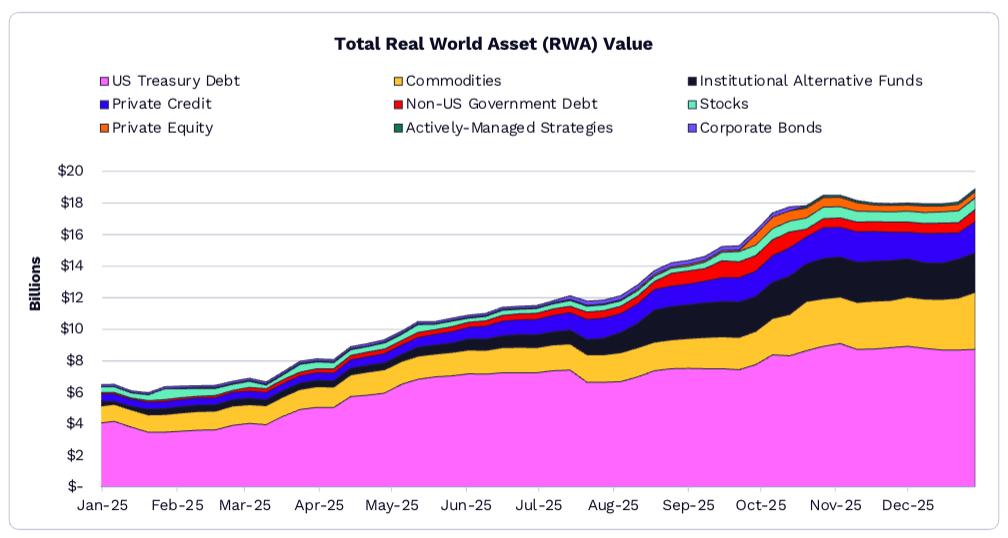
Changes in market capitalization of tokenized real-world assets (RWA) across various categories from January to December 2025 (including U.S. Treasury bonds, commodities, private credit, etc.).
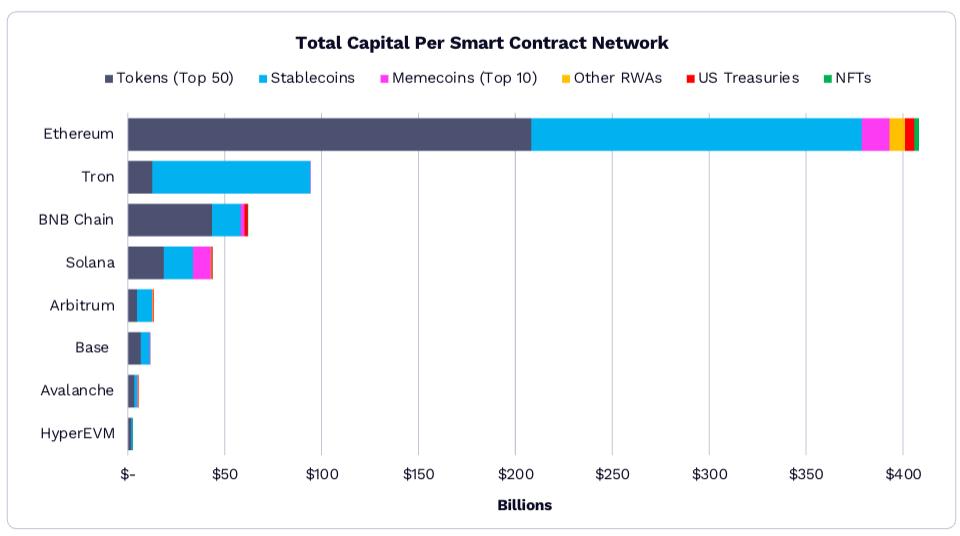
Ethereum remains the preferred blockchain for on-chain assets.
By the end of 2025, the on-chain asset size of Ethereum exceeded $400 billion, holding an absolute dominant position in smart contract blockchains. In terms of asset structure: among the eight major mainstream smart contract blockchains, seven have "top 50 tokens + stablecoins" accounting for 90%; Solana is the only exception, with its Meme coin accounting for 21%, while the proportion for other blockchains is less than 3%. In the future, the tokenization of real-world assets is expected to become one of the fastest-growing categories, and the fact that a large number of offline assets have not yet been put on-chain provides vast growth potential for the blockchain industry.
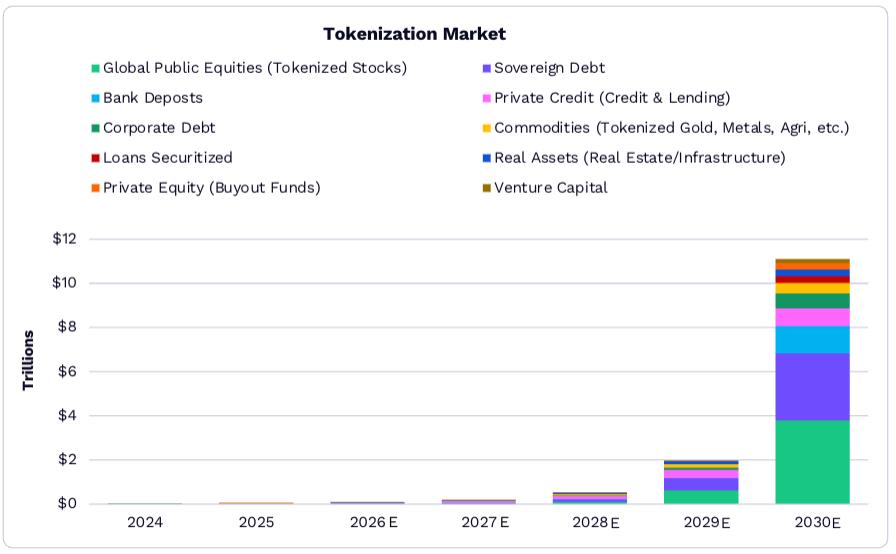
The global tokenized asset market will exceed $11 trillion by 2030.
ARK research shows that the size of tokenized assets will grow from $19 billion to $11 trillion between 2025 and 2030, accounting for 1.38% of global financial assets. In terms of asset types, sovereign debt (such as US Treasury bonds) currently dominates, but the proportion of bank deposits and publicly traded stocks on the blockchain will significantly increase in the future, becoming the core driving force for the growth of the tokenization market. ARK believes that improved regulatory clarity and the development of institutional-grade infrastructure will be key prerequisites for the large-scale implementation of asset tokenization.
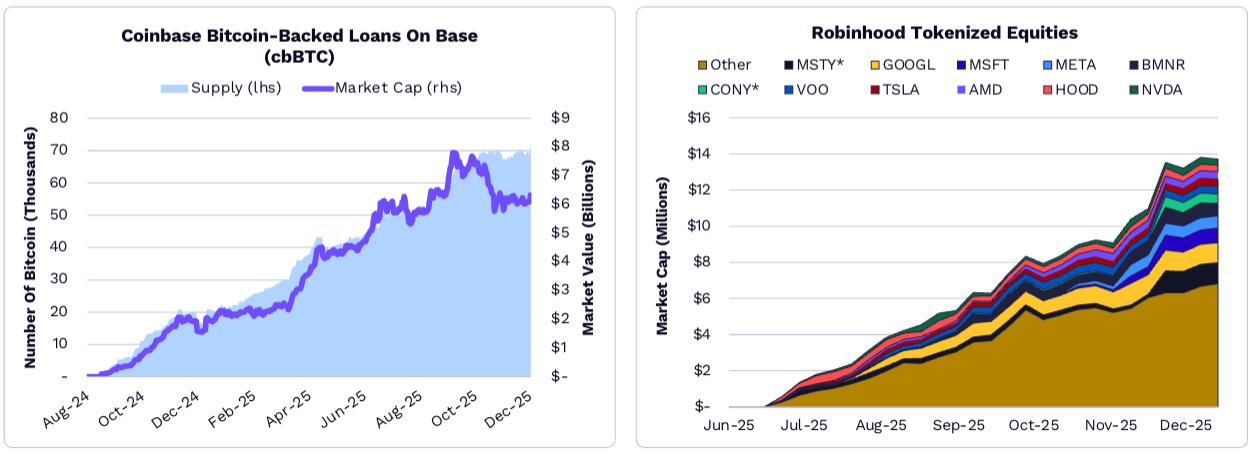
Traditional enterprises are accelerating the construction of on-chain infrastructure.
Traditional financial and technology companies are launching dedicated on-chain infrastructures to support their tokenized businesses: Circle launched its Layer 1 blockchain "Arc," Coinbase launched its Base blockchain and cbBTC (a Bitcoin-pegged token), Kraken launched its "Ink" network, OKX developed "X Layer," Robinhood created "Robinhood Chain," Stripe launched "Tempo," and so on. These platforms are mainly used to support businesses such as Bitcoin-backed lending, tokenized stocks and ETFs, and stablecoin payment channels. For example, Coinbase's Bitcoin-backed lending business on Base had a supply of over 80,000 Bitcoins by the end of 2025; Robinhood's tokenized stocks (such as GOOGL, MSFT, NVDA, etc.) saw rapid growth in market capitalization between June and December 2025, with some assets exceeding $100 million in market value.
DeFi Applications: Building a Growth Engine for Digital Assets
Digital asset value capture shifts to application side
The value distribution landscape of decentralized finance (DeFi) is undergoing significant changes: blockchain networks are gradually becoming "infrastructure," while user economics and profit margins are shifting towards application-side applications. In 2025, DeFi applications, represented by Hyperliquid, Pump.fun, and PancakeSwap, generated a record-breaking total revenue of $3.8 billion; January alone accounted for 20% of the year's revenue, making it the highest-grossing single month for DeFi applications in history. By the end of 2025, 70 DeFi applications and protocols had achieved a monthly revenue per unit (MRR) exceeding $1 million, making applications the core value carrier of the DeFi ecosystem.
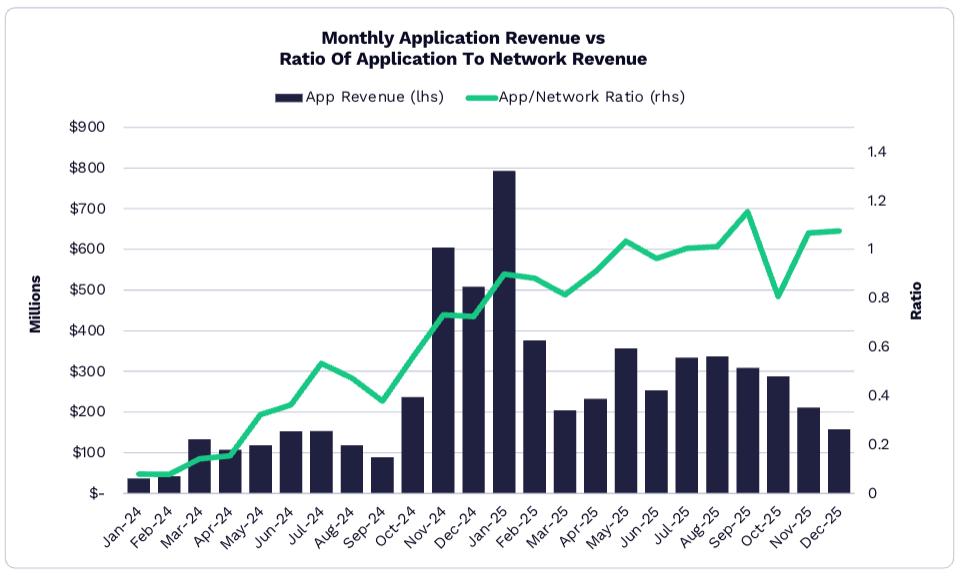
The changes in monthly revenue and "application/network revenue ratio" of DeFi applications from November 2024 to December 2025 show that the proportion of revenue from applications continues to increase.
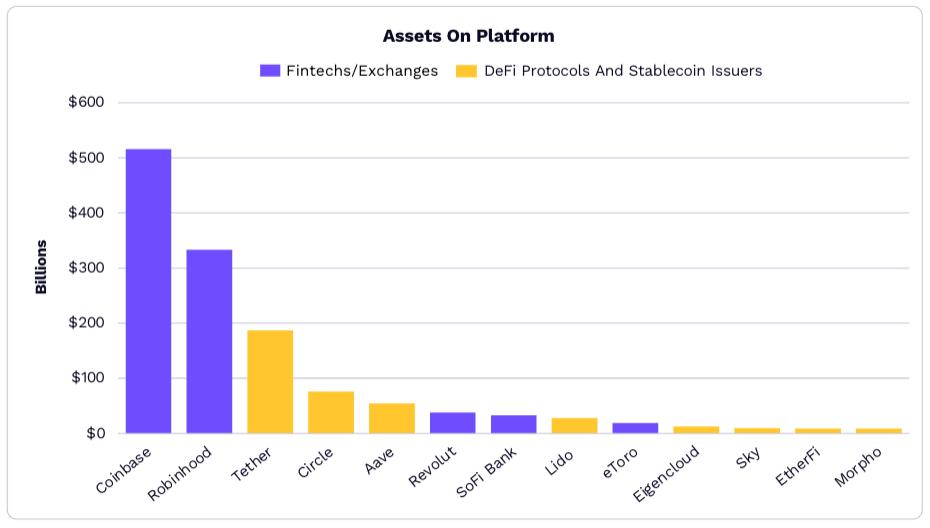
DeFi and stablecoin issuers' asset size is approaching that of traditional fintech.
The asset size gap between traditional fintech platforms and crypto-native platforms is narrowing, indicating a trend of convergence between traditional finance and on-chain financial infrastructure. Specifically, DeFi protocols (such as liquidity staking and lending platforms) are attracting a large influx of institutional funds and are rapidly expanding in scale: as of the end of 2025, the total value locked (TVL) of the top 50 DeFi platforms all exceeded $1 billion, and the TVL of the top 12 platforms all exceeded $5 billion. The asset size of some leading platforms (such as Lido and Aave) is approaching that of traditional fintech companies such as Coinbase and Robinhood.
Hyperliquid, Tether, and other companies are global leaders in workforce efficiency.
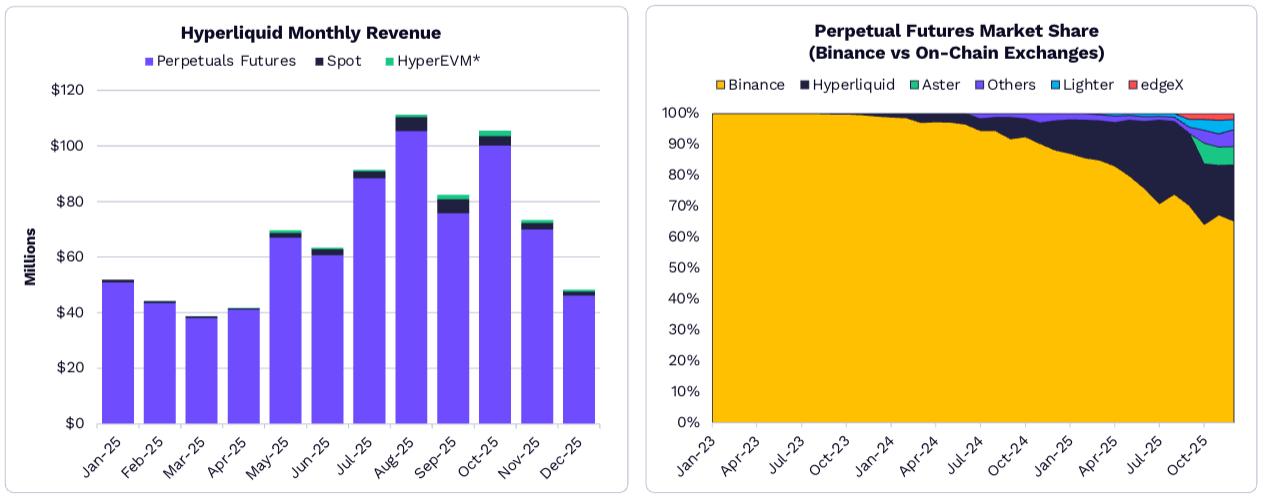
In 2025, some DeFi and stablecoin companies demonstrated extremely high operational efficiency, becoming one of the groups with the highest "revenue per employee" globally: Hyperliquid, with fewer than 15 employees, generated over $800 million in annual revenue; Tether, leveraging stablecoin issuance and transaction fees, achieved billions of dollars in revenue with a small workforce; and Pump.fun's revenue per employee far exceeded that of traditional financial and technology companies. These on-chain companies significantly reduced labor costs through automated smart contracts and decentralized governance, redefining the standard of "corporate productivity." Among them, perpetual contracts, stablecoins, and meme coins are currently the on-chain verticals with the highest product-market fit (PMF), continuing to lead in user and capital attraction.
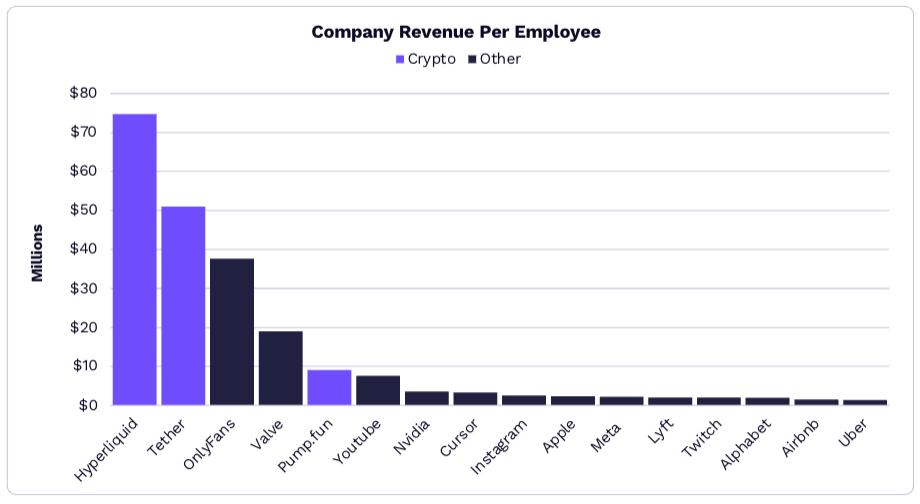
A comparison of revenue per employee for crypto companies like Hyperliquid and Tether with that of traditional companies like OnlyFans, Nvidia, and Meta in 2025.
DeFi derivatives are capturing market share of Binance perpetual contracts.
DeFi derivatives platforms, exemplified by Hyperliquid, are seizing market share in perpetual contracts from centralized exchanges like Binance. In 2025, Hyperliquid's monthly revenue grew from approximately $5 million in January to over $100 million in December, and its share of global perpetual contract trading volume increased from less than 1% to 8%. During the same period, Binance's perpetual contract market share dropped from 85% to below 70%, while other DeFi derivatives platforms such as Aster and Lightner also saw market share growth. This trend indicates a significant increase in user demand for derivatives trading that allows for "trustless intermediaries and independent asset control," highlighting the growing advantages of DeFi in terms of trading experience and cost.
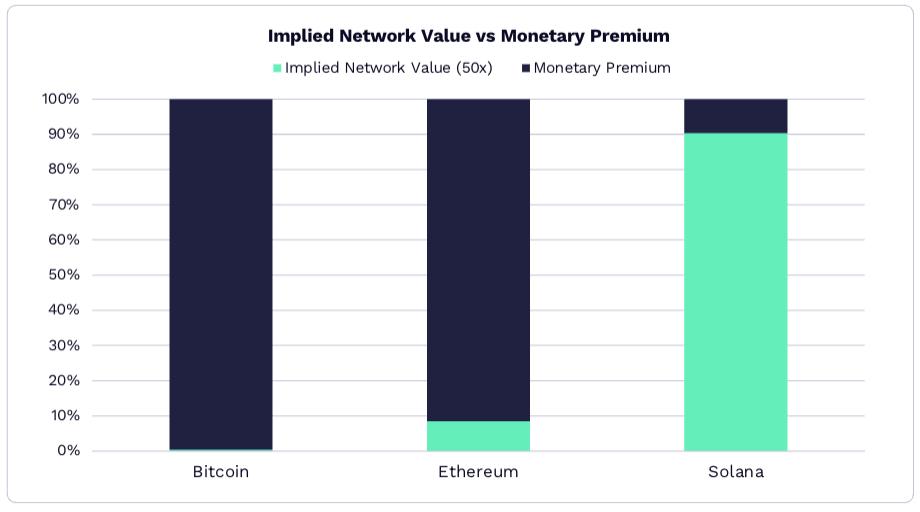
Layer 1 blockchain is transforming into "monetary assets".
The value logic of Layer 1 blockchains (such as Bitcoin, Ethereum, and Solana) is shifting from "revenue-driven" to "currency-driven": Based on a 50x revenue growth multiple, over 90% of Ethereum's market capitalization stems from its "currency premium" (its attribute as an on-chain store of value and medium of exchange), rather than network revenue; while Solana, despite generating $1.4 billion in network revenue in 2025, still has 90% of its market capitalization supported by its currency attributes. ARK believes that in the future, only a few digital assets will retain their currency attributes and become highly liquid stores of value, while the remaining assets will rely more on revenue from real-world application scenarios to support their valuations.
Innovation directions for DeFi protocols: Modularization and cross-chain collaboration
As users' demands for complex financial scenarios increase, DeFi protocols are innovating towards "modular architecture" and "cross-chain collaboration".
- Modular design: Leading DeFi projects are beginning to break down core functionalities (such as trading, liquidation, and staking) into composable "modular components." For example, Aave launched a "modular lending framework" that allows developers to customize collateral types, interest rate models, and liquidation rules to adapt to different scenarios (such as NFT-backed lending and cross-chain asset staking); Uniswap V5 introduced a "custom fee module" that allows projects to set differentiated fees for specific trading pairs, increasing market maker revenue. This design significantly lowers the development threshold for DeFi applications, and the number of long-tail protocols built on modular components increased more than threefold in 2025.
- Deepening Cross-Chain Collaboration: The maturity of Layer 0 protocols (such as Cosmos and Polkadot) and cross-chain bridges (such as LayerZero and Avalanche Bridge) has driven improvements in the efficiency of DeFi asset flow across different blockchains. In 2025, the proportion of cross-chain DeFi transactions rose from 15% to 32%, with "Ethereum-Solana" and "Ethereum-Base" cross-chain transactions accounting for the largest share. For example, users can deposit USDC into Ethereum, cross-chain it to Solana via LayerZero, participate in meme coin trading on Pump.fun, and then transfer the profits back to Ethereum via a cross-chain bridge. The entire process has been reduced from 1 hour to within 5 minutes, with transaction fees reduced by 60%.
Institutional funds are reshaping the DeFi ecosystem.
In 2025, institutional investors significantly increased their participation in DeFi, shifting from "wait-and-see" to "active engagement," mainly exhibiting three major trends:
- Liquidity staking has become a key entry point: Traditional asset management institutions (such as BlackRock and Fidelity) participate in staking assets like Ethereum and Solana through compliant liquidity staking platforms (such as Lido and Coinbase Prime) to obtain stable returns. In 2025, the scale of institutional-led liquidity staking increased from $5 billion to $35 billion, accounting for 42% of the total market liquidity staking. For example, BlackRock staked over 2 million Ethereum on Lido, becoming Lido's third-largest staker.
- The demand for customized DeFi products is growing: Institutional clients are increasingly seeking DeFi products with "low volatility and high compliance," driving protocols to launch customized solutions. For example, Aave designed a "segregated lending pool" for family offices, allowing only compliant assets (such as USDC and tokenized government bonds) as collateral and setting a 1.5x collateralization ratio cap to reduce liquidation risk; Curve launched an "institutional-grade stablecoin exchange pool," providing large-scale exchange services with zero slippage and low fees to meet the daily fund allocation needs of institutions, which typically amount to millions of dollars.
- Improved Compliance Tools and Audit Systems: To attract institutional funding, DeFi protocols have strengthened their compliance efforts. For example, they integrate on-chain monitoring tools such as Chainalysis and Elliptic, regularly undergo smart contract audits by the Big Four accounting firms (such as PwC), and some protocols have even obtained US MSB (Money Services Business) licenses. In 2025, the number of DeFi protocols that passed compliance audits increased 2.5 times, and the proportion of institutional funds locked in DeFi rose from 8% to 21%.
Challenges and Regulatory Responses of DeFi
Despite its rapid development, DeFi still faces three major challenges: technological risks, regulatory uncertainty, and user barriers.
- 技术风险持续暴露:2025 年,DeFi 协议因智能合约漏洞、flash loan攻击导致的损失达12 亿美元,虽较2024 年下降30%,但高风险事件仍频发。例如,某去中心化交易所因「权限控制漏洞」被黑客盗取1.8 亿美元资产,凸显代码安全的重要性。为此,行业加速推进「形式化验证」技术应用,2025 年采用该技术的DeFi 协议占比从20% 升至55%,漏洞发生率降低70%。
- The regulatory framework is gradually becoming clearer: Major global economies have begun to introduce regulatory rules for DeFi, focusing on "categorized regulation" and "responsibility definition." For example, the US SEC classifies DeFi protocols into "trading platforms," "lending platforms," and "asset management platforms," each subject to different regulatory requirements; the EU's Crypto Asset Markets Directive (MiCA) requires DeFi protocol operators to register as "Crypto Asset Service Providers" (CASPs), disclose risk information, and accept regulatory review. While the clarification of regulations increases compliance costs, it also reduces market uncertainty; in 2025, the user retention rate of compliant DeFi protocols was 40% higher than that of non-compliant protocols.
- The user barrier still needs to be lowered: Current DeFi operations still rely on technical details such as wallets and private key management, which are difficult for ordinary users to master. In 2025, the industry launched "simplified DeFi entry points." For example, Coinbase Wallet has a built-in "one-click staking" function, allowing users to participate in staking projects on different chains without manually switching blockchains; MetaMask launched a "natural language interaction" function, allowing users to automatically complete the on-chain operation by entering "deposit 100 USDC into Aave to earn yield," significantly reducing the barrier to entry. These tools drove an 80% increase in DeFi monthly active users (MAU) in 2025, with the proportion of users without a technical background rising from 35% to 58%.
DeFi Market Size Forecast for 2030
ARK projects that the total revenue of the DeFi industry will grow from $3.8 billion to $45 billion between 2025 and 2030, representing a compound annual growth rate of 65%, with the main growth drivers coming from three major areas:
- Derivatives trading: DeFi derivatives such as perpetual contracts and options will continue to gain market share from centralized exchanges. By 2030, the trading volume of DeFi derivatives is expected to rise from 8% in 2025 to 35%, with revenue reaching $22 billion.
- Institutional-grade services: Customized DeFi services for traditional institutions (such as compliant staking and cross-chain fund management) will become a new growth point, with related revenue reaching $15 billion by 2030;
- Penetration into long-tail scenarios: DeFi applications in microfinance (such as cross-border small-amount remittances) and supply chain finance (such as tokenized accounts receivable) will gradually be implemented, contributing $8 billion in revenue by 2030.
Meanwhile, ARK emphasized that the long-term development of DeFi will depend on the synergistic improvement of "technological security", "regulatory compliance" and "user experience". Only by solving these three core issues can DeFi achieve the leap from "niche market" to "mainstream financial supplement".
Summary: Three Core Trends in Blockchain Assets
From the development of Bitcoin and tokenized assets to DeFi applications, the blockchain industry is entering a new stage of "institutionalization, compliance, and scenario-based application" in 2025, presenting three core trends:
- The asset attributes are shifting from "speculative tools" to "compliant assets": Bitcoin has gained institutional recognition through ETFs, strategic reserves, and other forms; tokenized assets are introducing traditional financial assets into the blockchain; DeFi is attracting institutional funds through compliance reforms; and the asset attributes of the entire industry are becoming more stable, gradually becoming part of mainstream investment portfolios.
- The value logic has shifted from "narrative-driven" to "application-driven": early blockchain assets relied on "technical narratives" for hype, but now Bitcoin's safe-haven properties, the efficiency improvements of tokenized assets, and DeFi's actual financial service capabilities are all centered on "solving real needs," with application scenarios becoming the key to value support;
- The ecosystem is shifting from "isolated development" to "collaborative integration": Bitcoin is linked with DeFi through cross-chain bridges, tokenized assets are circulated in DeFi, traditional financial institutions participate in the on-chain ecosystem through infrastructure construction, and the integration of blockchain with traditional finance and the real economy is deepening, which is accelerating the implementation of the "Internet of Value".
In the next five years, with the maturation of technology and the improvement of regulations, blockchain assets are expected to occupy a more important position in the global financial system, creating new value spaces for investors, enterprises and economies.
other
Biotechnology: Multi-omics + AI Revolutionize Healthcare
- Multi-omics technologies: Integrating multi-dimensional data such as genomics and proteomics to support disease research and drug development, with companies such as Illumina and QuantumSi being representative in this field.
- Costs and Data: The cost of whole-genome sequencing will decrease from hundreds of millions of dollars in 2001 to $100 in 2025 and is expected to reach $10 in 2030; by 2030, molecular diagnostics will generate 200 trillion "biotokens" annually, laying the foundation for AI healthcare.
- AI empowers: AI reduces drug development cycles from 13 years to 8 years and costs from $2.4 billion to $0.7 billion; gene editing therapies save on healthcare expenses in the long term, and the US "healthy lifespan potential" market is worth $1.2 trillion, with huge growth potential.
Space and Robotics: Unlocking New Productivity
- Reusable rockets: SpaceX will reduce launch costs from $15,600/kg in 2008 to below $1,000 in 2025, and is expected to reach $100 after Starship is deployed; Starlink will account for 66% of global satellites in orbit by 2025, and satellite communications revenue may reach $160 billion by 2035.
- Robotics: The global robotics market is projected to reach $26 trillion (with $13 trillion each in manufacturing and home services); humanoid robots are 200,000 times more complex than autonomous taxis, and Tesla's Optimus may achieve human-level task capabilities by 2028.
Energy and Autonomous Driving: Supporting Innovation and Mobility
- Distributed energy: The proportion of clean energy installations will increase by 2025, while the costs of solar energy and energy storage will decrease; by 2030, global electricity investment will reach $10 trillion, and energy storage capacity will need to increase 19 times to meet the needs of AI data centers.
- Autonomous driving: By 2030, the cost per Robotaxi may be $0.25 (only 1/10 of that of traditional ride-hailing), and the value of related companies is expected to reach $3.4 trillion, with technology platforms accounting for 98% of the value; autonomous driving logistics costs will drop significantly, and delivery revenue may reach $480 billion by 2030.
Risk Warnings and Future Outlook
Core risks in the field of innovation
- Uncertainty surrounding technological breakthroughs: The performance of some technologies (such as quantum computing) is improving more slowly than expected. Google has only doubled the number of qubits once in the past four years, and it is expected that it will be difficult to use them in key scenarios such as password cracking before 2040.
- Regulatory and competitive challenges: Innovative technologies may face strict regulations (such as cryptocurrencies and AI ethics), while intense industry competition means that companies may not be able to commercialize their technologies as scheduled.
- Macroeconomic and market fluctuations: Economic cycles, geopolitical factors and other factors may affect capital investment in innovation, resulting in slower-than-expected progress in technology implementation.
Future Outlook
ARK predicts that from 2025 to 2030, capital investment alone could contribute 1.9 percentage points to the average annual growth rate of global real GDP. If the synergistic effects of other innovations are combined, the actual growth rate may be more than 4 percentage points higher than the consensus expectation. Five major innovation platforms, including artificial intelligence, blockchain, and robotics, will provide structural growth momentum for the global economy. Participants who identify and plan ahead for these trends are expected to gain a competitive advantage in the race to "seize the future."
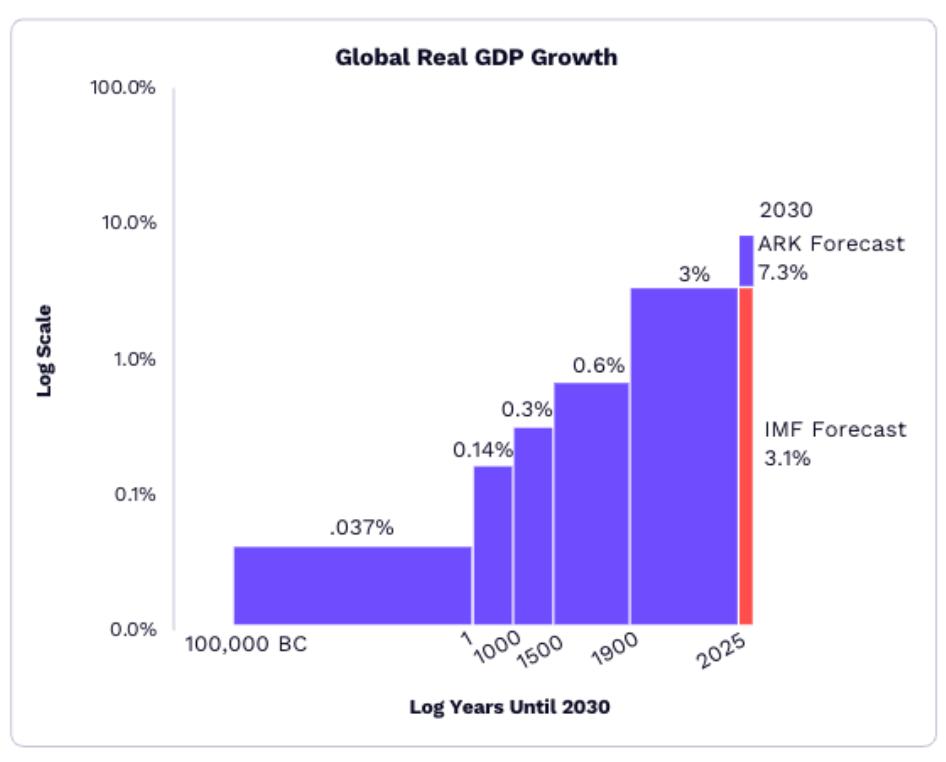
Global GDP growth forecast for 2025-2030
Note: All images in this report are for illustrative purposes only. Actual images must be replaced with legally authorized materials. Data and forecasts are based on ARK's internal analysis and public sources (such as the International Monetary Fund, the U.S. Bureau of Labor Statistics, SpaceX, etc.) and are current as of January 2026. They may change in the future due to factors such as technology, market, and policy.