

The Seeker price has entered a correction phase. After surging 200% immediately after its launch earlier this week, SKR has now dropped nearly 25% in the last 24 hours. Notably, the group of buyers driving this trend has also changed.
In our previous analysis, we showed how smart money absorbed the supply from the Airdrop and helped maintain the price. However, that situation is no longer the case. Smart money has started selling, the amount of SKR on exchanges has increased, while whales are quietly buying. This has caused the market to enter a stalemate, with the risk of a further 5% drop now being considered.
The sharp decline triggered a withdrawal of smart money.
The first signs appeared on January 24, 2024.
On the 1-hour chart, the Seeker price has fallen below the Volume Weighted Average Price (VWAP) line, which is the Medium buying price of traders based on volume.
When the price is above VWAP, the buyers are in control. When the price falls below it, it usually signals that investors are redistributing Token rather than a healthy correction.
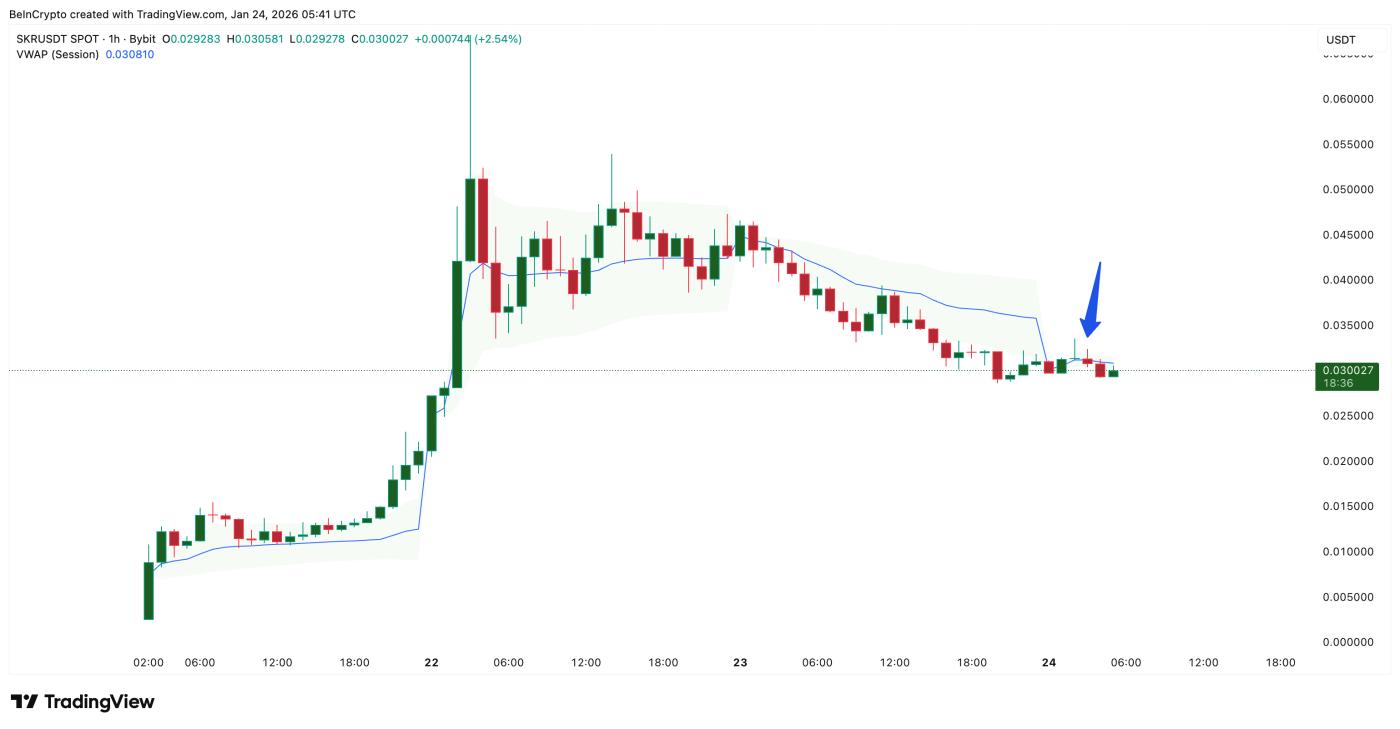 Seeker loses VWAP: TradingView
Want to stay up-to-date on more Token news like this? Sign up for editor Harsh Notariya's Daily Crypto Newsletter here .
The price drop from VWAP coincides with the action of smart money .
Over the past 24 hours, smart money wallets have reduced their SKR holdings by 56.48%. According to on-chain data, this group sold approximately 8.5 million SKR in a single day. This indicates a fairly decisive move to exit positions after the short-term structure was broken.
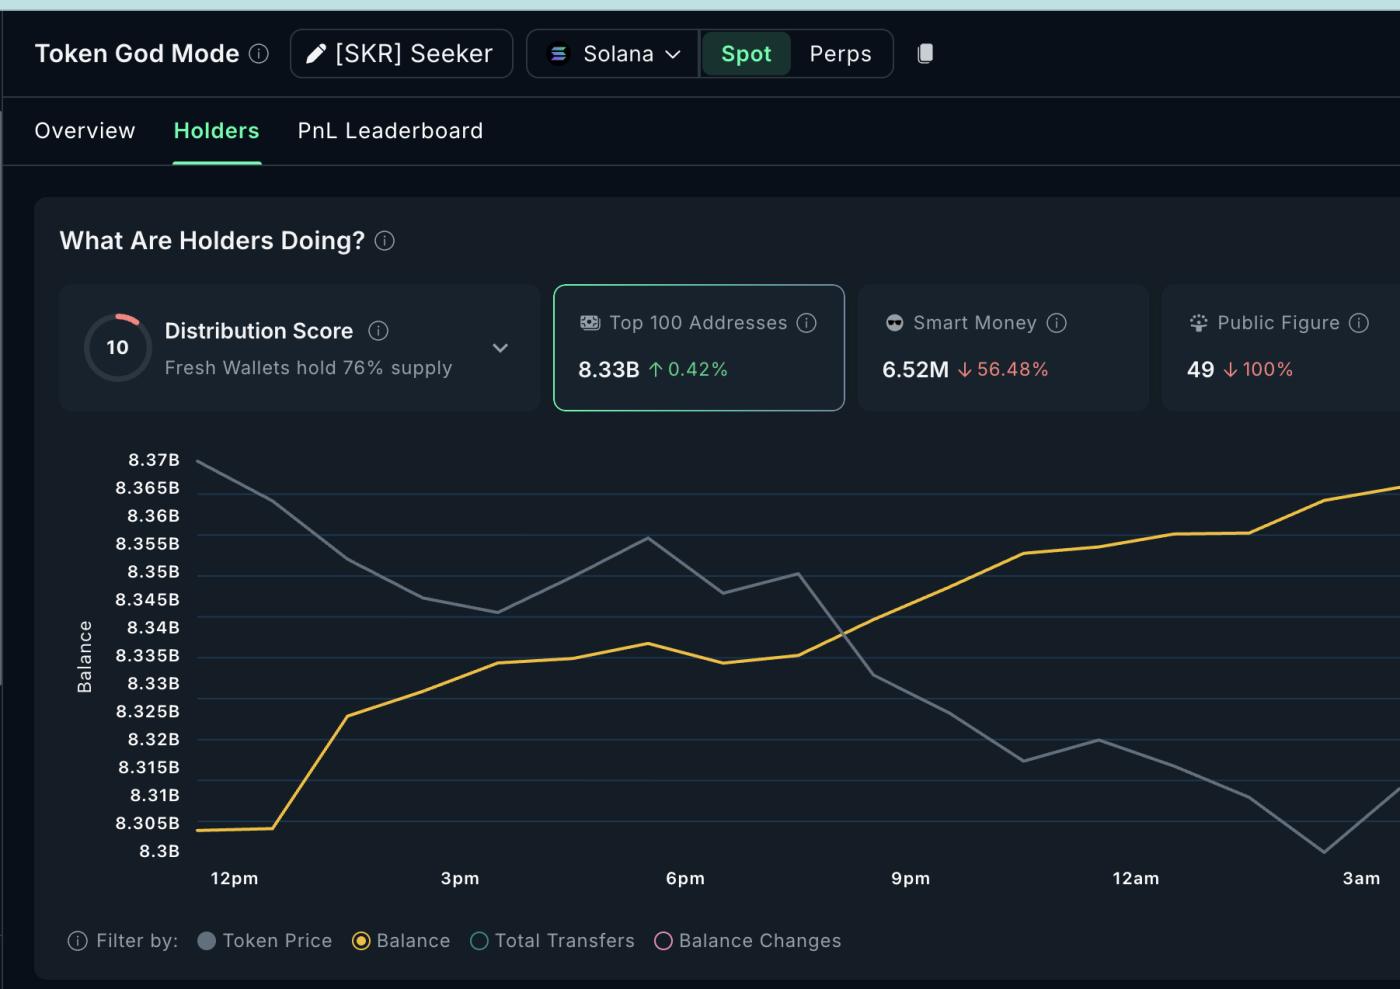 Smart money is selling well: Nansen
This is crucial because smart money is often the first to act. When they withdraw after the price breaks the VWAP, it usually signals that the short-term uptrend is no longer attractive given the current risk/reward ratio.
That's why Seeker's attempts to recover have been quite weak, even when the price tries to stabilize. But smart money selling off is only part of the story.
Whales buy when a divergence signal indicates accumulation.
While savvy traders are withdrawing from the market, whales are choosing the opposite direction.
From January 23rd to January 24th, 2024, the Seeker price continued to fall, but the Money Flow Index (MFI) rose during the same period. The MFI tracks buying and selling pressure based on both price and volume. When the price falls and the MFI rises, it often indicates underlying accumulation in the market.
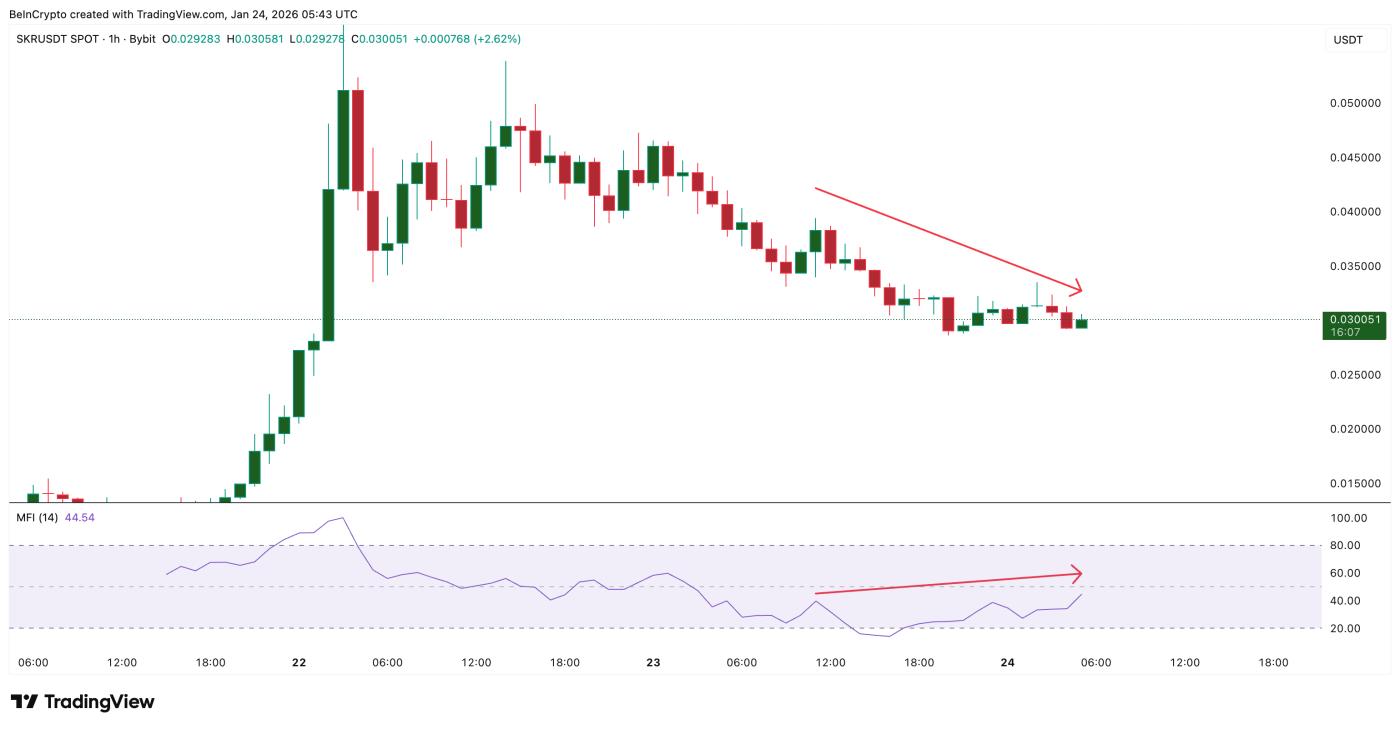 Investors take advantage of the dip: TradingView
This difference helps us understand whales better.
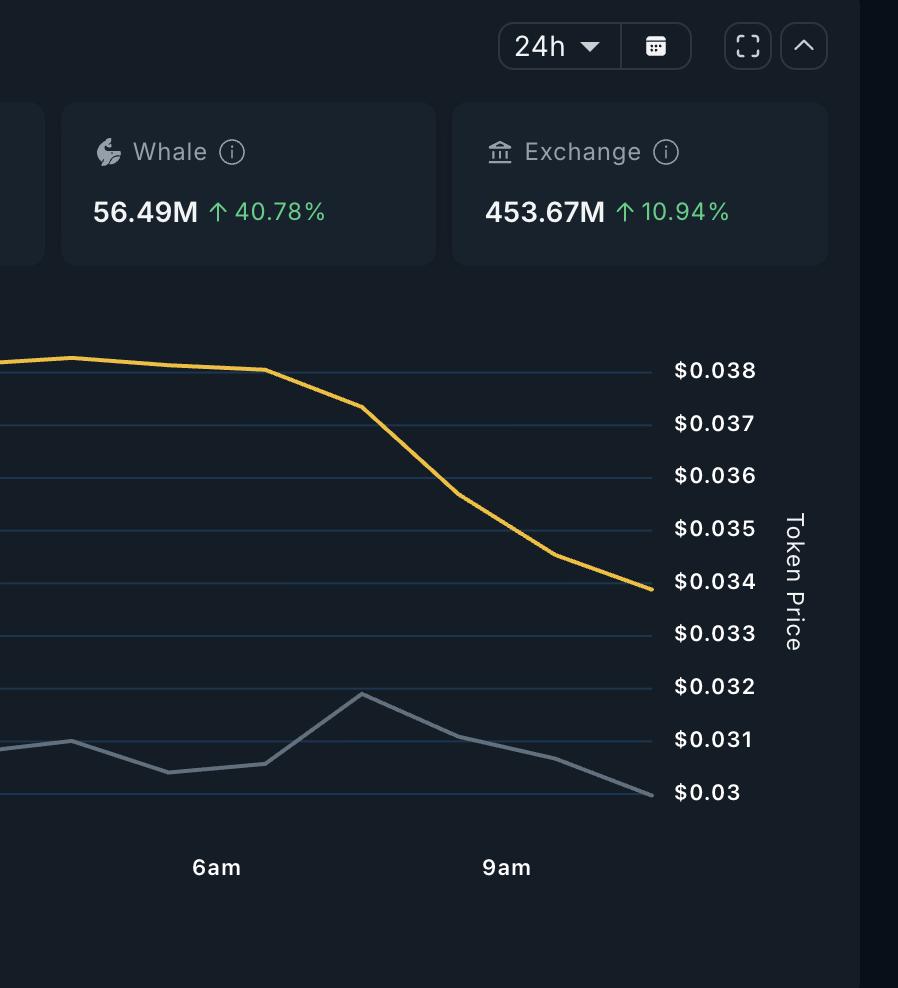
Over the past 24 hours, the amount of SKR held by whales has increased by 40.78%, bringing the total to 56.49 million SKR. This means that whales have purchased approximately 16.3 million additional SKR during the price correction period.
Unlike smart money, whales don't focus on short-term structures but choose to buy when the market is weak, which aligns with the Dip -buying signals of the MFI.
 SKR whale: Nansen
This reveals two distinct extremes: smart money withdraws when the price fails to hold its VWAP, while whales aggressively buy after momentum weakens and Dip -buying signals appear.
However, whale accumulation does not necessarily mean a sharp price increase immediately. Whales may absorb the supply, but if selling pressure from external sources continues to increase, prices could still fall significantly. Therefore, the behavior of the exchange market needs further attention.
The inflow of money into the exchange keeps the downside risk for Seeker at a high level.
Despite whale buying, supply pressure remains high.
The amount of SKR on exchanges has surged in the last 24 hours, increasing by 10.94% to 453.67 million SKR. This means approximately 44.8 million SKR were transferred to exchanges during this period. The withdrawal of smart money contributed to this increase, while profit-taking by retail investors added further selling pressure.
This shift in supply is clearly reflected in the volume data.
On the four-hour chart, the On-Balance Volume (OBV) indicator tended to decrease even when prices remained high between January 21, 2024 and January 24, 2024. OBV indicates whether volume confirms the price trend. When price holds steady but OBV decreases, it suggests that price rallies are driven by declining demand, rather than strong accumulation.
This is why whale buying hasn't yet led to a sustainable price increase. In particular, the sharp increase inflows into the exchange has far exceeded the amount accumulated by whales.
Currently, the technical risks are quite clear. On the 4-hour timeframe, the $0.028 level is a crucial support level, approximately 5% lower than at the time of writing. If the price closes below this level, and the OBV trendline is also broken, it would indicate that selling pressure is outweighing accumulation, leading to a potential sharp decline to the $0.0120 region.
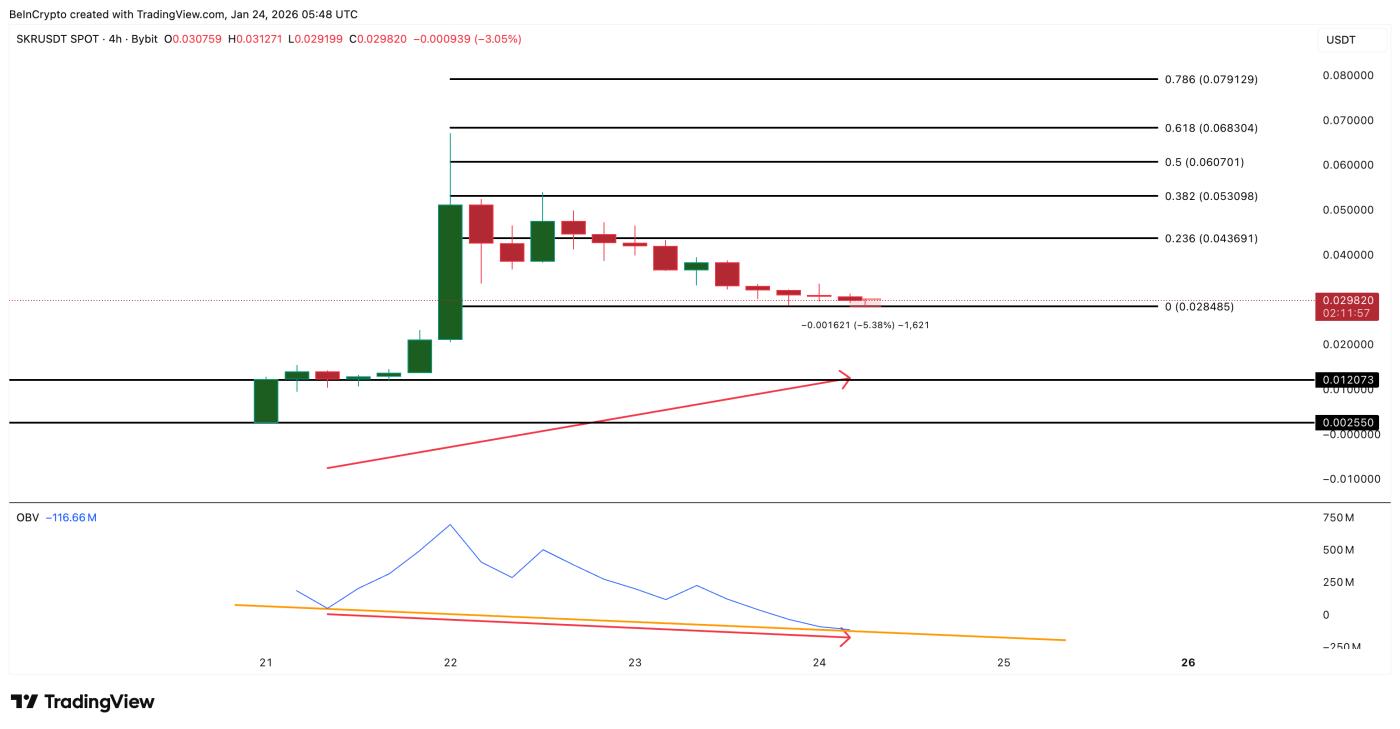 Seeker Price Analysis: TradingView
On the upside, the Seeker needs to break above $0.043 to regain confidence. Additionally, the $0.053 level remains the most important resistance, as supply has previously concentrated there. Unless volume shows a positive shift, reaching these levels will be difficult.
The current market structure tells a simple story. Smart money is staying on the sidelines. Whales continue to accumulate. More and more Token are being transferred to exchanges. As long as this imbalance persists, the Seeker price remains at risk of correction.


