
By Lin Oshitani (Nethermind Research). Thanks to Matteo, Ahmad, Michal, Conor, Gustavo, Daniel, David, Yuewang, and Ignacio for the discussions and/or reviews, and thanks to Musa for the discussions and for helping run the benchmarks.
This work is funded by Taiko as part of the strategic Taiko<>Nethermind partnership.
TL;DR
What is each opcode’s isolated proving cost? To answer this question, we benchmark the per-gas proving time of individual EVM opcodes and precompiles in a multi-GPU setup, building on the EF’s zkEVM benchmarking tooling and the imapp team’s Gas Cost Estimator marginal method. We also evaluate whether zk cycles are a meaningful proxy for actual proving time using actual proving-time measurements.
Introduction
As ZK rollups move toward further decentralization, both in terms of rollup stages and in the decentralization of sequencers and provers, mitigating prover-killer blocks becomes critical for their security and economic sustainability. These adversarial blocks are constructed to maximize proving time while remaining within the EVM gas limit, creating potential denial-of-service vectors or rendering proving economically unviable. Moreover, as Ethereum L1 itself moves toward ZK-based scaling, it will face the same challenge.
Traditional EVM gas metering accounts only for execution costs such as CPU time, storage access, and state growth, but it fails to capture proving costs altogether. As a result, ZK rollups require additional safeguards. A leading approach is to explicitly meter proving costs and enforce block limits based on this metric. Building such mechanisms, however, requires accurate models of how individual operations contribute to overall proving time, precise enough to prevent adversarial blocks without overly harming usability.
To model proving time, we focus on the following core question: how does each EVM opcode or precompile individually contribute to total proving time? Concretely, if we add a given opcode or precompile that consumes an additional X gas, holding all else equal, how much additional proving time does it add? From this, we estimate the marginal proving time per unit of gas for each opcode or precompile.
Prior zkEVM benchmarking efforts by the Ethereum Foundation provide valuable end-to-end measurements by constructing blocks densely filled with a specific opcode or precompile via a loop. This approach works well for identifying and analyzing operations with very high proving cost, where the cost of the target operation dominates overall proving time. However, because these benchmarks do not explicitly separate per-operation cost from the surrounding overhead (e.g., pushing arguments to the stack, popping return values, and control flow), they are less informative for lower-cost operations, where the surrounding code can significantly affect the measurement. As a result, they are insufficient for building a comprehensive model of proving time across all opcodes and precompiles.
To overcome this limitation, we adopt the marginal measurement approach from the imapp team’s Gas Cost Estimator project, which isolates the contribution of each opcode or precompile from surrounding overhead by creating test cases that vary only the target operation count while holding all other execution context constant. We then fit a linear regression and take the slope to estimate the proving time per unit of gas.
Our benchmark implementation is built on and made possible by the foundation of the Ethereum Foundation’s zkEVM Benchmarking Workload tooling. We created a suite of custom execution-spec tests following the gas-cost-estimator’s marginal methodology, with extensions to better fit the ZK proving context (e.g., an amplification method to prevent fixed ZK proving setup overhead from dominating the measurements). These fixtures were then executed using a custom fork of EF’s benchmarking tooling with multi-GPU support added for SP1.
Furthermore, we use the benchmarking results to evaluate whether zk cycles are a meaningful proxy for actual proving time using direct proving-time measurements. We find that the relationship between proving time and zk cycles varies widely across opcodes and precompiles, limiting the accuracy of zk cycle-based estimates.
Key Results
We present the results first; readers interested in assumptions and experimental setup can find details in the Methodology section.
In this section, we present the key results of the benchmarks, which were run in the following environment (for more details on the setup, see the methodology section below).:
Prover: sp1-v5.2.3 (with sp1-cluster) and risc0-v3.0.4 (with
RISC0_KECCAK_PO2=15flag to prevent provers from crashing)GPUs: 4 x NVIDIA GeForce RTX 4090
Execution Client: reth-v1.9.3
Note: Proving time depends heavily on the run configuration (e.g., prover flags and configurations, hardware/runtime settings, the condition of GPUs at the time of proving, etc.). As such, these results should be interpreted as configuration-specific measurements.
Note: These benchmarks were run without block header validation. Local testing suggests validation has little effect on most opcodes; LOG-related opcodes see a 4–5× increase, though they remain relatively cheap to prove.
Proving Time per Gas
Below is the “proving time per gas” for each opcode/precompile in both SP1 and RISC0. This metric represents the additional proving time incurred by using 1 additional gas unit for a specific opcode or precompile. The R^2 value indicates the fit of the linear regression.
More detailed data (e.g., regression plot for each opcode) is hosted here: SP1, RISC0
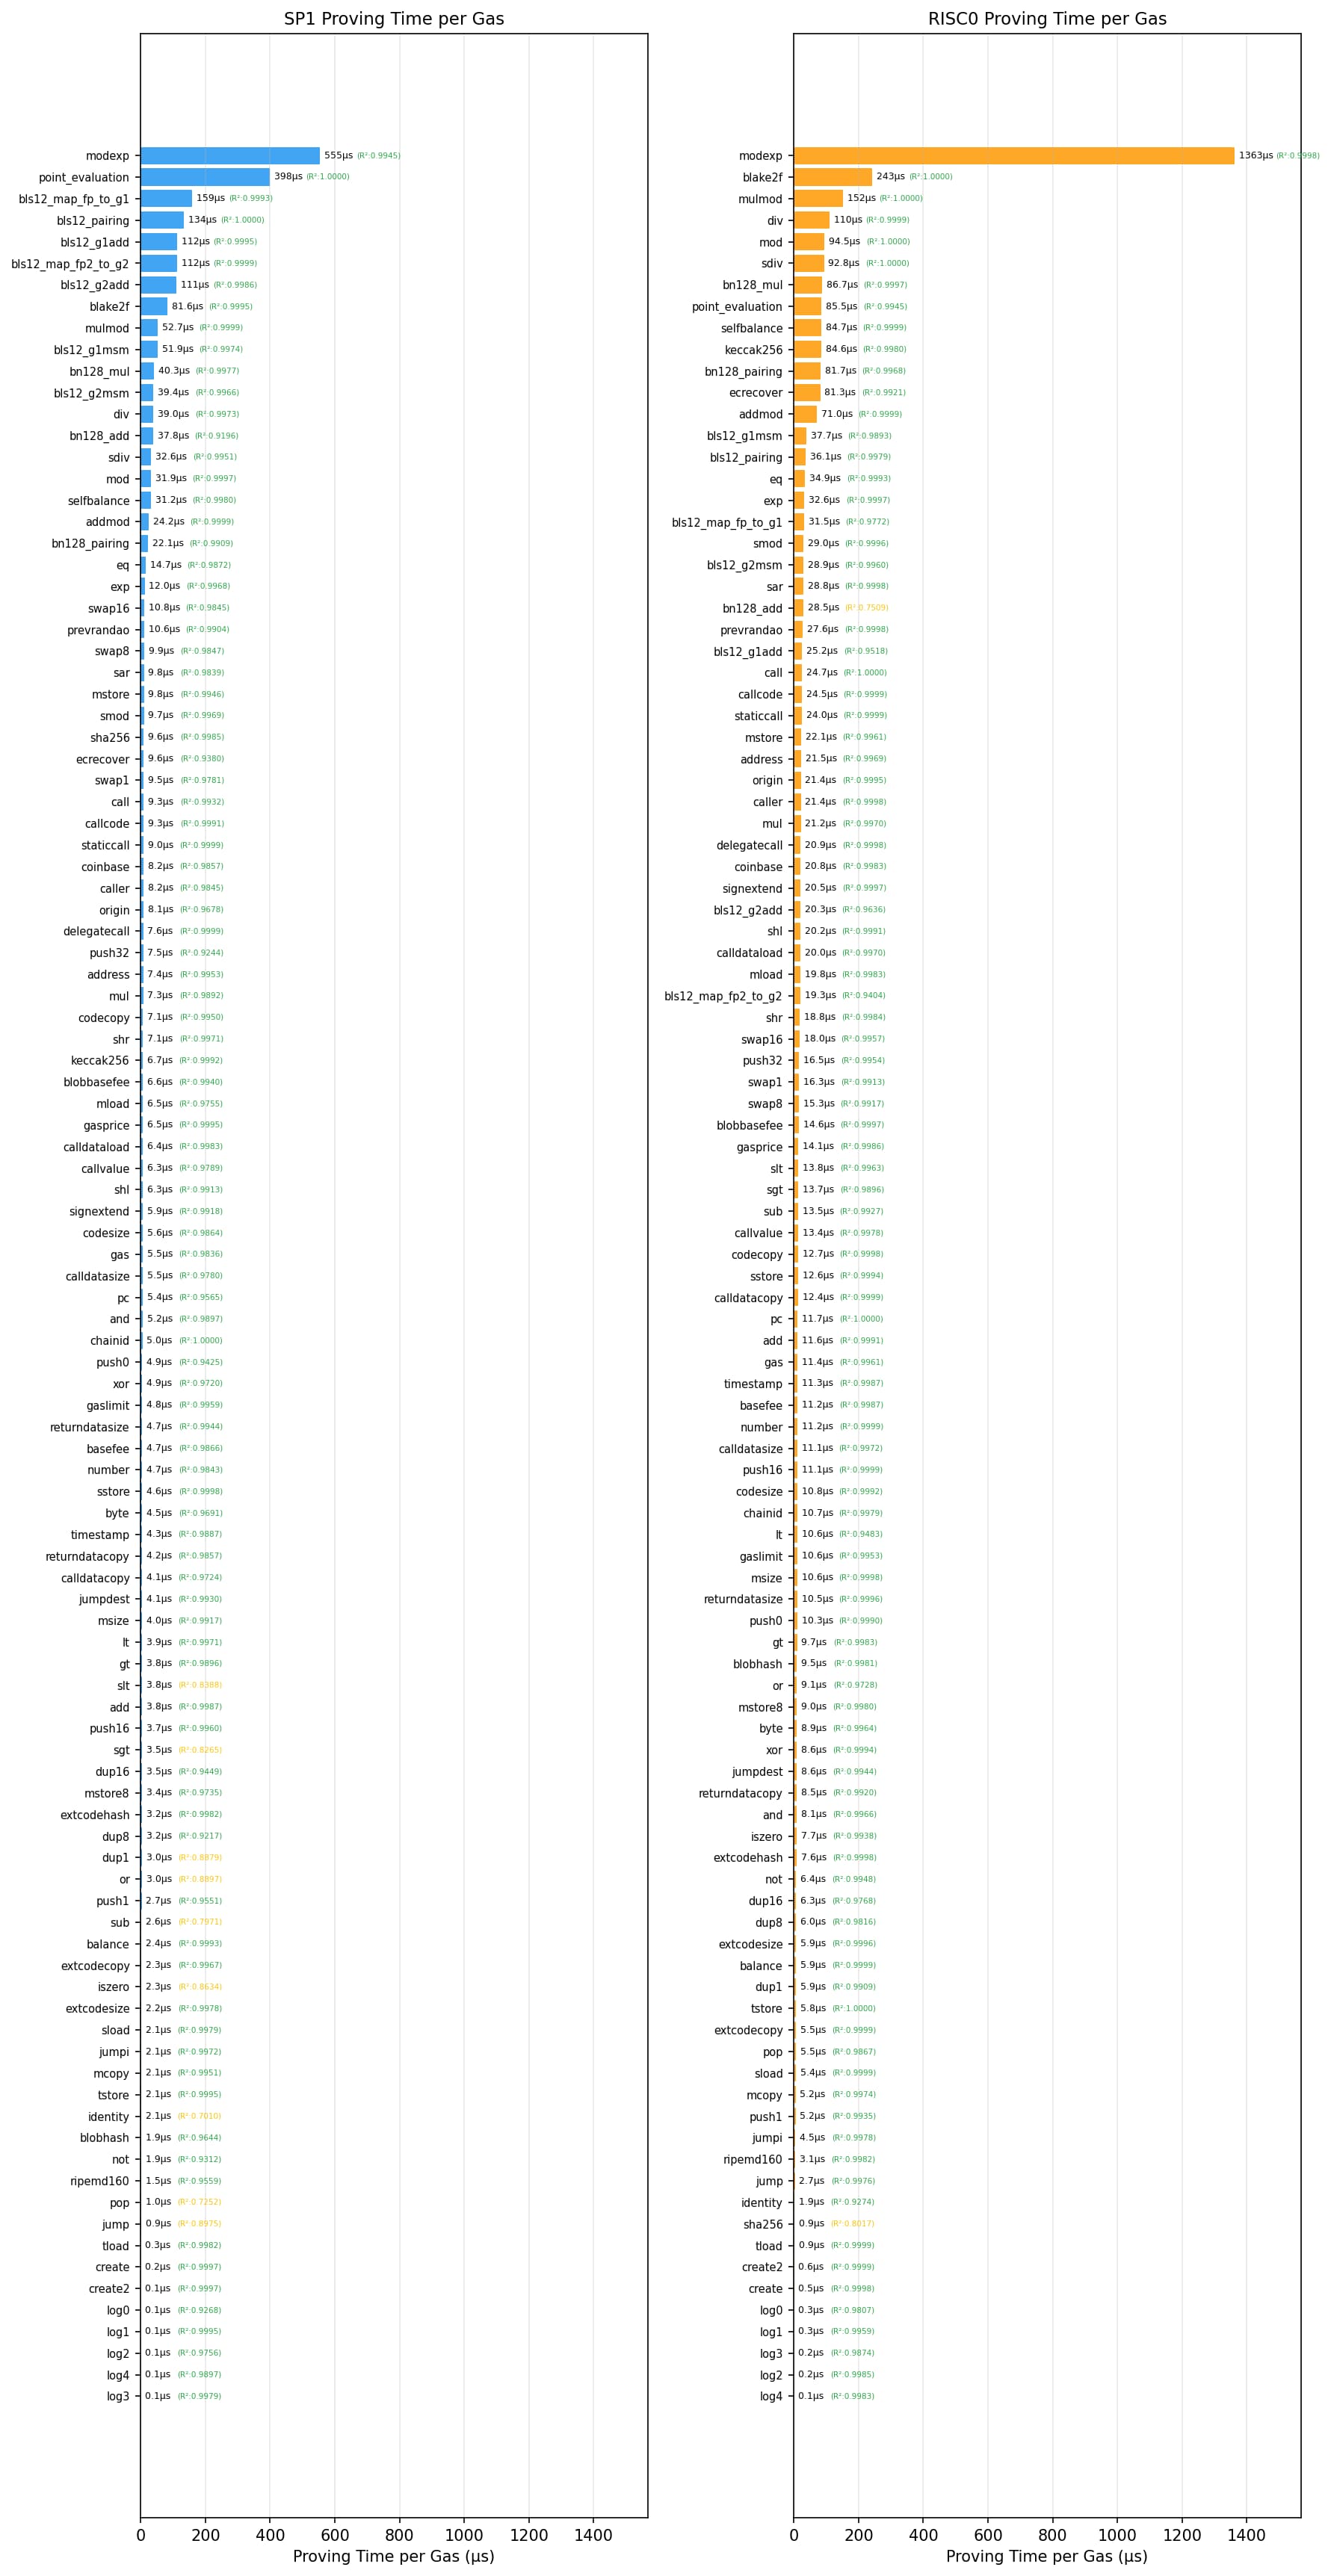
Some preliminary observations:
Cryptographic precompiles (e.g.,
modexp,point_evaluation) in general have high per-gas proving time.Mod/division-related opcodes (
mulmod,mod,div,sdiv) have relatively high proving time, as well asselfbalance.Opcodes around log/create (
log1,log2,log3,create,create2) have the fastest per-gas proving time for both SP1 and RISC0, likely because their gas costs are dominated by data and storage rather than computation.In general, the relative ranking of opcodes by proving time is similar between RISC0 and SP1, but there are several notable exceptions (e.g.,
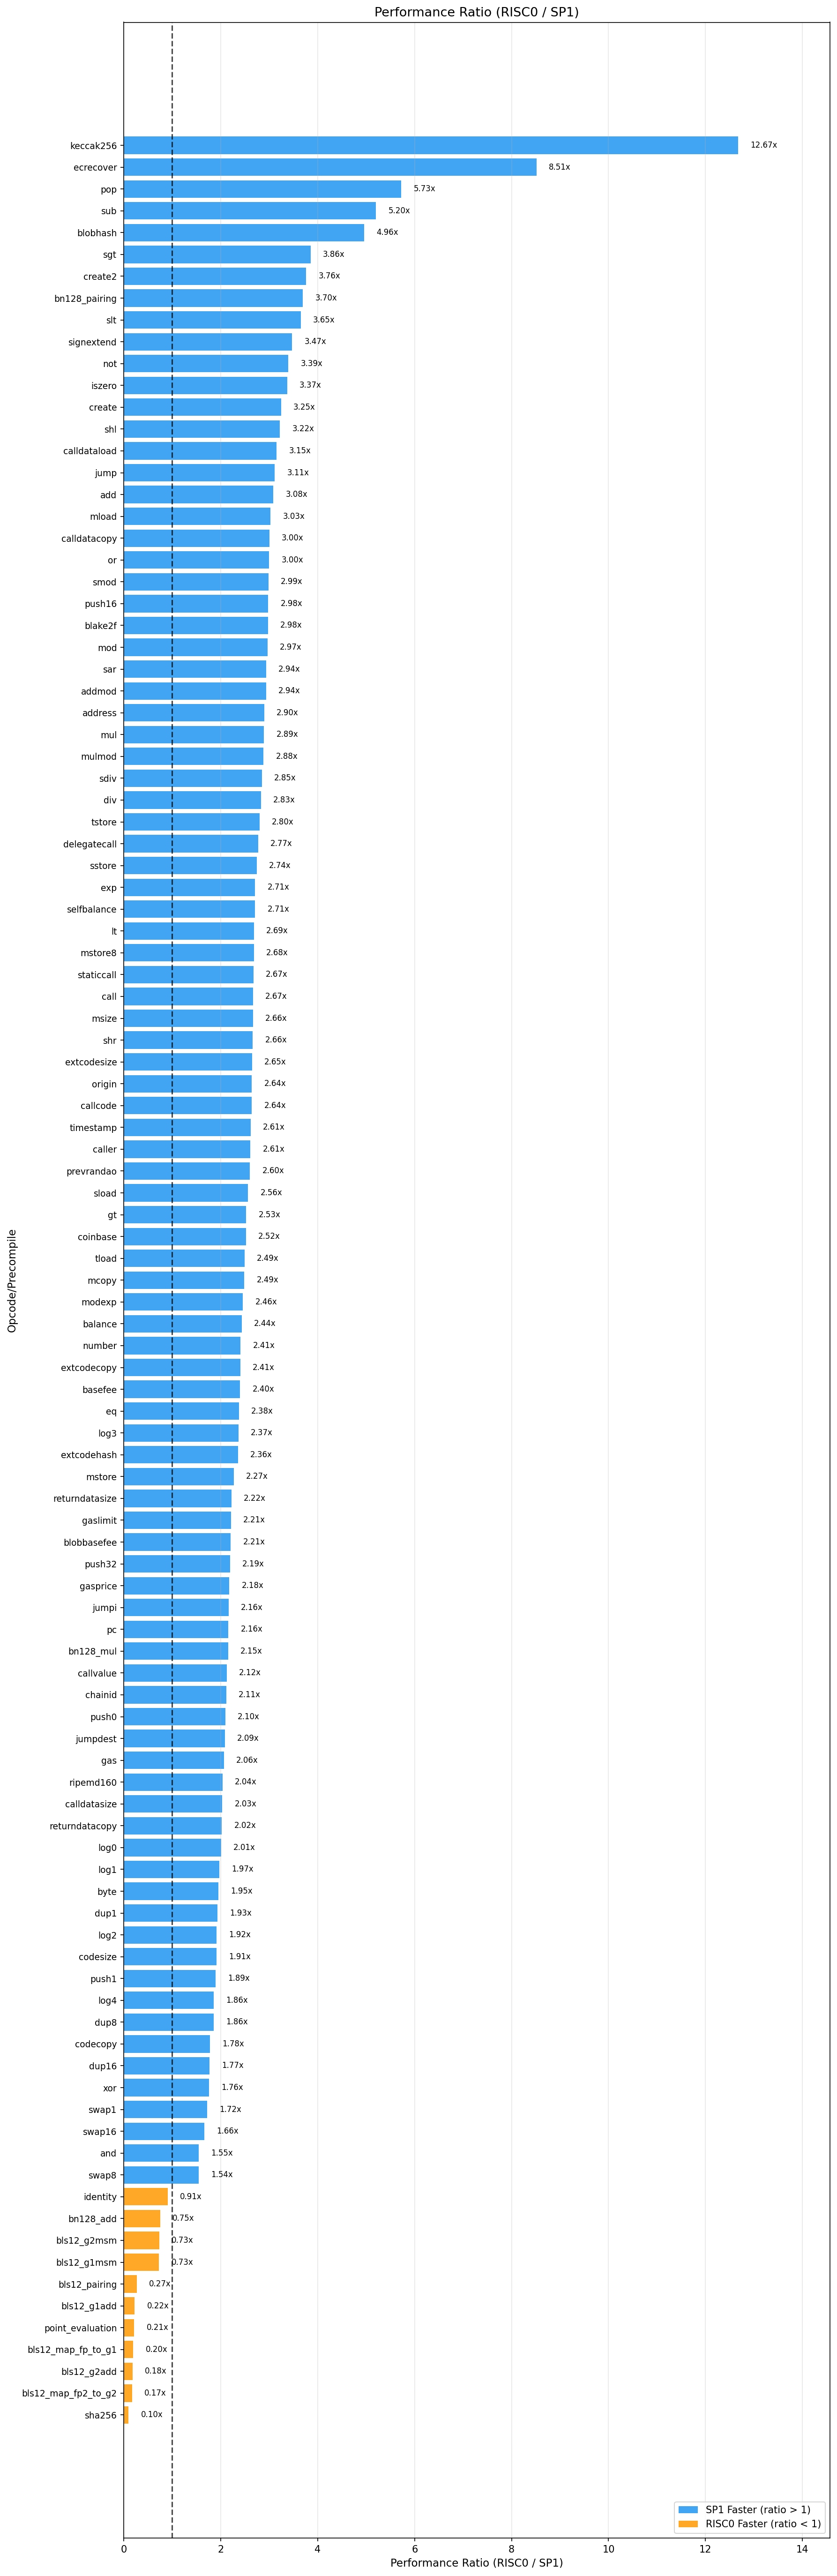
keccak256is ~12x slower in RISC0,sha256is ~10x times faster in RISC0). This is likely due to zkvm precompiles of certain opcodes/precompiles existing in one but not the other (for more comparison between the provers, see the chart in Appendix: SP1/RISC0 Comparison ).
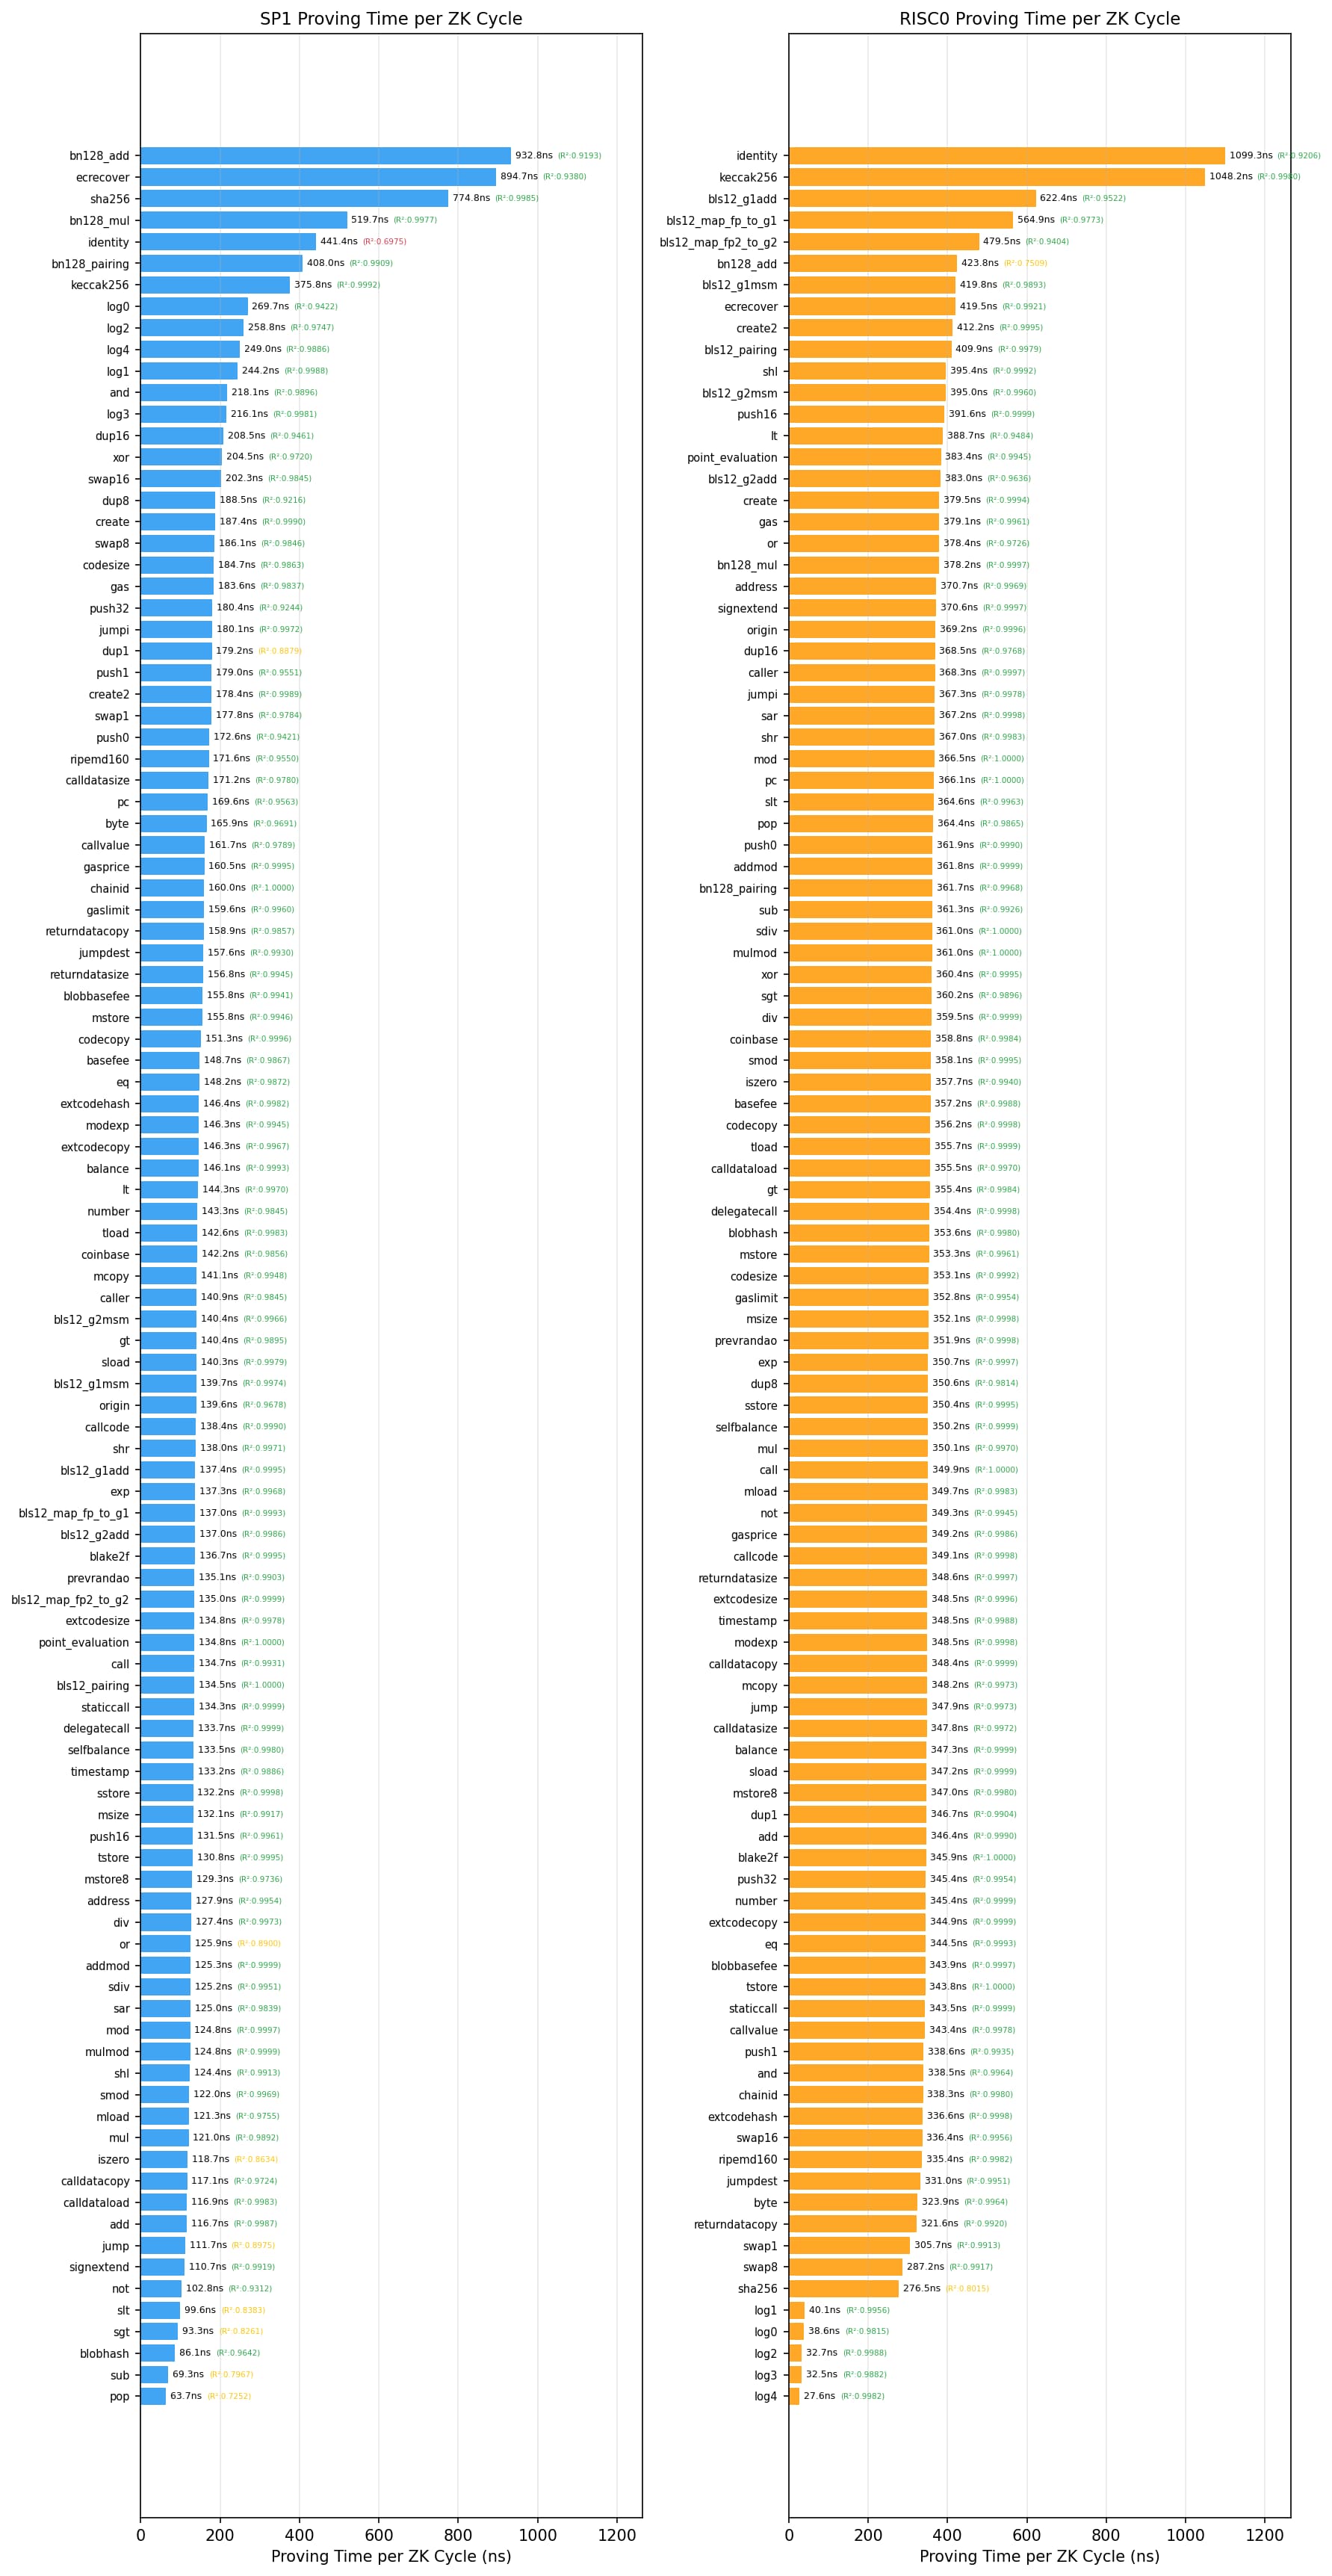
Proving Time per ZK Cycle
ZKVMs have the concept of ZK cycles, which represent the number of computational steps the ZKVM executes to prove a program, analogous to CPU cycles in traditional computing. A natural question is: how good a proxy are ZK cycles for actual proving time? If ZK cycles correlate linearly with proving time across all operations, they could serve as a simpler metric for ZK gas metering. However, if the relationship is non-linear or varies significantly across operation types, then proving time must be measured directly for accurate DoS protection.
To answer this question, we fit a linear regression of proving time against zk cycles for each opcode/precompile. Below are the findings.
Within a given operation, the relationship is strongly linear (high R^2): doubling cycles roughly doubles proving time. But the conversion rate from cycles to time is not universal—it depends heavily on the operation.
The bar chart below shows this per-operation “time per zk cycle.” If cycles were a good proxy, all bars would largely align; instead, they spread widely—likely because some operations are implemented in different circuits (e.g., custom zkVM precompiles). For example, in SP1, bn128_add takes ~930 ns per zk cycle while pop takes only ~63 ns, a ~15× gap. This suggests zk cycles alone are insufficient for accurate metering of proving time. Mitigations include:
Meter using measured proving time (as done in this post)
Improve cycle accounting to better reflect proving time (e.g., improve zk cycle conversion between different circuits)
Use ZK cycles as a proving time proxy, but be conservative, i.e., use numbers from the slowest time per ZK cycle operation.
Methodology
We adopt a marginal-cost approach, originally developed by the imapp team for L1 gas repricing as part of the Gas Cost Estimator project, to isolate the proving cost of individual operations.
First, we create 4-7 blocks for each opcode/precompile with varying operation counts (0, N, 2N, 3N, etc.), while maintaining constant overhead by keeping all other factors identical across variants—stack setup, memory initialization, control flow, and cleanup operations.
The table below is an example bytecode structure for the ADD opcode. Notice that each variant has exactly 20 PUSHes and 10 POPs—Only the ADD count varies.
| op_count | Setup | Main | Cleanup |
|---|---|---|---|
| 0 | PUSH×20 | — | POP×10 |
| 3 | PUSH×20 | ADD + (POP + ADD)×2 | POP×8 |
| 5 | PUSH×20 | ADD + (POP + ADD)×4 | POP×6 |
| 10 | PUSH×20 | ADD + (POP + ADD)×9 | POP×1 |
Next, we execute each block variant and record the total proving time and gas consumed by the whole block. Then, we fit proving_time = α × gas_used + β across all variants. Here is an example for the ADD opcode in SP1:
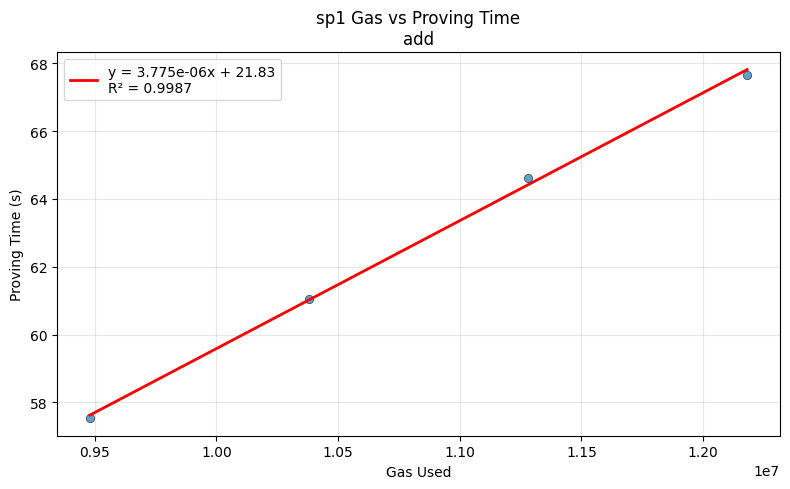
The slope α represents the marginal proving time per unit of gas for the opcode or precompile under consideration. Because only the target operation count varies while all other execution context is held constant, α isolates the contribution of that operation. In the example above, we have α = 3.78µs, implying a per-gas proving time of 3.78µs for ADD in SP1 with 4 GPUs.
Opcode/Precompile Arguments
For opcode/precompile arguments, we use fixed inputs chosen to be representative and, where applicable, “worst‑case” on a best‑effort basis. Our choices are guided by known worst-case patterns from existing benchmarking suites. Using worst-case inputs helps avoid inadvertently measuring optimized fast paths that occur only for special inputs (e.g., all-zero buffers).
Our working assumption is that proving time scales linearly with gas consumption for a given operation, not only across different operation counts, but also across different argument choices within the same operation (i.e., if you double the gas, you double the proving time). This assumes that (1) gas accurately reflects computational complexity, and (2) proving time scales proportionally with that complexity.
In practice, this assumption can fail, e.g., because gas does not accurately reflect computation complexity or because ZKVMs exhibit different behavior for certain arguments. Our measurements should therefore be interpreted as specific to the tested inputs and only as approximations for other inputs. A more fine-grained analysis of argument-dependent proving costs, examining how proving time varies across the whole argument space for each operation, is left for future work.
Finally, for operations like LOG and CREATE, where gas is primarily driven by data size and memory expansion rather than computation, we use standard arguments (e.g., 32-byte payloads) and not worst-case arguments in terms of gas. Using large payloads would inflate gas costs without meaningfully increasing proving work, underestimating the computational proving overhead per gas unit.
Integration with EF Benchmarking Tooling
Our benchmarking pipeline builds on the Ethereum Foundation’s zkEVM Benchmarking Workload, and we introduce two key extensions:
Custom EEST marginal tests/fixtures: We add custom execution-spec-tests (EEST) that follow the marginal methodology.
Multi-GPU SP1 support: We extend the EF’s ZKEVM benchmark tooling to support SP1 cluster execution, allowing the same workload to be proven using 4 GPUs.
With these additions, we generate EEST fixtures, convert them to zkEVM witness inputs using the EF tooling, run proving through the EF host runner (SP1 on 4 GPUs or RISC0), and then post-process the resulting metrics (proving time, gas, zk cycles) to fit regressions and extract marginal proving time per gas (or per zk cycles).
Applications & Next Steps
Here are some potential practical applications of these measurements:
ZK-aware block metering for ZK rollups: The per-gas proving-time measurements can be used to directly meter and cap the proving cost of blocks. Concretely, one can define a “ZK Gas” metric by weighting the gas consumed by each opcode/precompile with a multiplier derived from its measured proving-time-per-gas. By capping the total ZK Gas per block, the protocol can cap worst-case proving time and mitigate prover-killer blocks.
Guidance for zkVM implementers: The per-operation breakdown highlights which opcodes/precompiles need improvements, helping zkVM teams prioritize optimizations (e.g., specialized circuits). It also provides a concrete signal for improving ZK cycle accounting so that the ZK cycle number tracks proving time more uniformly across different circuit paths.
Guidance for client implementers: Client teams can use these measurements to identify ZK-unfriendly hotspots and optimize specific opcode/precompile implementations or execution patterns to reduce proving overhead.
For the next steps of the project:
Argument-dependent benchmarking: Extend the methodology to sweep across all inputs.
Continuous performance monitoring: Automate the pipeline end-to-end (fixture generation → witness generation → proving → regression → reporting) so per-opcode/precompile zkVM/client performance can be tracked over time.
Multi-dimensional metering: Investigate how these measurements can be incorporated into multi-dimensional gas metering.
Links
Detailed data of our benchmarks (e.g., regression plot for each opcode/precompile):
Custom execution-spec tests used for the benchmarks: https://github.com/linoscope/execution-specs/pull/1/changes
PRs for SP1 cluster support in EF tooling:
Nice talk about EF’s ZK Benchmark Tooling by Ignacio: https://youtu.be/D2TpmD62tjQ?si=D4mzEagb2MXX1QXy&t=1510
Nice talk about the marginal approach by Jacek: https://www.youtube.com/watch?v=KmaFpyV9jvM
Appendix: SP1/RISC0 Comparison
The graph below shows the (RISC0 proving_time_per_gas) / (SP1 proving_time_per_gas), where proving_time_per_gas is the regression slope for the opcode for each prover. The reference line at 1.0× means equal performance. Values > 1.0× indicate RISC0 is slower (takes more proving time per gas than SP1 for that opcode/precompile), and values < 1.0× indicate SP1 is slower.