

The author provides a detailed analysis of how retail traders' irrational preference for "unpopular outcomes" and "certain outcomes" contributes to the creation of the "optimism tax." This is not only a hard-core analysis of market microstructure, but also a guide to avoid pitfalls that every market participant should be wary of.
Article author and translator: Jonathan Becker, SpecialistXBT
Article source: BlockBeats
Editor's Note: The author provides a detailed analysis of how the irrational preference of retail traders between "unpopular outcomes" and "certain outcomes" contributes to the creation of an "optimism tax." This is not only a hard-core analysis of the market's microstructure, but also a guide to avoid pitfalls that every market participant should be wary of.
The following is the original text:
The slot machines on the Las Vegas Strip return approximately 93 cents for every dollar wagered. This is widely considered one of the worst-paying games in gambling. However, on Kalshi, a prediction market regulated by the CFTC (Commodity Futures Trading Commission), traders are betting huge sums on "longshot" contracts with historically low returns of just 43 cents per dollar. Thousands of participants are voluntarily accepting much lower expected values than casino slot machines, simply to bet on their beliefs.
The efficient market hypothesis posits that asset prices should perfectly aggregate all available information. Theoretically, prediction markets provide the purest test of this theory. Unlike stocks, the intrinsic value of prediction markets is unambiguous: a contract either pays $1 or nothing. A price of 5 cents should precisely imply a 5% probability.
To test this effectiveness, we analyzed 72.1 million trades covering $18.26 billion in trading volume. Our findings suggest that the accuracy of the group relies less on rational actors and more on a mechanism of “harvesting errors.” We document a systematic wealth transfer: impulsive “takers” pay a structural premium for affirmative “YES” outcomes, while “makers” capture an “optimism tax” simply by selling contracts to this biased flow of funds. This effect is strongest in high-participation categories such as sports and entertainment, while in low-participation categories such as finance, the market is close to perfect efficiency.
This article contributes to
This article makes three contributions.
First, it confirms the existence of a "longshot bias" on Kalshi and quantifies its magnitude at different price levels.
Second, it breaks down returns by market role, revealing a continuous transfer of wealth from takers to placers driven by asymmetric order flows.
Third, it identifies a "YES/NO asymmetry," where order takers disproportionately favor affirmative bets on high-risk (low-probability prices), thus exacerbating their losses.
Prediction Markets and Kalshi
Prediction markets are exchanges where participants trade binary contracts for real-world outcomes. These contracts settle for either $1 or $0, with prices ranging from 1 to 99 cents, serving as a proxy for probability. Unlike the stock market, prediction markets are strictly zero-sum games: every dollar gained corresponds to exactly one dollar lost.
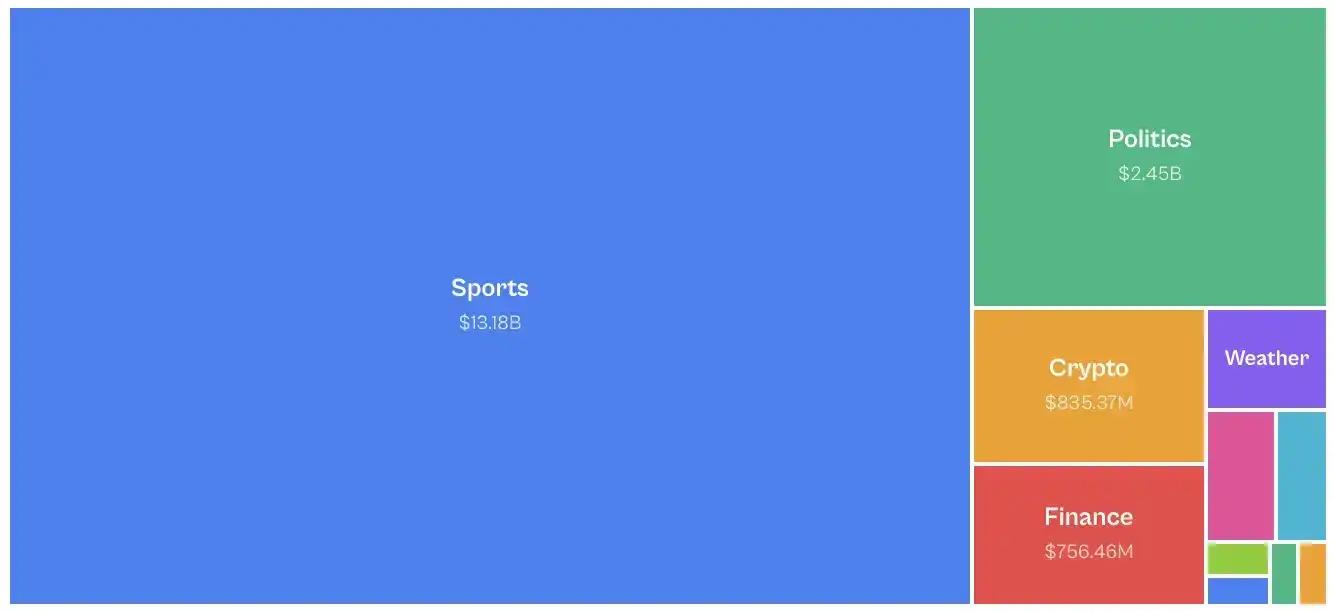
Launched in 2021, Kalshi was the first CFTC-regulated forecasting market in the United States. Initially focusing on economic and weather data, the platform remained a niche player until 2024. After legally overcoming the CFTC and securing the right to list political contracts, the 2024 election cycle triggered explosive growth. The sports market, introduced in 2025, currently dominates trading activity. Trading volume is extremely unevenly distributed across categories: sports account for 72% of nominal trading volume, followed by politics (13%) and cryptocurrencies (5%).
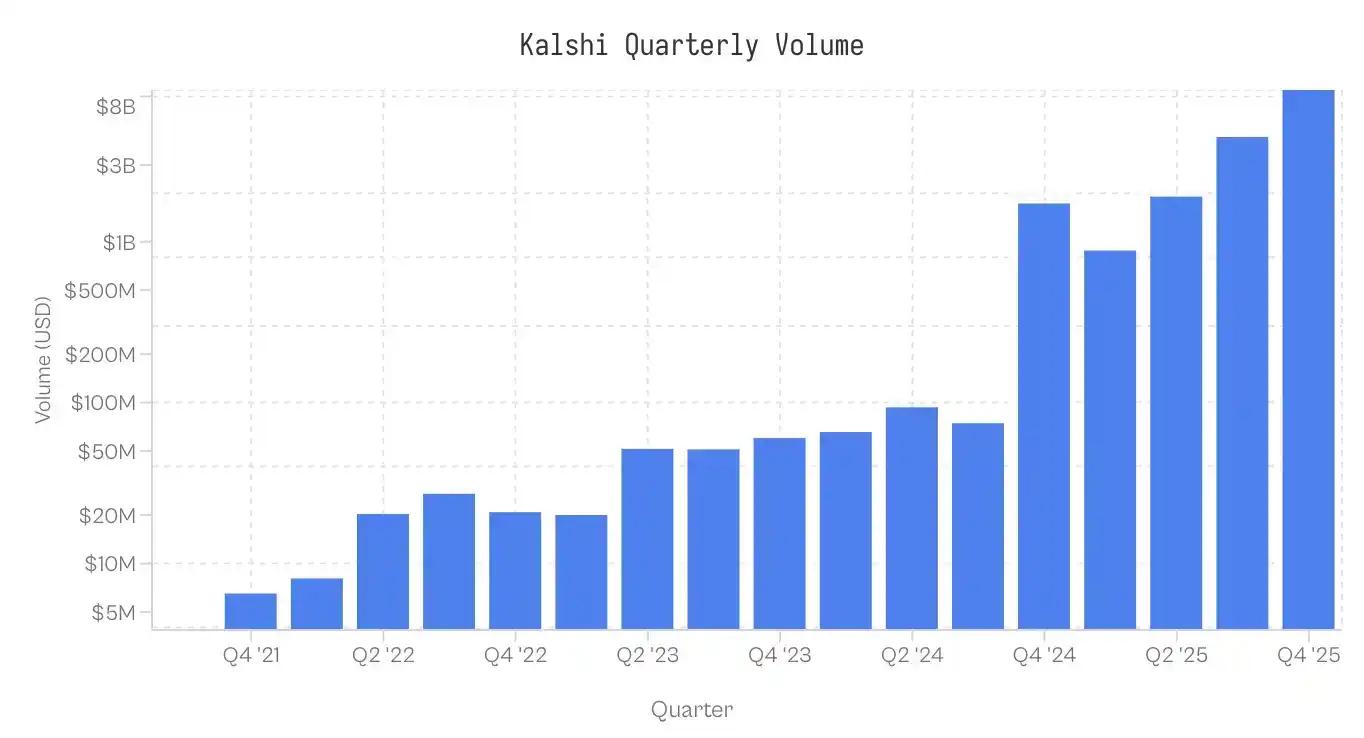
Note: Data collection ended at 17:00 ET on November 25, 2025; data for the fourth quarter of 2025 is incomplete.
Data and Methodology
The dataset contains 7.68 million markets and 72.1 million transactions. Each transaction records the execution price (1-99 cents), the taker (yes/no), the number of contracts, and the timestamp.
Role Assignment: Each transaction identifies a liquidity consumer (taker). Order placers take the opposite position. If taker_side = yes and the price is 10 cents, it means the taker buys YES at 10 cents; the order placer buys NO at 90 cents.
Cost Basis (Cb): To compare the asymmetry between YES and NO contracts, we standardize all trades by risk capital. For a standard YES trade of 5 cents, Cb = 5. For a NO trade of 5 cents, Cb = 5. Unless otherwise stated, "price" as used herein refers to this cost basis.
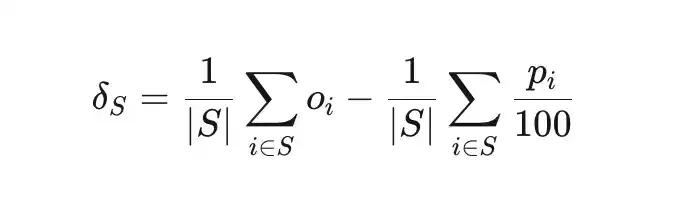
Mispricing (δS) measures the deviation between the actual win rate and the implied probability of a set of trades S.
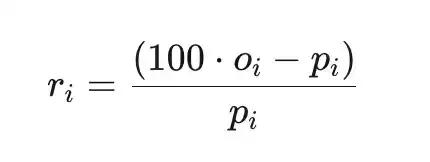
Total excess return (ri) is the return relative to cost (before platform fees), where pi is the price in cents and oi∈{0,1} is the result.
sample
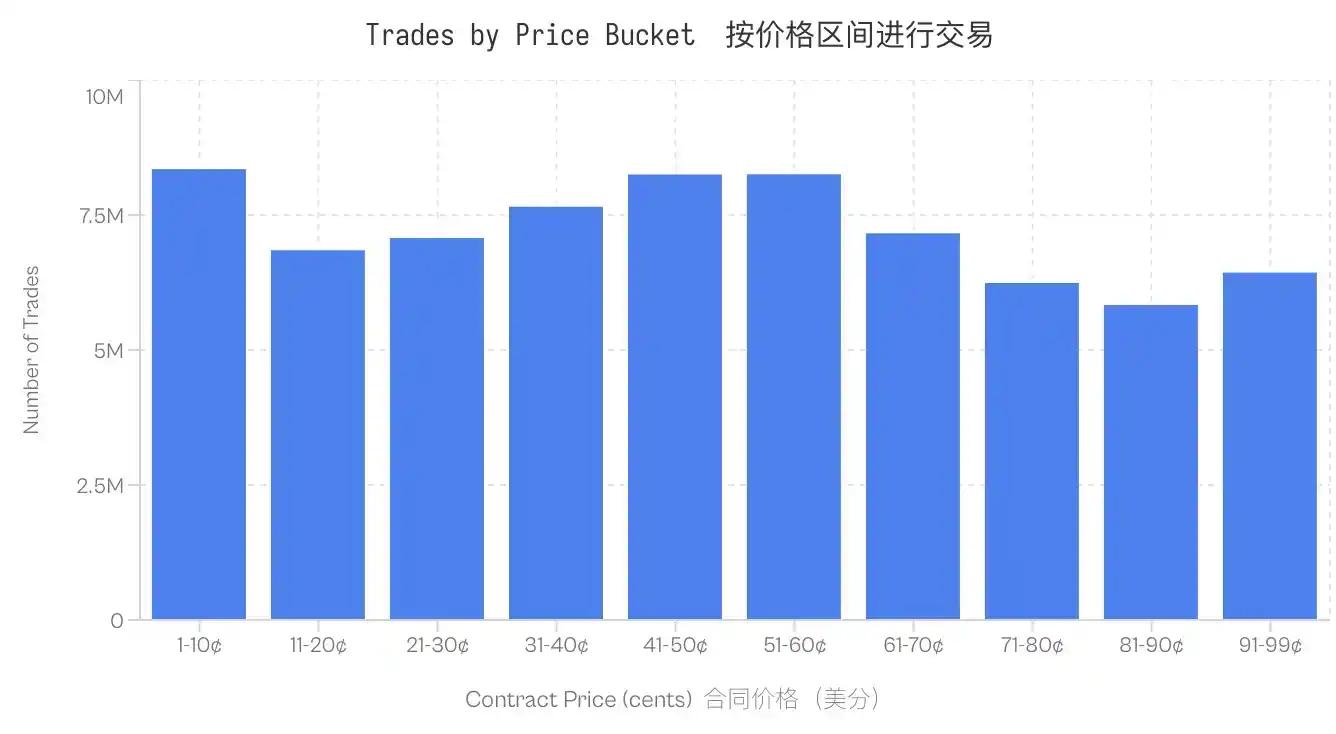
The calculations are based solely on settled markets. Markets that are invalid, delisted, or still open are excluded. Furthermore, market trades with a notional trading volume of less than $100 are also excluded. The dataset remains robust across all price levels; even the lowest-volume range (81-90 cents) contains 5.8 million trades.
Longshot Bias on Kalshi
Longshot bias was first documented by Griffith (1949) in horse racing and later formalized by Thaler & Ziemba (1988) in their analysis of the pot betting market. It describes the tendency of bettors to overpay for low-probability outcomes. In an efficient market, a contract priced at p cents should have approximately p% probability of winning. In markets where longshot bias exists, the low-priced contract has a lower probability of winning than its implied probability, while the high-priced contract has a higher probability of winning than its implied probability.
Kalshi's data confirms this pattern. Contracts trading at 5 cents had only a 4.18% win rate, meaning a -16.36% mispricing. Conversely, contracts at 95 cents had a 95.83% win rate. The pattern is consistent: all contracts priced below 20 cents underperformed their odds, while contracts above 80 cents outperformed them.
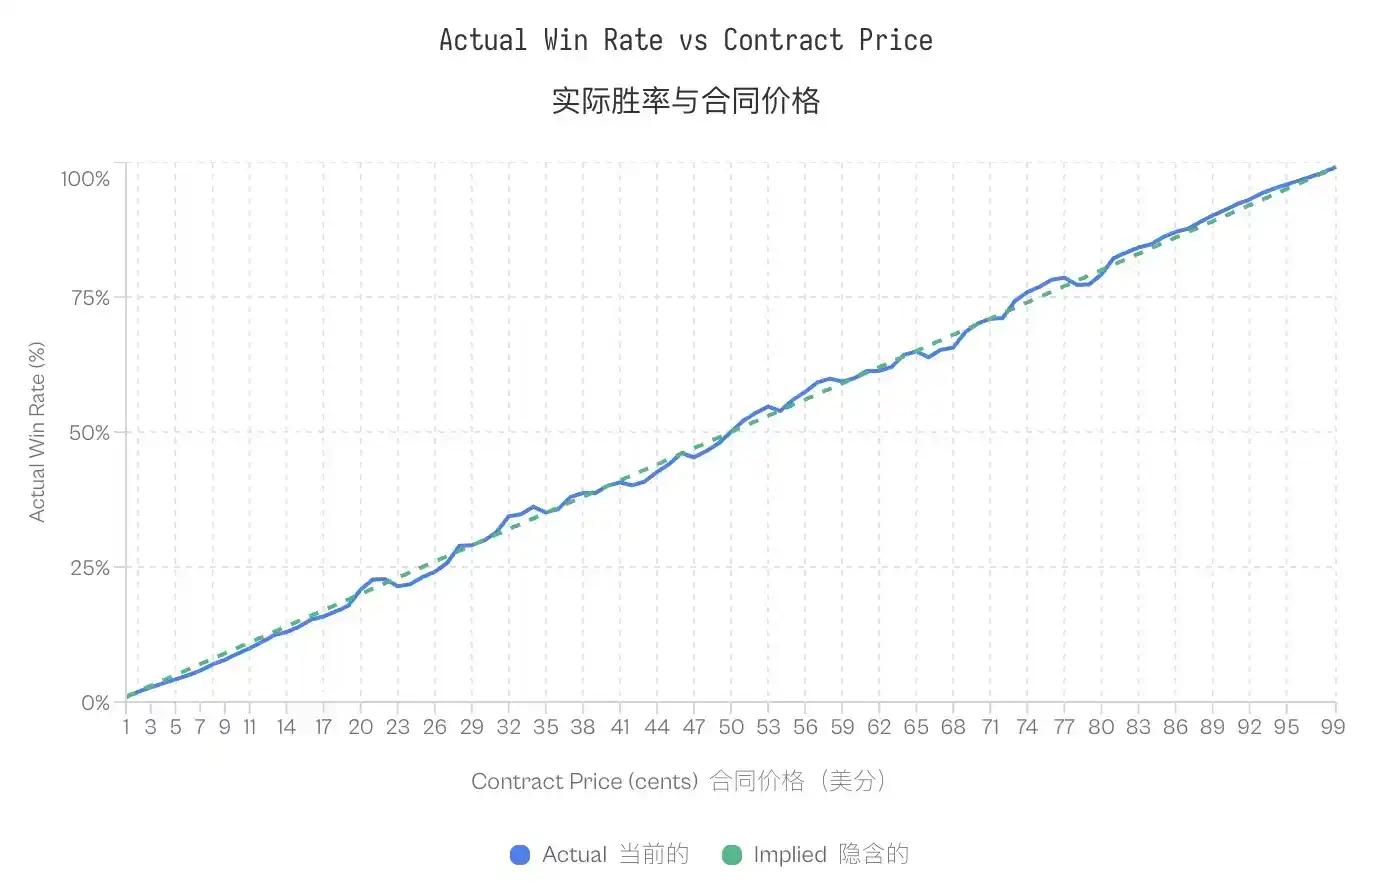 Note: Despite this bias, the calibration curve shows that prediction markets are actually quite efficient and accurate, with slight exceptions at the tails (extremely low or high prices). The close alignment between implied and actual probabilities confirms that prediction markets are well-calibrated price discovery mechanisms.
The existence of Longshot Bias raises a problem unique to zero-sum markets: if some traders systematically pay excessively high prices, then who gets the surplus value?
Wealth transfer between order placers and order takers
The role-based breakdown of the market microstructure defines two groups based on their interactions with the order book. Makers provide liquidity by placing limit orders on the order book. Takers consume liquidity by fulfilling existing orders. The role-based breakdown of total returns reveals a significant asymmetry:
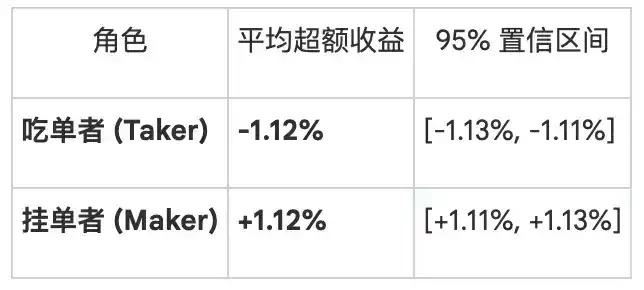
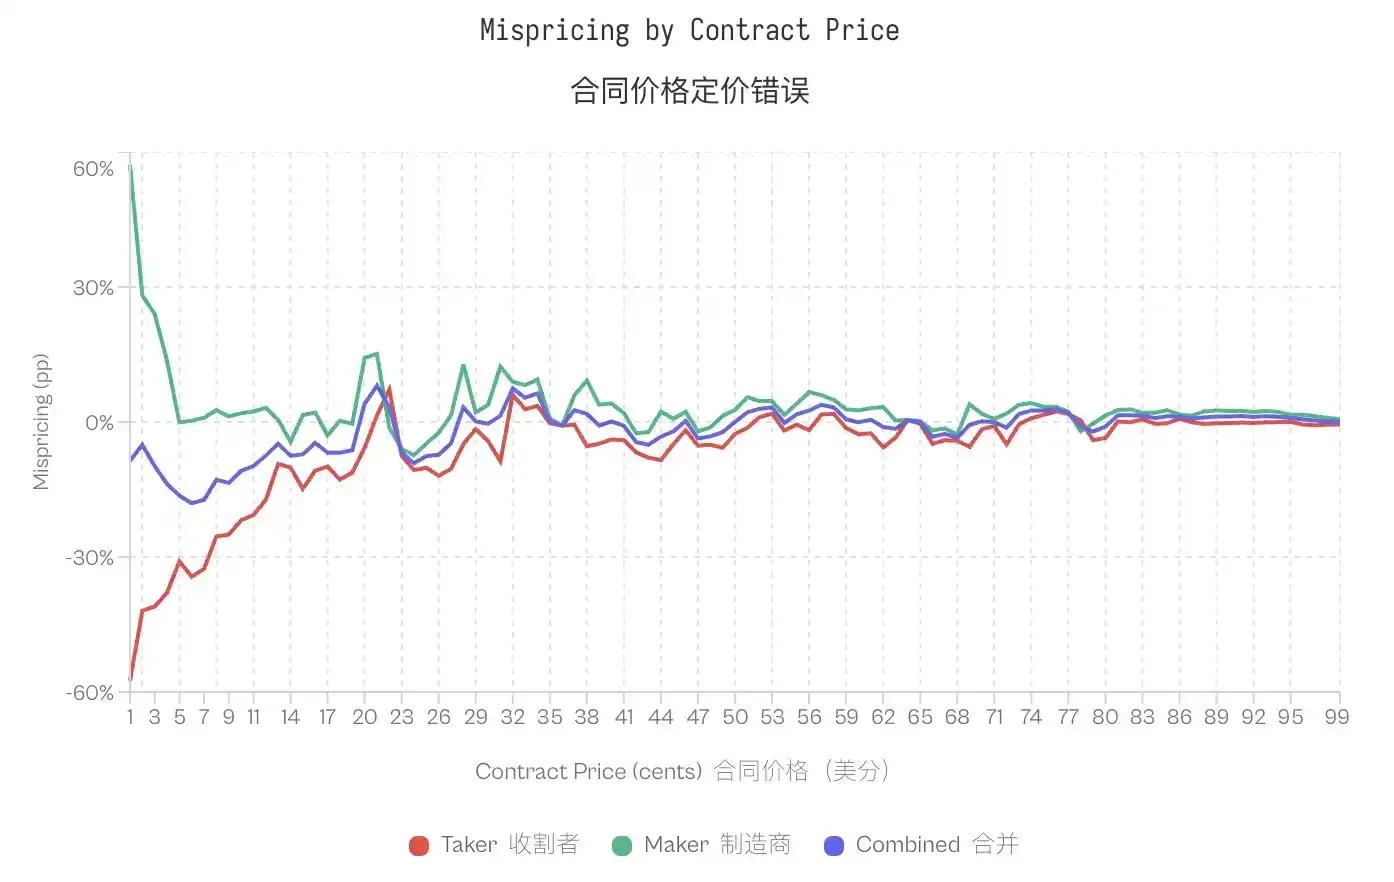
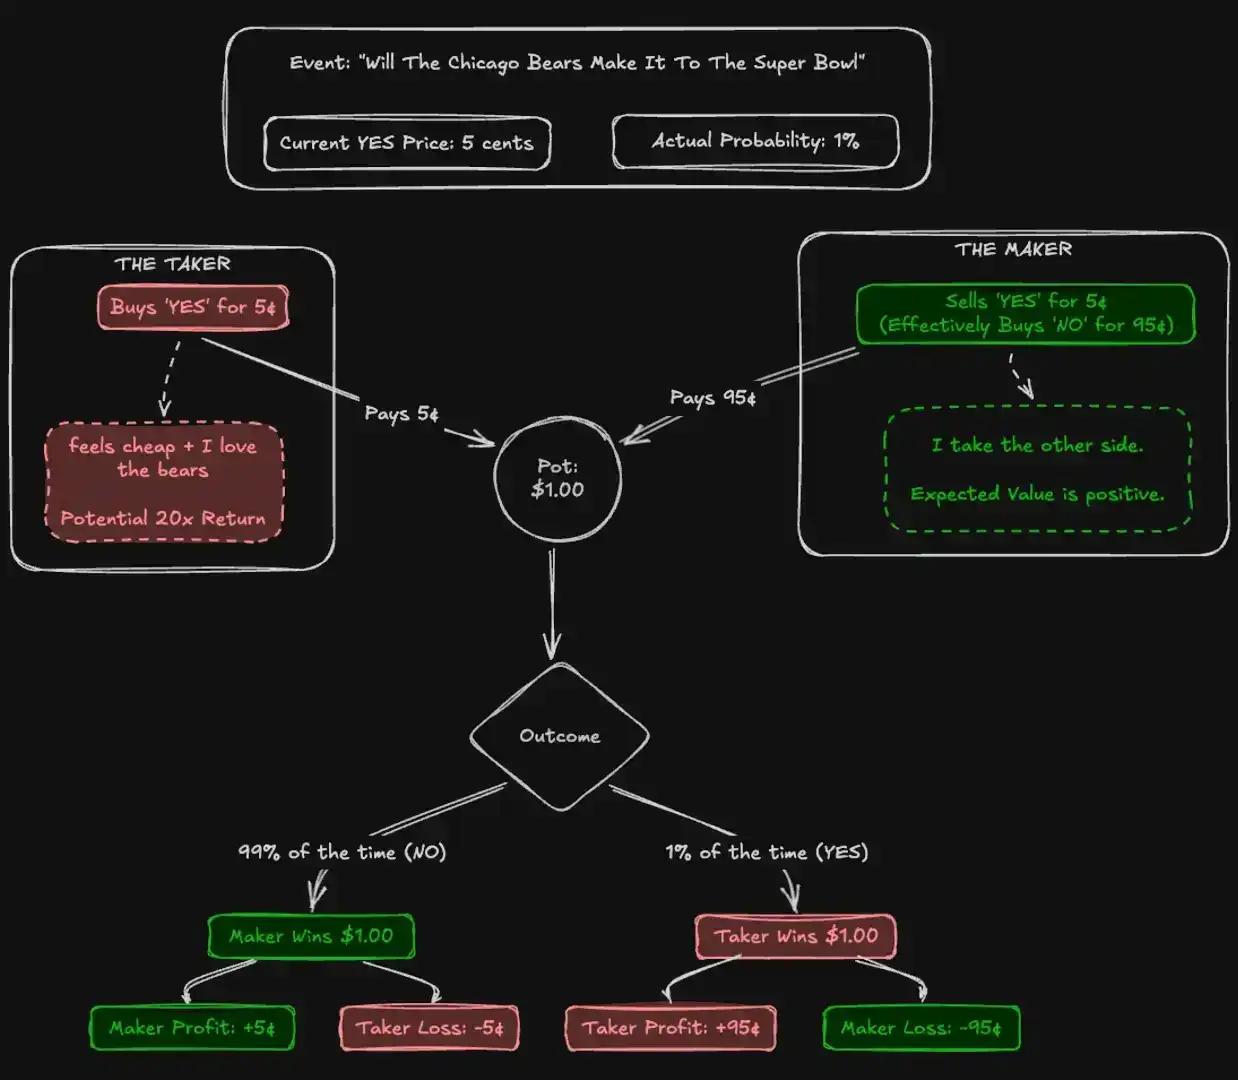
This divergence is most pronounced at the tail end. For a 1-cent contract, takers have a win rate of only 0.43% (implied probability 1%), corresponding to a -57% mispricing. For the same contract, place orders have a win rate of 1.57% and a mispricing of +57%. At 50 cents, the mispricing is compressed; takers show -2.65%, while place orders show +2.66%. At 80 out of 99 price levels, takers show negative excess returns, while place orders show positive returns at the same 80 levels.
The overall market mismatch is concentrated among a specific group: those who take orders bear the losses, while those who place orders reap the profits.
Is this merely compensation for the price difference?
One clear objection is that order placers earn bid-ask spreads as compensation for providing liquidity. Their positive returns may simply reflect spread capture rather than taking advantage of biased money flows.
While this seems reasonable, two observations suggest otherwise. First, the returns for those placing orders depend on the direction they take. If profits were purely based on price differences, then whether a buyer places an order (YES or NO) should be irrelevant.
We tested this by breaking down the performance of those placing orders by position direction:
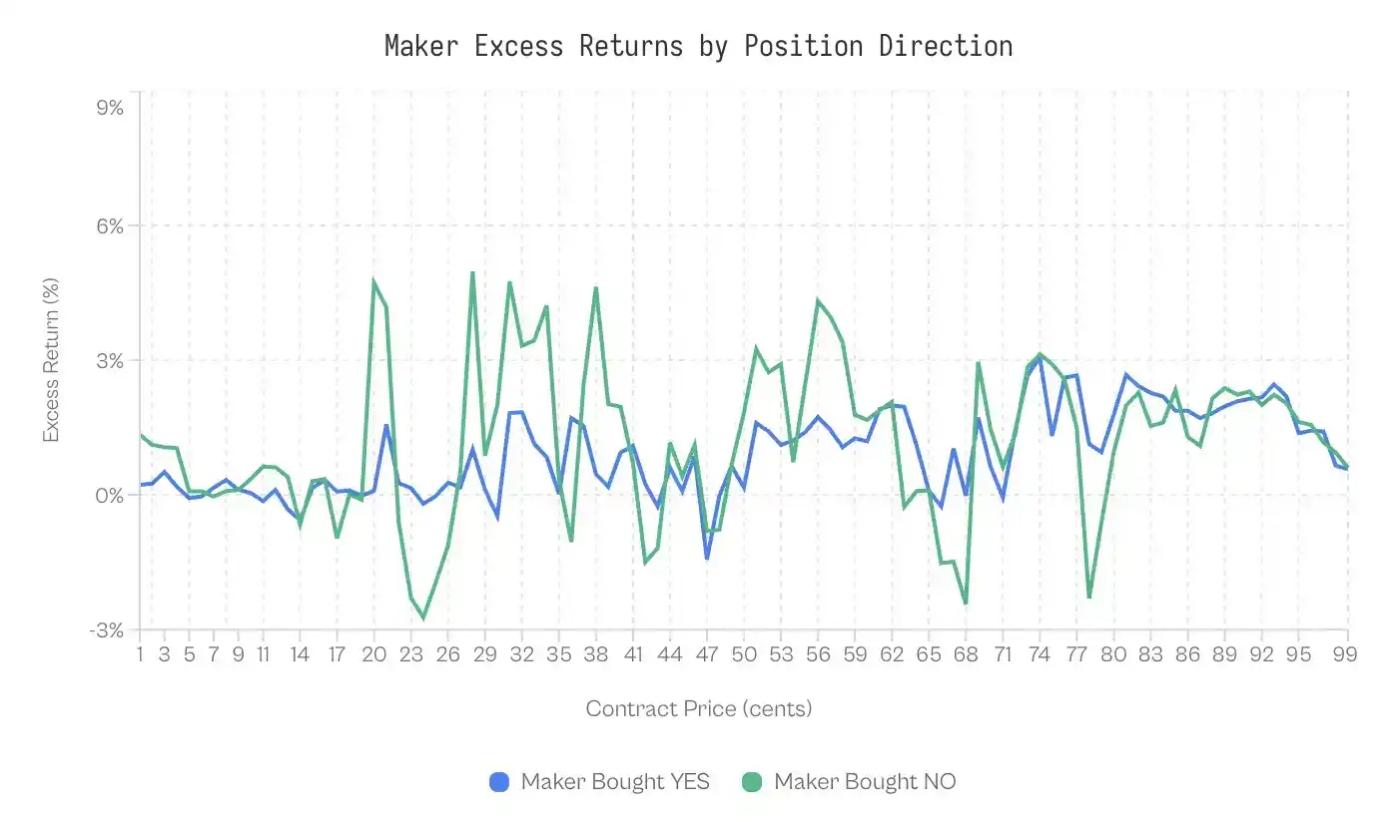
Buyers of NO orders outperformed buyers of YES orders 59% of the time.
The weighted excess return for those who placed buy orders for YES was +0.77%, while that for those who placed buy orders for NO was +1.25%. The difference was 0.47 percentage points. Although this effect is negligible (Cohen's d = 0.02-0.03), it is stable.
At least, this suggests that spread capture is not the whole story.
Differences between market categories
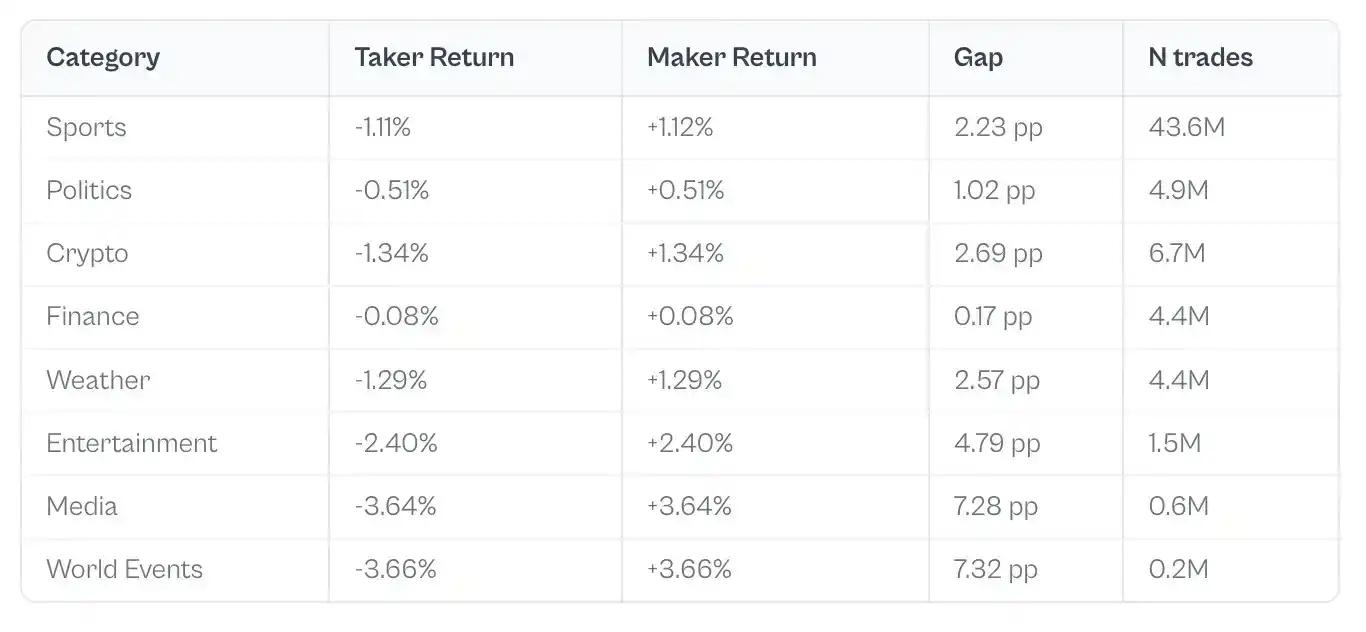
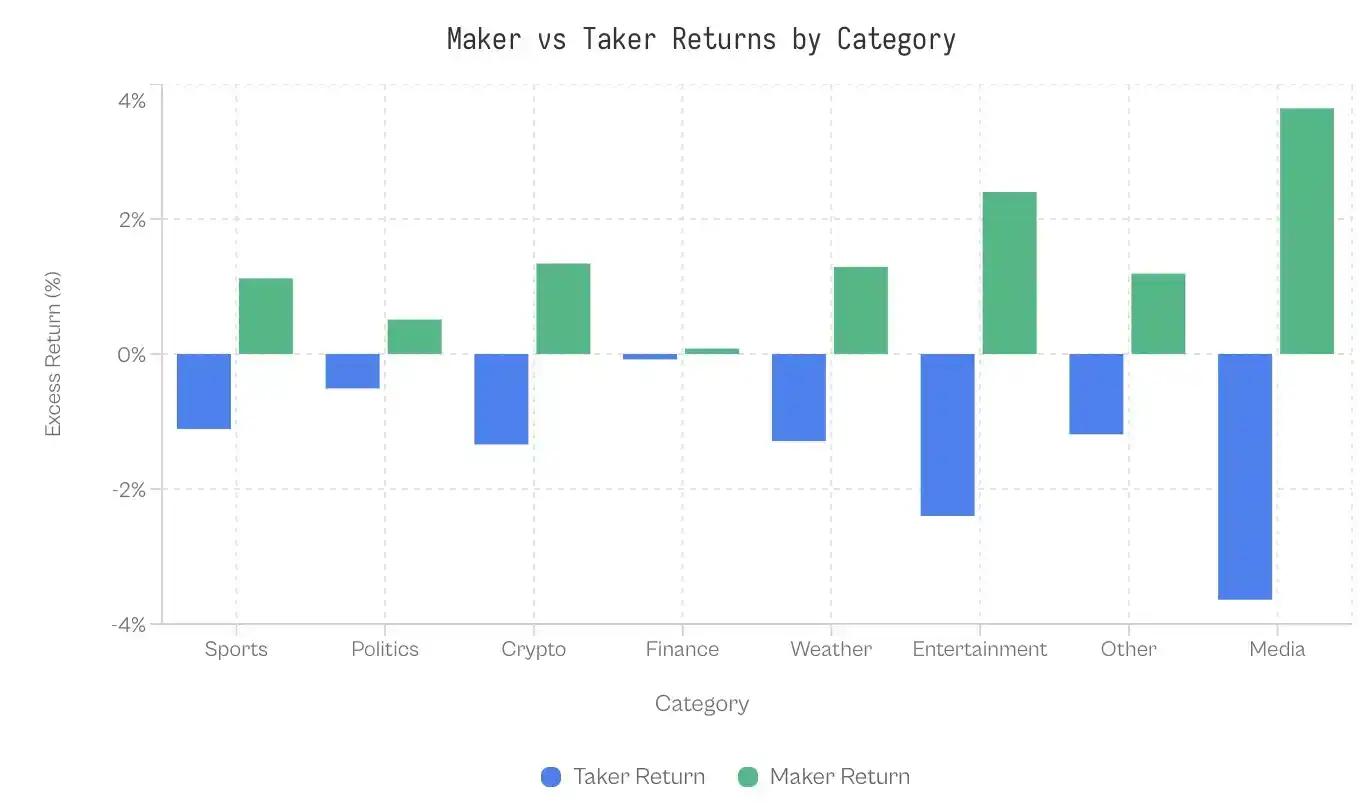
If irrational demand stemming from a lack of understanding of market conditions leads to biases, then categories attracting fewer sophisticated participants should show a larger gap. The data is startling: the financial category shows a gap of only 0.17 percentage points; the market is extremely efficient.
On the other end, the gap shown by world events and media exceeds 7 percentage points. Sports, as the category with the largest transaction volume, shows a modest gap of 2.23 percentage points. Considering the $6.1 billion in order volume, even this modest gap represents a significant transfer of wealth.
Why are financial questions so effective? A possible explanation is participant screening; financial questions attract traders who think in terms of probability and expected value, rather than fans betting on their favorite teams. The questions themselves are often dry (e.g., "Will the S&P 500 close above 6000?"), which filters out emotional bettors.
The Evolution of Taker and Maker
The difference between those who place orders and those who take orders is not an inherent feature of the market; it emerged as the platform developed. In the early days of Kalshi, the pattern was reversed: those who took orders earned positive excess returns, while those who placed orders lost money.
From its release until 2023, takers averaged a +2.0% return, while order placers averaged a -2.0%. Without experienced trading counterparts, takers won; amateur order placers defined the early stages and became the losers.
This situation began to reverse in the second quarter of 2024 and the gap widened sharply after the 2024 election.
The turning point coincided with two events: Kalshi's victory over the CFTC in October 2024 to secure a political contract license, and the subsequent 2024 election cycle. Trading volume surged from $30 million in Q3 2024 to $820 million in Q4. The new capital attracted established market makers, who then extracted value from the order book.
Before the election, the average margin was -2.9 pp (the person who placed the order wins); after the election, it reversed to +2.5 pp (the person who placed the order wins).
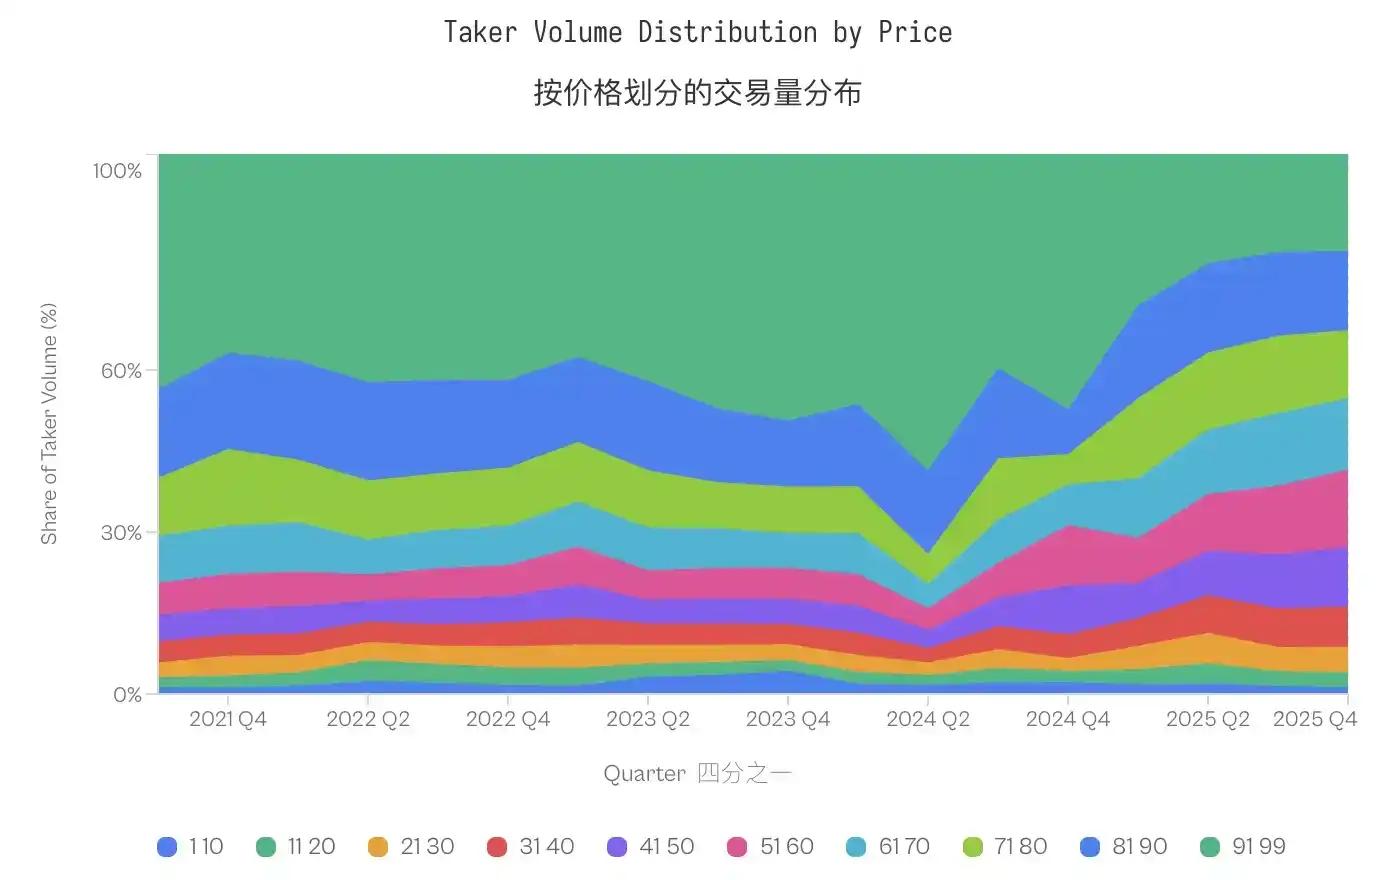
The trading volume share of low-probability contracts (1-20 cents) remained largely unchanged, at 4.8% before the election and 4.6% after. However, the distribution actually shifted towards the mid-range price level; the share of the 91-99 cent price level decreased from 40-50% in 2021-2023 to less than 20% in 2025, while the mid-range price level (31-70 cents) saw a significant increase.
The behavior of those who take orders did not become more extreme (the share of low-probability contracts even decreased slightly), but their losses increased.
This evolution has reshaped the overall outcome. The transfer of wealth from traders to market makers is not an inherent feature of predicting market microstructure; it requires sophisticated market makers, who in turn need sufficient trading volume to justify their participation.
In the early stages when trading volume is low, market makers are likely to be inexperienced individuals who lose out to relatively knowledgeable traders.
The surge in trading volume attracted professional liquidity providers who were able to extract value from traders' cash flows at all price points.
YES/NO Asymmetry
The breakdown of order placers and order takers identifies who absorbs losses, but leaves the question of how to operate. Why is pricing in the order taker flow always wrong? The answer lies not in the order placers' superior predictive abilities, but in the order takers' tendency to exhibit a high cost for positive outcomes.
Asymmetry at the same price
Standard efficiency models suggest that, at the same price, the pricing discrepancies between different contract types should be symmetrical. Theoretically, a 1-cent "yes" contract and a 1-cent "no" contract should reflect similar expected returns.
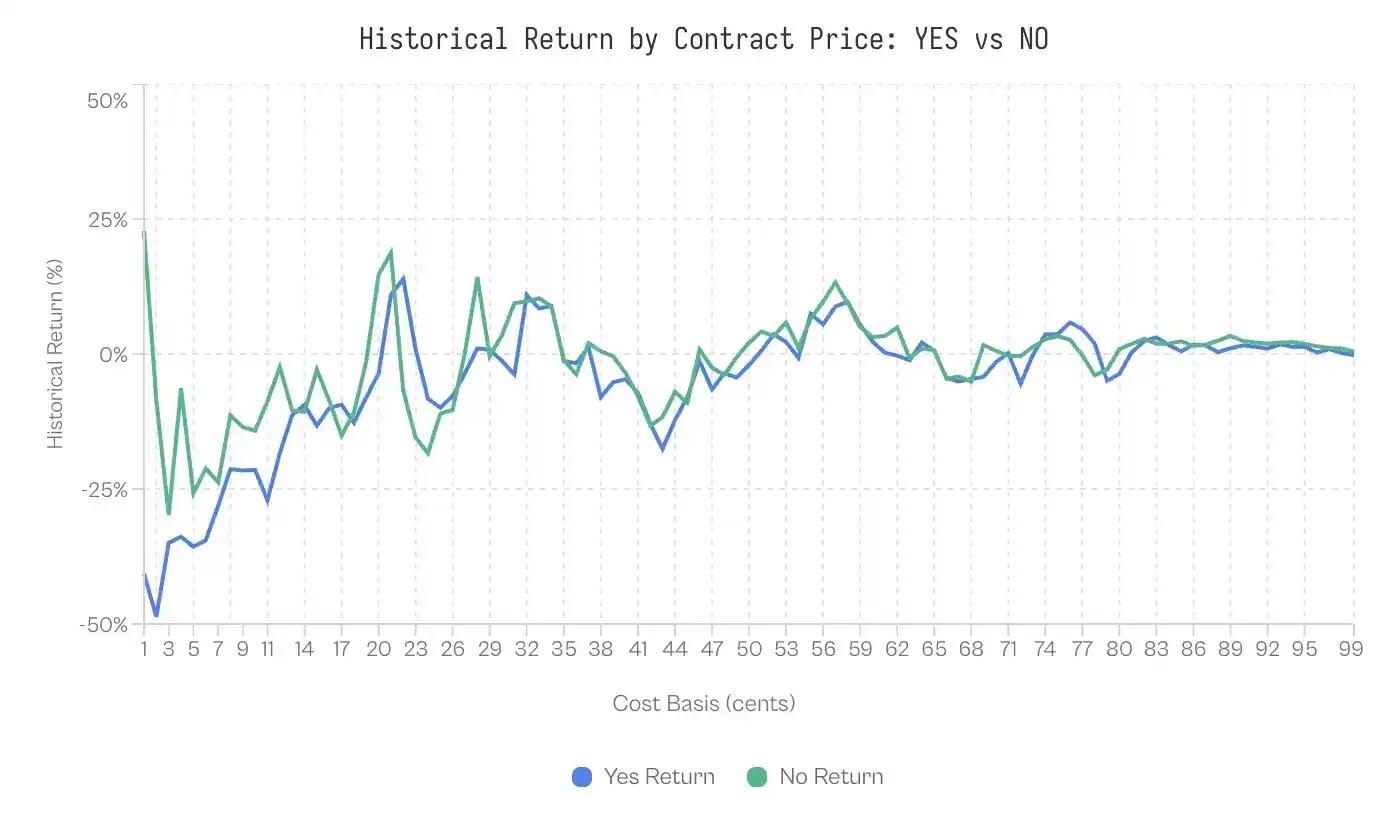
However, the data contradicts this. At a price of 1 cent, the historical expected return for "YES" is -41%; buyers of YES expect to lose nearly half of their principal. Conversely, the historical expected return for the "NO" contract, also at 1 cent, is +23%. The difference between these two seemingly identical probability estimates is a staggering 64 percentage points.
The advantage of the NO contract persists. Of the 99 price levels, the NO contract outperformed the YES contract at 69, with the advantage primarily concentrated at extreme market price levels. The NO contract generated higher returns on every price increment from 1 cent to 10 cents and from 91 cents to 99 cents.
Although the market is a zero-sum game, the dollar-weighted return for "YES" buyers was -1.02%, while the dollar-weighted return for "NO" buyers was +0.83%, a difference of 1.85 percentage points. This is due to the excessively high price of "YES".
Eaters prefer affirmative betting
The poor performance of the YES contract may be related to trader behavior. Analysis of the trading data revealed a structural imbalance in the order flow composition.
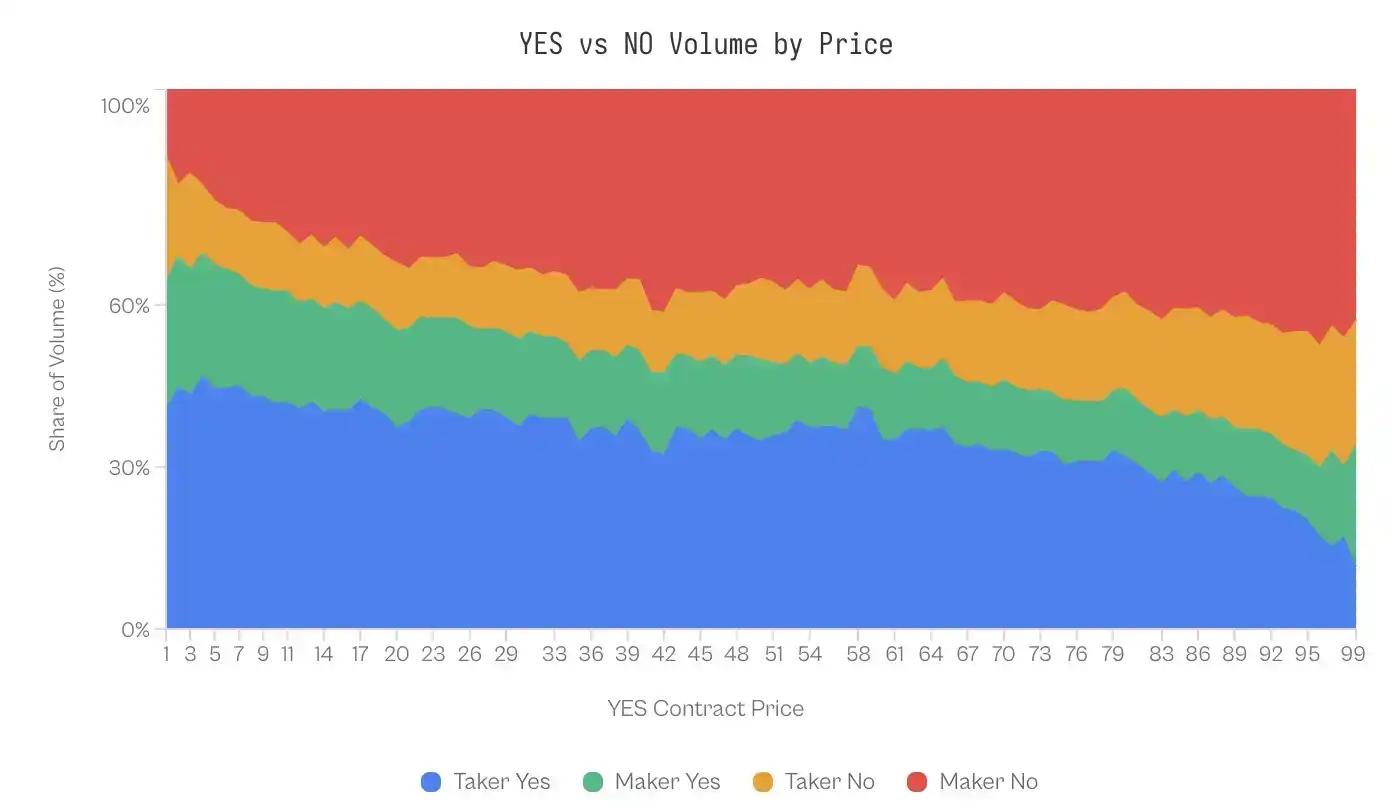
In the 1-10 cent range (YES representing a less popular outcome), takers accounted for 41-47% of the YES trading volume, while order placers accounted for only 20-24%. This imbalance reverses at the other end of the probability curve. When the contract price is 99 cents (meaning NO is a 1-cent less popular outcome), order placers actively buy NO contracts (accounting for 43% of the trading volume), while takers account for only 23%.
One might assume that market makers exploit this asymmetry to profit from more accurate directional predictions—that is, they know when to buy NO. But the evidence does not support this assumption.
When market makers' performance is broken down by position direction, the returns are almost identical. Statistically significant differences only appear at the extreme tails (1-10 cents and 91-99 cents), and even at these tails, the effect size is negligible (Cohen's d = 0.02-0.03).
This symmetry is significant: market makers do not profit by predicting direction, but rather through a mechanism that applies equally to both directions.
discuss
An analysis of 72.1 million transactions on the Kalshi platform reveals a unique market microstructure: a systematic shift of wealth from liquidity recipients to liquidity creators. This phenomenon is driven by specific behavioral biases, moderated by market sophistication, and concentrated in categories that evoke high levels of emotional investment.
Profit extraction mechanism for beneficiaries
In a zero-sum market, do winners achieve their profits through superior information (prediction) or superior structure (market making)?
The data strongly supports the latter.
When market makers' returns are broken down by position direction, the performance difference is negligible: market makers who buy "YES" gain an excess return of +0.77%, while market makers who buy "NO" gain an excess return of +1.25% (Cohen's d ≈ 0.02).
This statistical symmetry suggests that market makers do not possess a significant ability to predict winners. Instead, they profit through structured arbitrage: providing liquidity to a group of "takers" who prefer high-risk, high-reward outcomes.
This extraction mechanism relies on an "optimistic tax".
Despite the fact that the low-probability "YES" contract outperformed the low-probability "NO" contract by 64 percentage points, traders still disproportionately bought "YES" contracts at the low-probability price, accounting for almost half of the total trading volume in that price range.
Therefore, market makers do not need to predict the future; they simply need to act as counterparties to optimistic sentiment. This is consistent with the findings of Reichenbach and Walther (2025) on Polymarket and Whelan (2025) on Betfair, suggesting that in prediction markets, market makers provide trading flows that adapt to this bias rather than making predictions.
Specialization of liquidity
Between 2021 and 2023, despite the existence of longshot bias, takers were still able to make positive profits. This reversal of trend coincided precisely with the surge in trading volume following Kalshi's victory in the lawsuit in October 2024.
The wealth transfer observed at the end of 2024 was a function of market depth. In the early stages of the platform, low liquidity hindered the entry of sophisticated algorithmic market makers. The massive trading volume following the 2024 election incentivized the entry of professional liquidity providers, who were able to systematically capture spreads and exploit biased money flows.
Differences between markets
The gap between pending and taking orders for different categories reveals how participant selection shapes market efficiency.
• Finance (0.17 pp): As a control group, it demonstrates that predictive markets can be nearly efficient. Questions such as "Can the S&P 500 close above 6000?" attract participants who think in terms of probability and expected value; they are likely also options traders or macroeconomic data followers. The barrier to informed participation is high, ordinary bettors have no advantage, and they are likely aware of this and therefore choose to withdraw.
• Politics (1.02 pp): Although it involves strong emotional factors, its predictive efficiency remains somewhat inadequate. Political bettors closely monitor polls and continuously adjust their judgments through election cycles. This gap is larger than in financial betting but much smaller than in entertainment betting, indicating that while political participation is strongly emotionally charged, it does not completely weaken probabilistic reasoning ability.
• Sports (2.23 pp): This is the category with the highest share in the prediction market. Although the difference is small, it is still significant considering that this category accounts for 72% of the trading volume. Sports bettors exhibit some documented preferences, including home team loyalty, recency effect, and emotional attachment to star players. Fans betting on their supported team to win the championship are not calculating expected returns, but buying hope.
• Cryptocurrencies (2.69 pp): Attracting participants heavily influenced by the retail "price surge" mentality, a demographic that overlaps with meme traders and NFT speculators. Questions such as "Will Bitcoin reach $100,000?" tend to be based on narrative rather than probability estimates.
• Entertainment, Media, and World Events (4.79–7.32 pp): These areas exhibit the largest cognitive gaps and share a common characteristic: extremely low barriers to entry for people seeking expertise. Anyone who follows celebrity gossip feels qualified to predict award ceremony outcomes; anyone who reads news headlines feels knowledgeable about geopolitics. This leads participants to confuse familiarity with judgment.
Our research suggests that market efficiency depends on two factors: the technological barriers to informed participation and the extent to which the market's implicit questions evoke emotional reasoning.
When market barriers are high and the framework is objective and calm, market efficiency approaches ideal; when barriers are low and the framework encourages narrative, the optimism effect reaches its peak.
limitation
Although the data used in the study is reliable, there are still some limitations.
First, due to the lack of unique trader IDs, we can only rely on the "market maker/taker" classification to represent "mature/immature" traders. While this is standard practice in microstructure literature, it does not perfectly capture situations where mature traders utilize timely information for cross-trading.
Secondly, we cannot directly observe the bid-ask spread from historical transaction data, making it difficult to completely distinguish spread capture from the use of biased flow.
Finally, these results apply only to the U.S. regulatory environment; offshore trading venues with different leverage caps and fee structures may exhibit different dynamics.
in conclusion
The promise of prediction markets lies in their ability to aggregate diverse information into a single, accurate probability.
However, our analysis of Kalshi suggests that this signal is often distorted by systemic wealth transfers driven by human psychology and market microstructures.
The market is split into two distinct groups: a class of order takers who systematically pay excessive prices for low-probability, certain outcomes, and a class of order placers who extract this premium by passively providing liquidity.
Markets are efficient when topics are dry and quantifiable (such as finance). When topics allow for deliberate participation (such as sports and entertainment), markets transform into a mechanism for transferring wealth from optimists to actuaries.


