

The US Dollar Index (DXY) has fallen below 96 for the first time since the beginning of 2022, simultaneously losing its 15-year-long support line – the cornerstone of the USD's strength since 2011.
This sharp decline occurred amidst President Donald Trump's latest statement, along with other macroeconomic factors impacting the market. Notably, the significant drop in the DXY has led many to expect a strong breakout for Bitcoin (BTC).
The US Dollar Index (DXY) fell to its lowest level in four years.
Recent macroeconomic developments have exerted sustained downward pressure on the US Dollar Index. Rumors of possible Japanese intervention in the yen have helped the JPY appreciate, while simultaneously causing the USD to fall sharply.
Meanwhile, concerns about the overall stability of the market are gradually returning. According to a report by Euractiv, Kristalina Georgieva – the IMF Director – revealed at an event organized by the Bruegel think tank (Brussels) that the IMF is enhancing its ability to project “unrealistic scenarios” in order to prepare policy responses.
When asked whether this scenario included significant volatility in the US dollar market, she said the IMF was XEM “all scenarios” in its ongoing analysis.
Finally, recent statements by former President Trump have also put pressure on the US dollar. Speaking to reporters in Iowa, he downplayed the recent decline in the dollar's value, asserting that the currency "is still doing very well."
"No, I think it's very good... Look at our business situation. The dollar is doing very well," he said .
Trump's remarks came just before the DXY recorded its sharpest one-day drop since the market volatility caused by tariffs in April . Market data showed the index falling to a low of 95.5, a level not seen since February 2022, before recovering to 96 at the time of writing. The DXY also broke below a long-standing support line that had held since 2011.
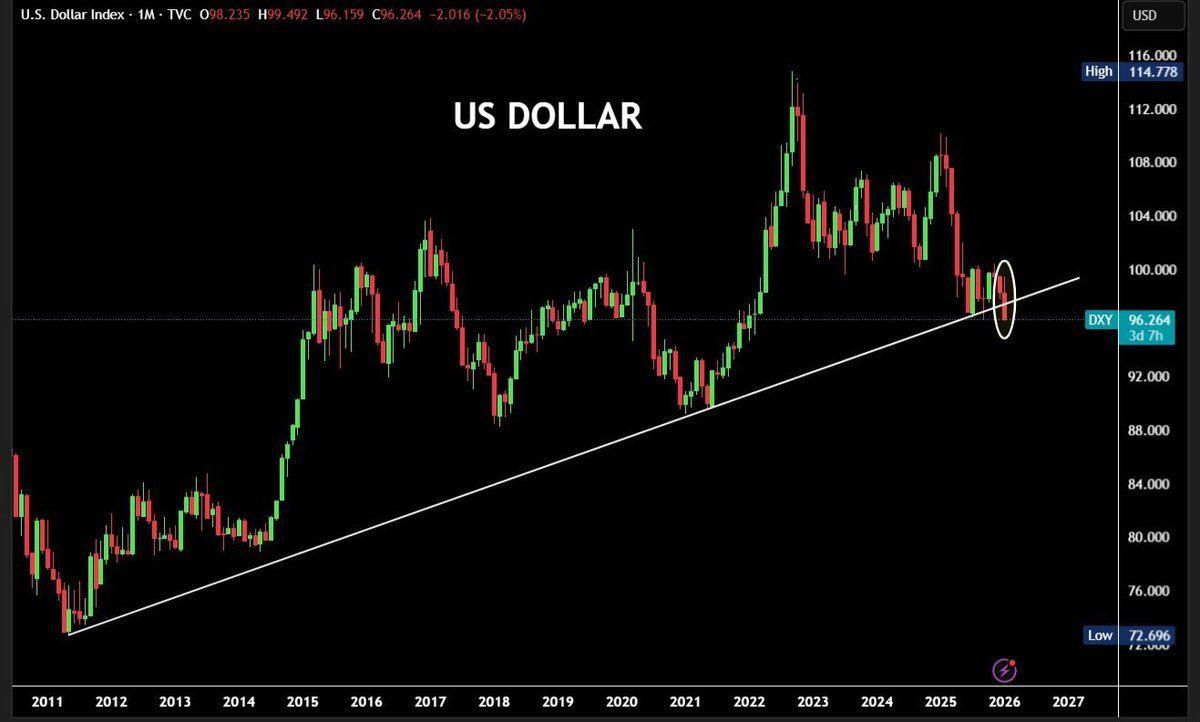 The monthly DXY chart shows that the 15-year uptrend has just been broken. Source: X/BullTheory
The next three days will be crucial. If, by the end of the month, the DXY confirms a candle close below this 15-year trendline, analysts predict the USD will weaken even further.
What does a drop in the DXY mean for Bitcoin?
The inverse correlation between the USD and Bitcoin is no stranger to retail investors . Notably, past sharp drops of the DXY below 96 have consistently signaled subsequent strong price increases for Bitcoin.
According to experts, the two most recent instances of this phenomenon – in 2017 and 2020 – both led to major surges in Bitcoin's value.
In addition, recent technical analysis is also showing positive signals for Bitcoin. Bitcoin Vector indicates a bullish divergence forming between the price of Bitcoin and the Relative Strength Index (RSI) – a technical pattern suggesting that selling pressure is weakening.
The post stated that similar structures in the past at the same timeframe can often yield gains of around 10%, meaning the price is likely to return to the $95,000 range soon.
“The real signal lies in the intersection: if we see both network and liquidation increase while BTC Dominance remains stable, this could very well be the start of a strong uptrend,” the post stated .
However, some experts believe that Bitcoin may continue to fall in the near future. Whether the current decline will turn into a new rally for Bitcoin remains to be seen, and we will have to wait for confirmation from the currency market and larger risk assets in the coming weeks.


