

Bitcoin's latest recovery has been rather weak. After falling to around $85,970, the price of Bitcoin only increased by about 4% before stabilizing around $89,380. Despite new news about ETFs and stabilizing signals on the technical chart, the price of BTC has not surged as strongly as expected.
The major issue lies in timing. Expectations of interest rate cuts have largely faded as the Federal Reserve prepares to meet, while cautious macroeconomic sentiment prevails over positive short-term signals. Bitcoin prices have been mostly flat across most timeframes, and the market is awaiting a clear breakout.
Divergence provides no impetus when interest rate cut sentiment outweighs interest in ETFs.
On the daily chart, Bitcoin showed a hidden bullish divergence during the period from December 18, 2023 to January 25, 2024. The price formed higher Dip , while the Relative Strength Index (RSI) formed lower Dip .
The RSI is an indicator that reflects momentum strength. When the RSI weakens while the price remains high, it is often a sign that the price may recover. In fact, this signal helped Bitcoin bounce slightly, but it only lasted for a short time. The BTC price increase only reached about 4% and was quickly overwhelmed by selling pressure around the $89,380 mark.
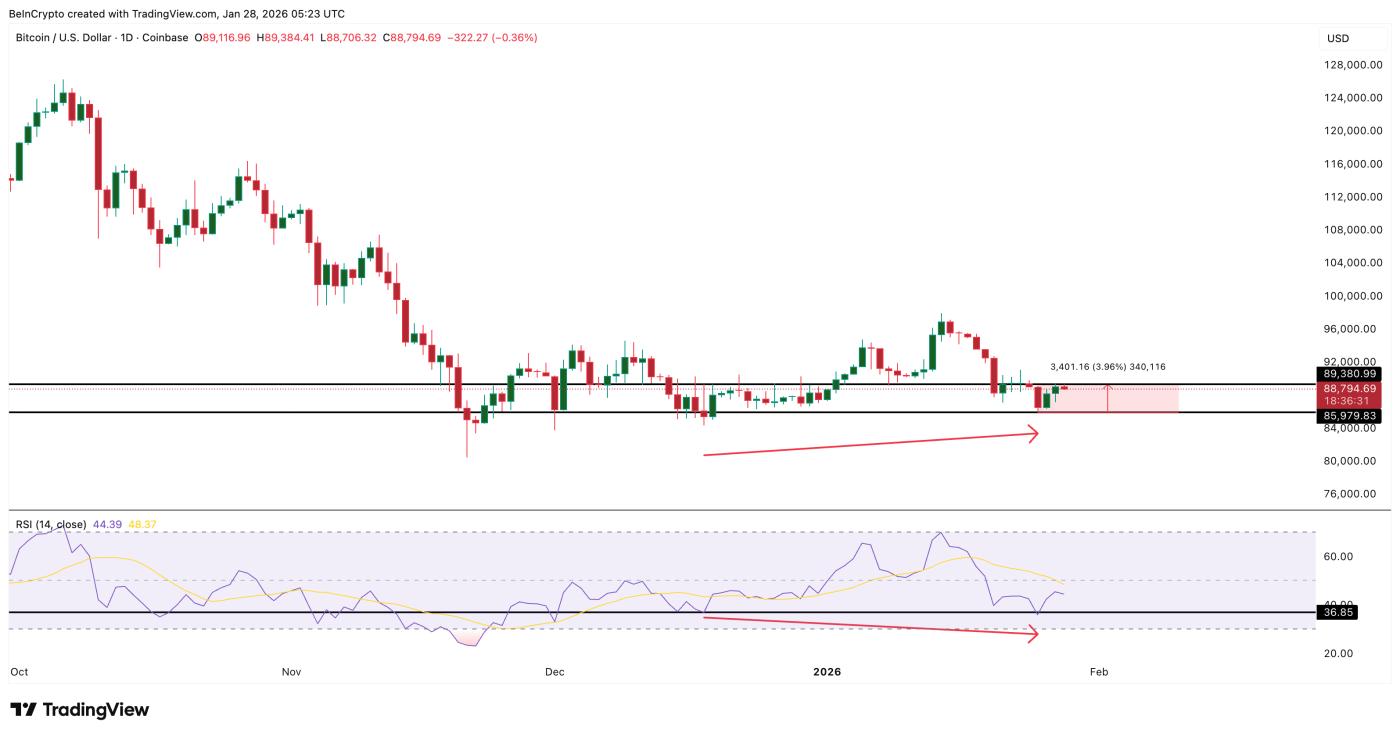 Hidden bullish divergence: TradingView
Want to learn more about Token? Sign up for editor Harsh Notariya's daily Crypto newsletter here .
The weak reaction was actually significant. Around the same time (January 25th to 26th, 2024), the market was excited by new positive news about ETFs when BlackRock filed for a Bitcoin premium-income ETF. Normally, news about ETFs would cause a stronger price surge. But this time it didn't.
The missing "ingredient" here is macroeconomic support. According to Polymarket, the probability of the Fed keeping interest rates unchanged atthe upcoming FOMC meeting is currently at 99%. With the market no longer expecting a rate cut, liquidation is also becoming tighter. This makes it difficult for prices to break out strongly, even when positive technical signals appear.
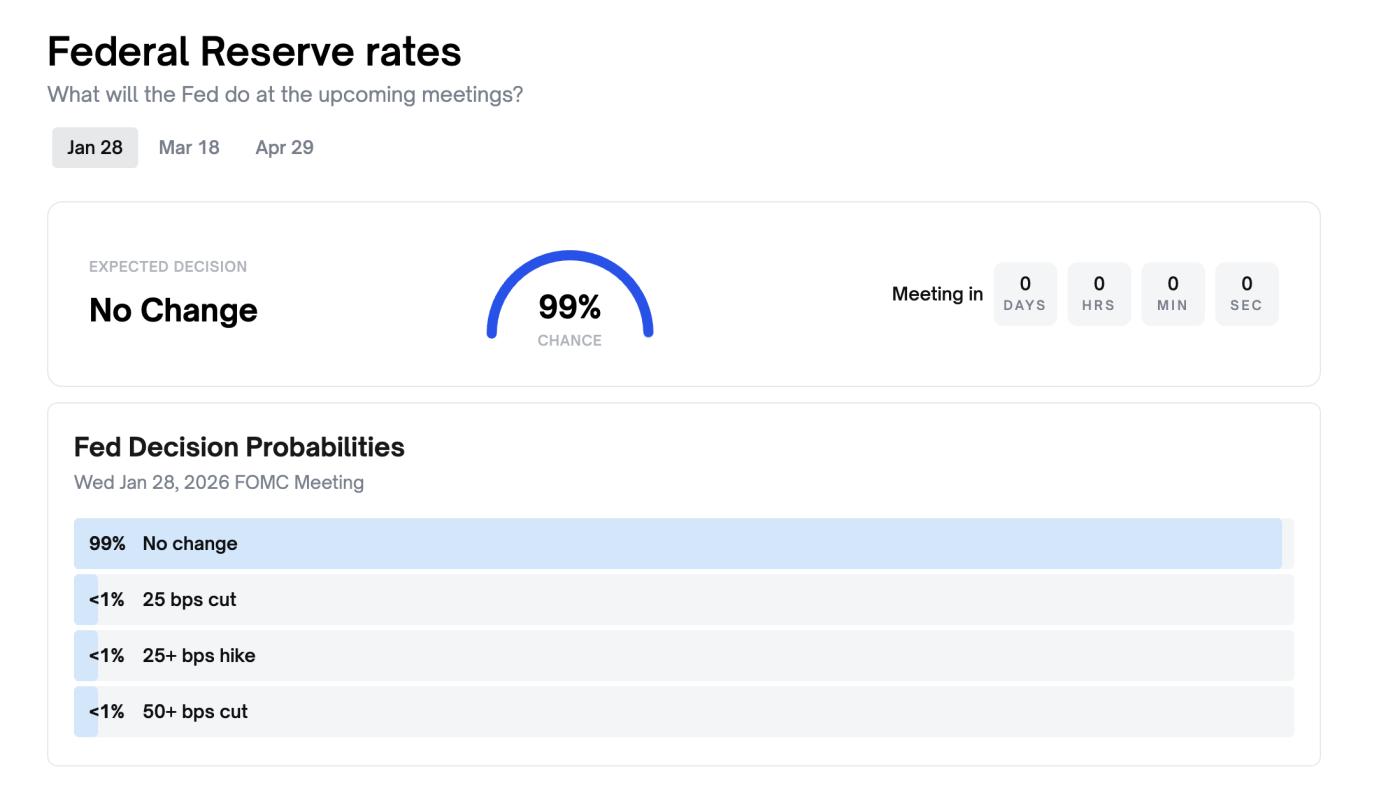 Expectations of interest rate cuts: Polymarket
Simply put, the RSI indicator opened up an opportunity for Bitcoin's price to surge , but the "no interest rate cut" sentiment closed that door.
Bitcoin whales are quietly accumulating as cost Capital data identifies the real contention zone.
Despite the relatively stable price, the "whales" holding large amounts of Bitcoin are acting differently.
Wallets holding between 1,000 and 10,000 BTC (small whales) have increased their total holdings from 4.28 million BTC to 4.29 million BTC since January 21, 2024. Medium wallets holding 10,000–100,000 BTC increased from nearly 2.19 million to approximately 2.20 million BTC. The largest group, with wallets owning between 100,000 and 1 million BTC, has been actively buying, increasing their holdings from 664,000 to approximately 672,000 BTC as of January 28, 2024.
In total, these groups have purchased approximately 18,000 additional BTC, equivalent to nearly $1.6 billion at current prices.
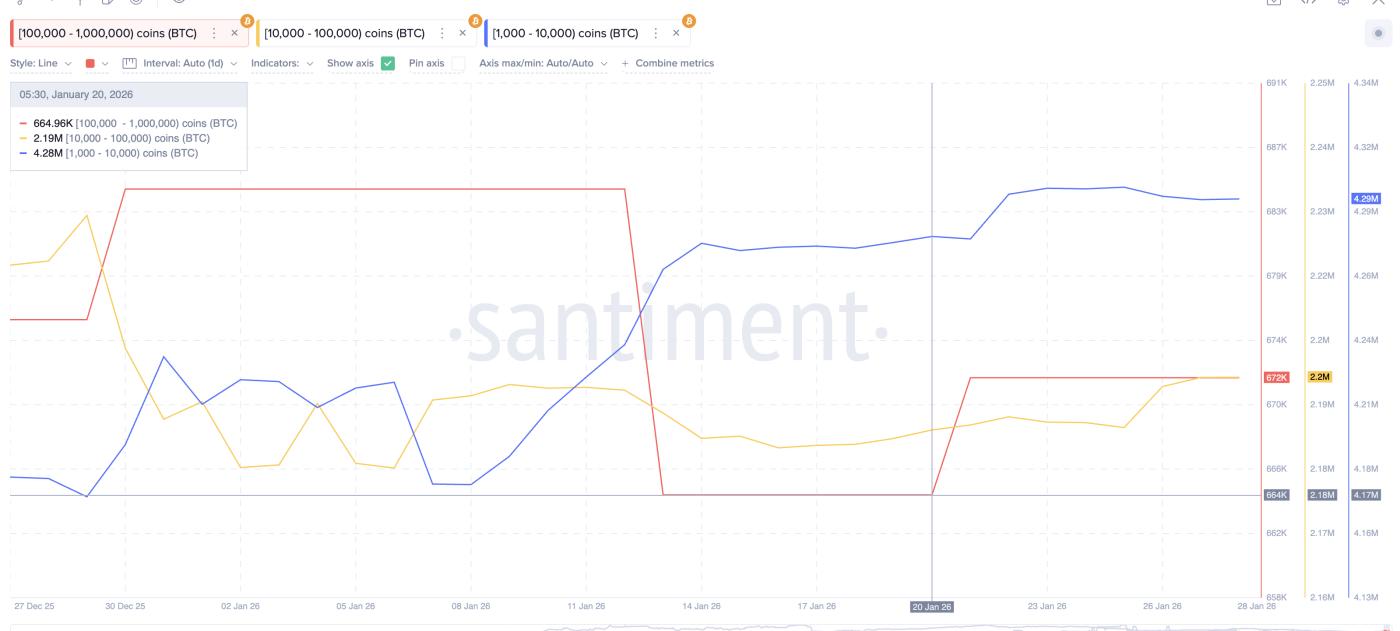 BTC whales buy more: Santiment
This accumulation demonstrates long-term confidence in Bitcoin, rather than just short-term trading. But confidence alone isn't enough to create a breakthrough. The "heat map" showing the allocation of Capital basis clearly explains why.
There is currently a fairly large "short-term supply zone" between $90,160 and $90,590, with approximately 176,000 BTC being bought there. This zone Vai as a " Sell Wall." If the price or the volume of whale buying doesn't break through this zone, the uptrend will be halted. Currently, the buying pressure from whales is not strong enough to absorb this supply.
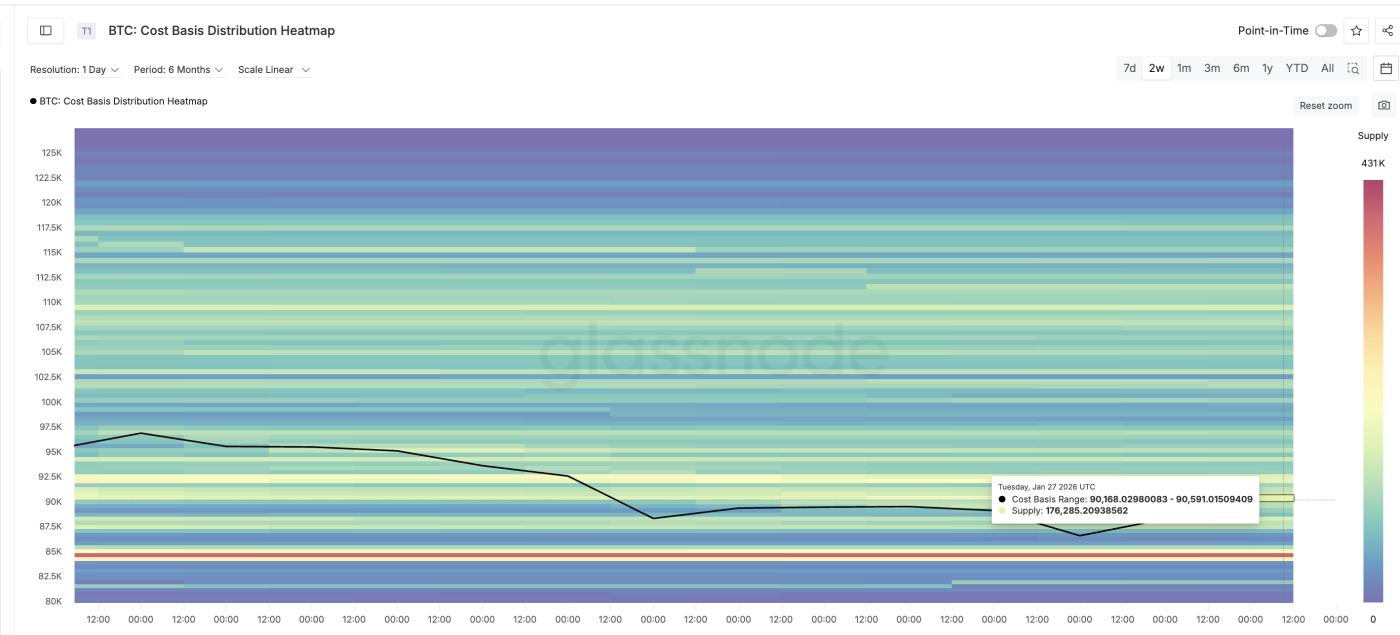 BTC's major selling zone: Glassnode
On the downside, the support zone is quite solid. The price range of $84,440 to $84,840 currently has nearly 395,000 BTC held at the Capital price, forming a strong buffer. This is also why recent Bitcoin price drops have been "stopped" and stabilized above this price level.
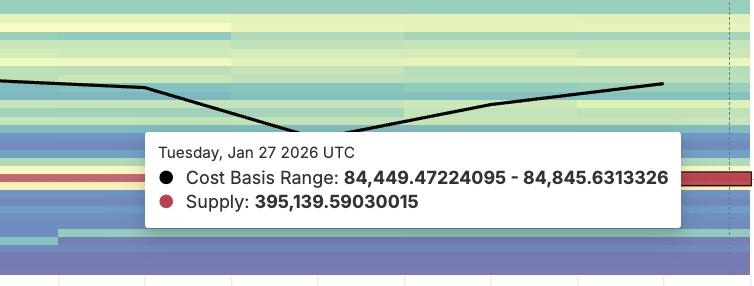 Support cluster: Glassnode
The "whales" are buying, but they need the price of BTC to break above $90,590 to make a profit and change the market trend.
Bitcoin's price levels will determine whether this zone will be broken or continue.
The price of Bitcoin is currently stuck between strong buying pressure and uncertainty stemming from macroeconomic factors.
On the upside, the first resistance level is $89,380, the area that the most recent rally failed to break through. If the price continues to rise, $90,830 is a crucial area that needs to be breached. This area has been repeatedly rejected since January 21, 2024, and coincides with the aforementioned "Sell Wall" based on Capital . If the closing price of the day is above this level, it would indicate that some supply has been absorbed.
If this happens, the next upside target will be around $97,190. This is an area where resistance clusters have appeared previously.
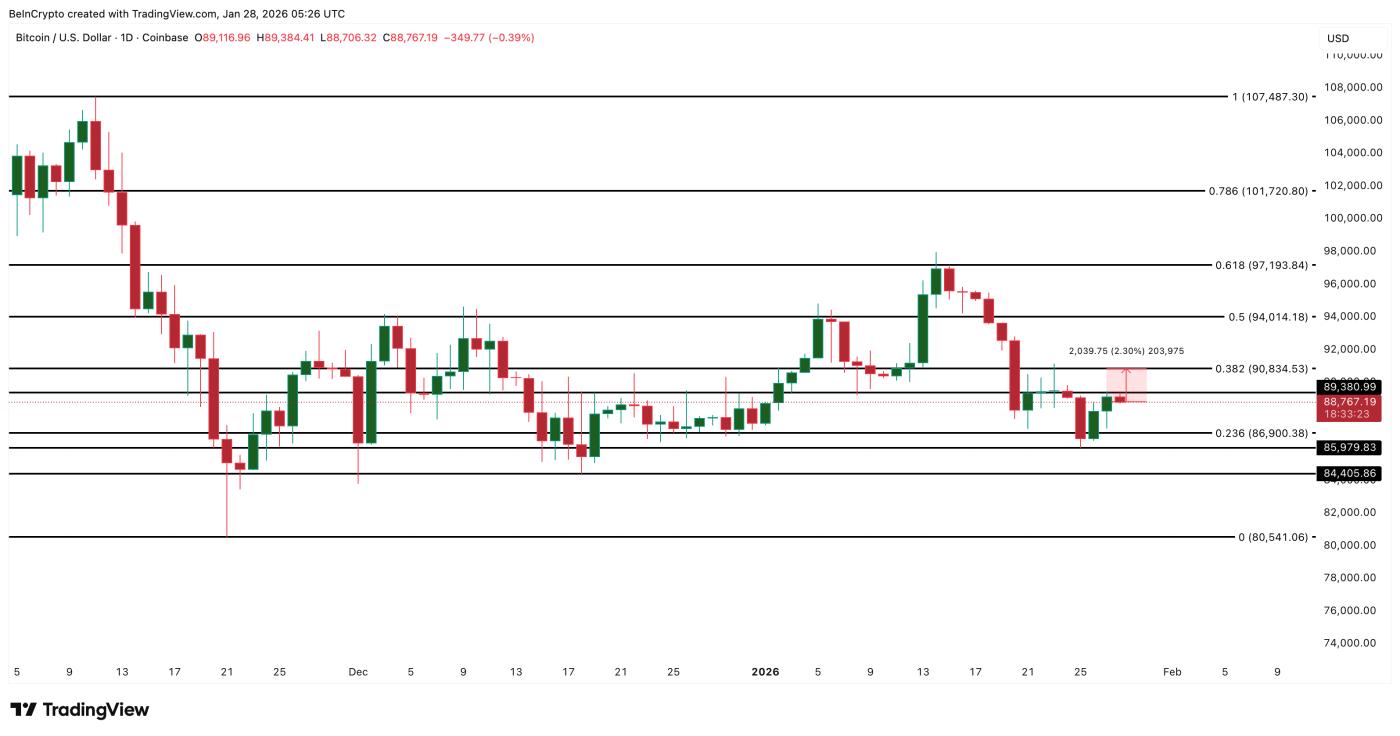 Bitcoin Price Analysis: TradingView
On the downside, risk remains manageable as long as Bitcoin stays above $84,400. This is the largest Capital level and also the "boundary" where long-term investors are most vulnerable. If the day closes below this level, the accumulation narrative will weaken and downside risk could return.
Until the macroeconomic picture changes or the $90,830 level is broken, Bitcoin's potential for recovery remains limited.


