Meme coins are back on traders' radar as February 2026 begins. The meme coin segment has surged 4.2% over the past seven days, outperforming most of the crypto market. However, this recovery is uneven. Some prominent meme coins are showing early signs of reversal, others are surging thanks to media narratives, while some are showing signs of stalling.
BeInCrypto experts have selected three noteworthy meme Token based on price movements, timing, and early buying positions of retail investors.
Dogecoin (Doge)
Dogecoin started February with signs that momentum had shifted after weeks of pressure. The meme coin surged nearly 8% between January 25th and 28th, helping Doge outperform most of the crypto market in the last 24 hours. Over the past 30 days, Dogecoin has erased most of its previous losses and is currently trading sideways.
One on-chain indicator explains why this recovery is noteworthy.
Dogecoin 's Spent Coins Age Band index has dropped sharply over the past week. This index tracks the number of coins moved by all holder and is often used to assess selling activity in the market.
On January 26th, approximately 158.87 million Doge were traded. To date, that number has dropped to around 62.28 million, a decrease of over 60%.
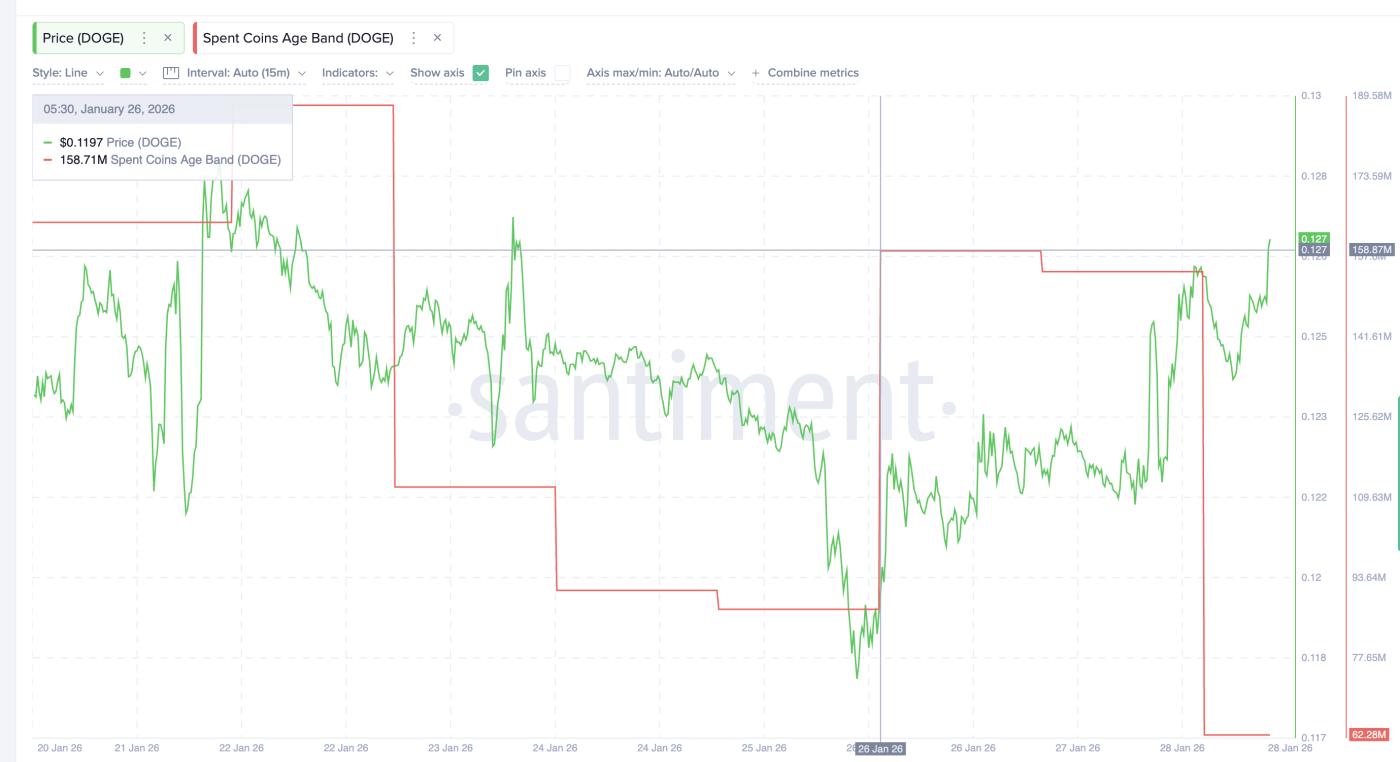 Coin Doge Activity: Santiment
Want more Token analysis like this? Sign up for editor Harsh Notariya's Daily Crypto Newsletter here .
This is important because when the Doge price rose, trading activity dropped sharply. If holder want to sell when the price recovers, trading activity should increase, not decrease. This decrease indicates that more retail investors have more confidence.
The chart also reinforces this view. From December 18th to January 25th, Dogecoin price consistently hit lower Dip , while the RSI hit higher Dip . The RSI measures momentum strength, and the difference between these two factors is a sign of bullish divergence.
Simply put, selling pressure gradually decreases before the price reverses. This signal often appears whenever there is a trend reversal if Doge breaks above a key price level.
For Doge to continue its upward trend, it needs to break through key resistance levels. If the price surpasses $0.137 and then $0.148, the potential for a recovery remains.
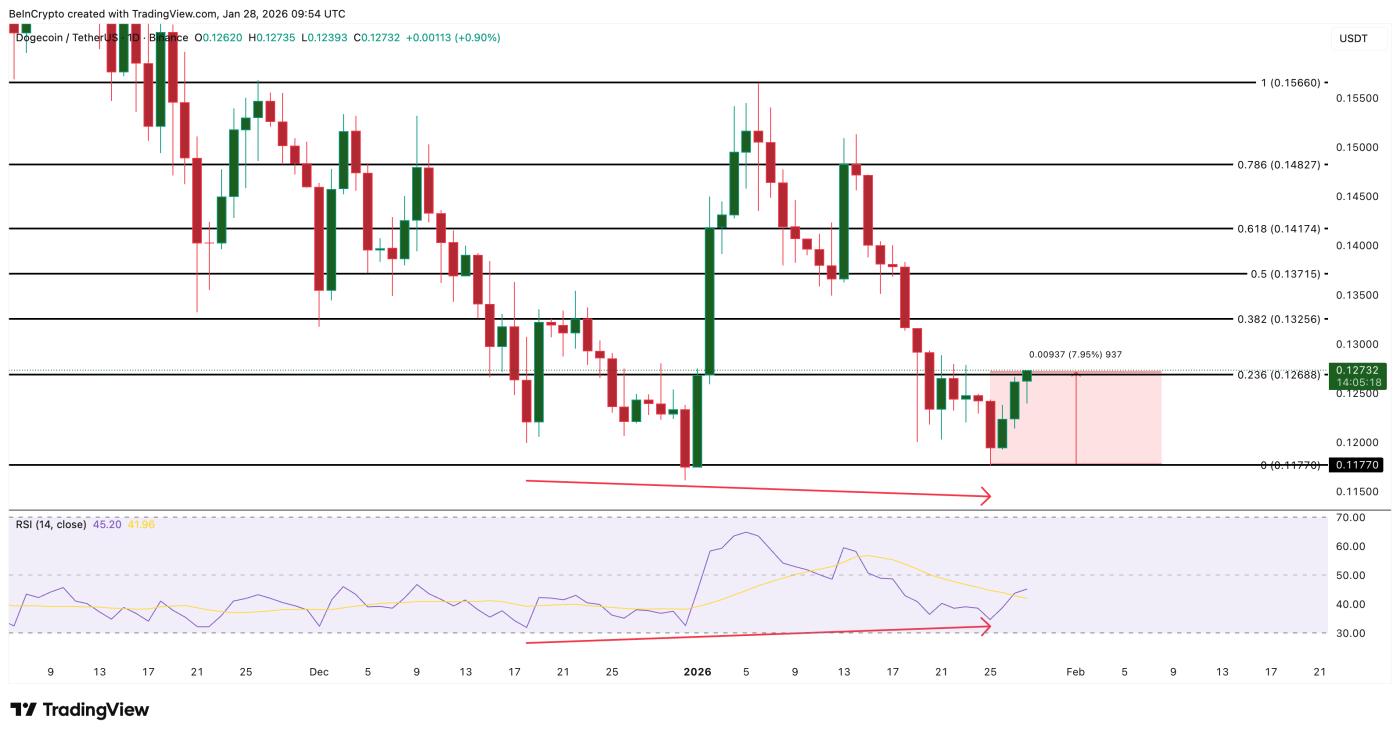 Doge Price Analysis: TradingView
If Doge maintains above the $0.156 USD price level, the price structure will be entirely bullish. Conversely, if the daily candle closes below $0.117 USD, the entire recovery scenario will be broken, reopening the risk of a price drop. Regardless of the scenario, Doge remains one of the few noteworthy meme coins entering February.
Official Trump (TRUMP)
Among the meme coins worth watching, TRUMP stands out this February thanks to a rare combination of media attention and early signs of a technical recovery.
The main catalyst is coming from outside. The documentary about Melania Trump is set to be released in the next few days, which could bring more attention to Trump-related Token .
History shows that money flows driven by media narratives tend to focus on the asset class that attracts the most public interest, which could make TRUMP a major beneficiary Token if investors get heavily involved.
This interest is clearly reflected in the on-chain data. In the last 24 hours, Trump's whales have increased their holdings by 7.72%, indicating they are buying early rather than chasing the event. This accumulation is happening before the price has surged significantly, reflecting expectations for the future.
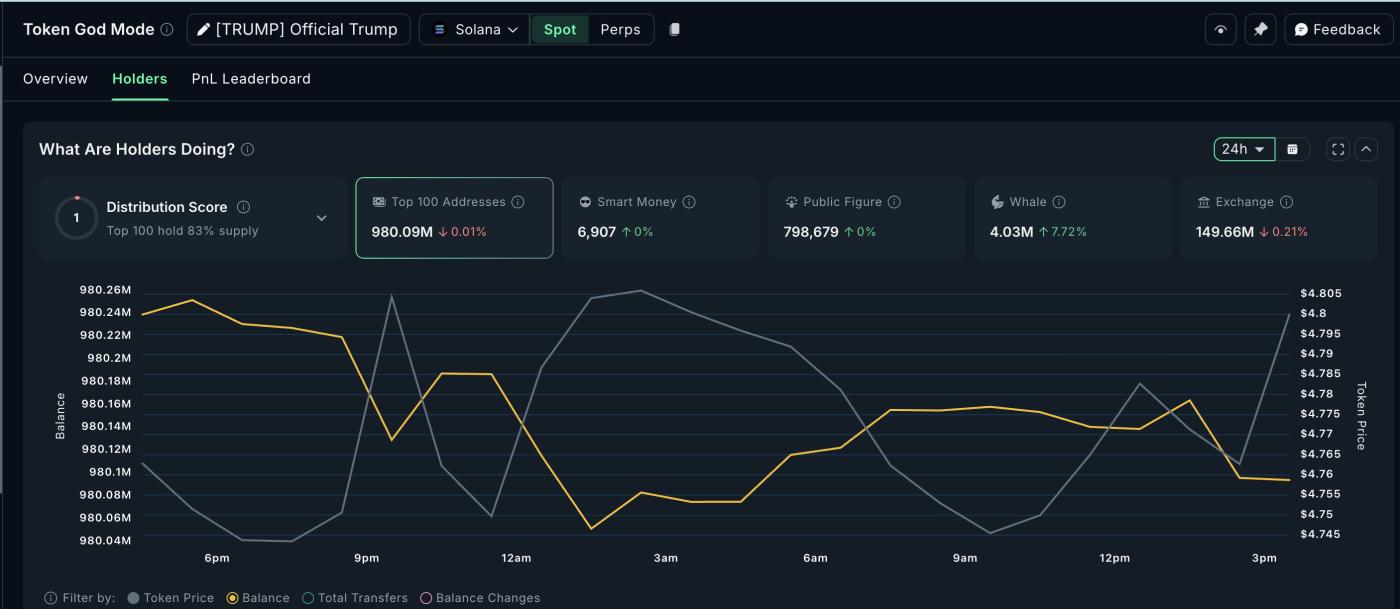 Trump Shark: Nansen
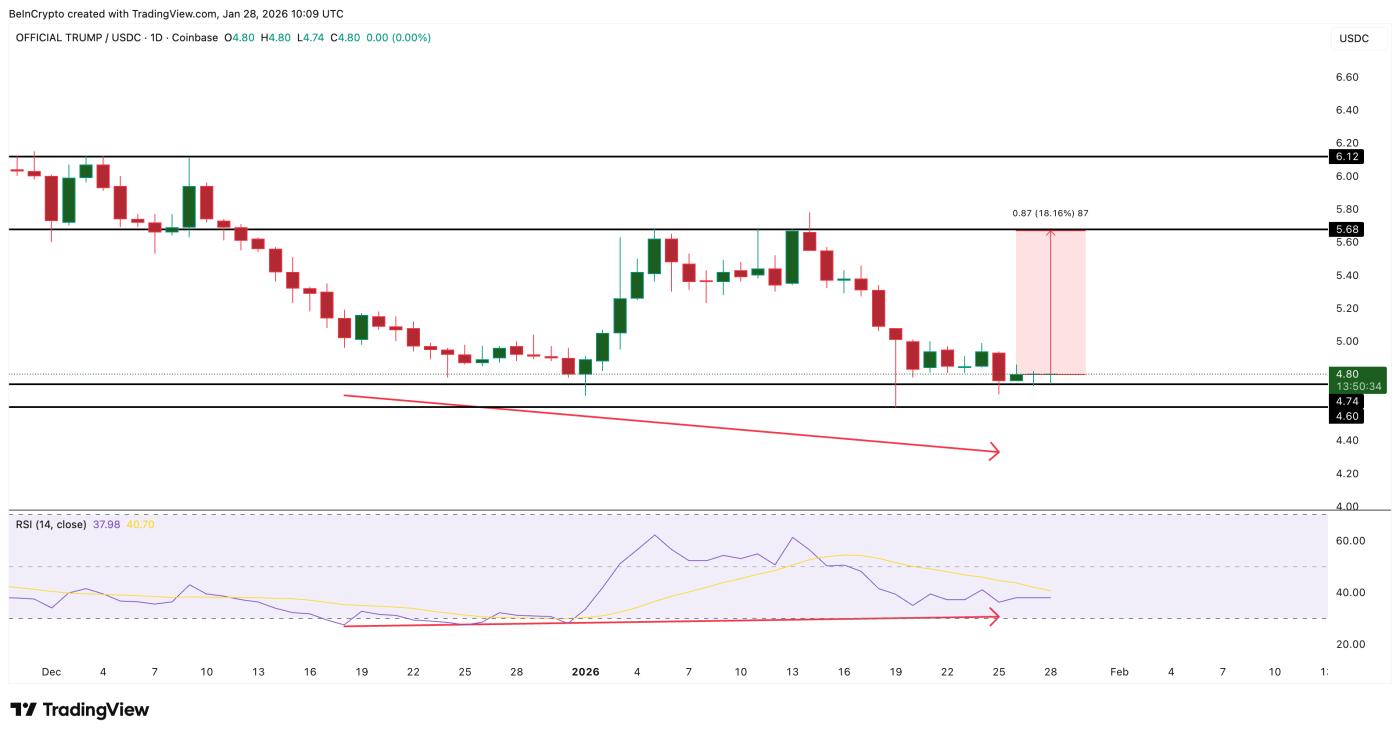
The chart clearly illustrates this. From December 18th to January 25th, the TRUMP price formed a lower Dip , but the Relative Strength Index (RSI) formed a higher Dip , a typical bullish divergence.
Subsequently, the price stabilized and indecisive candlesticks appeared in the short timeframe, indicating strong tug-of-war between buying and selling pressure.
Currently, key price levels have defined the trading strategy. Trump needs to hold above $4.74 to maintain the recovery structure. If the daily candle closes below $4.60, the bullish divergence signal is broken and the risk of a price drop may reappear.
On the upside, the most challenging resistance level is $5.68, a level that has been repeatedly rejected in the past. If this level is breached, the price could rise by an additional 18%, opening the way towards the $6.12 region.
 Trump price analysis: TradingView
Currently, Trump should only be observed rather than attempting a breakout. Whales are getting into positions early, money flow is improving, and the events of February 2026 could be the deciding factor in whether prices will reverse or if this is just another failed rally.
Pippin (PIPPIN)
Among the notable meme coins heading into February 2026, Pippin stands out for one reason: Strength has returned, but the risks are also increasing.
In just the last 24 hours, PIPPIN has surged over 60%, erasing almost all of January's losses and bringing its monthly performance back to a +22% increase. This move quickly propelled the Token back to its historical peak near $0.55, bringing it back into the sights of traders after weeks of stagnation.
The actions of whales help explain this recovery. In the past 24 hours, whales holding Pippin have increased their total Token holdings by 6.88%, indicating their confidence in the possibility of this rally lasting rather than just a temporary bounce. This accumulation suggests that large investors are betting that the upward momentum will overcome short-term technical risks.
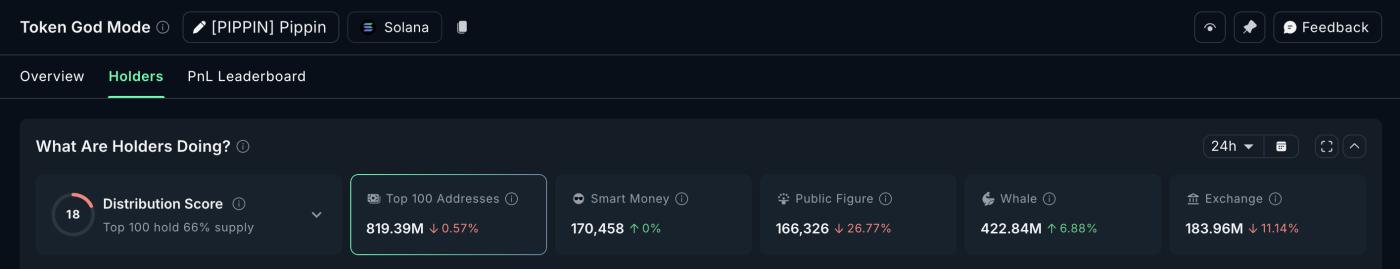 Pirate Shark: Nansen
However, the chart also shows why February carries significant technical risks.
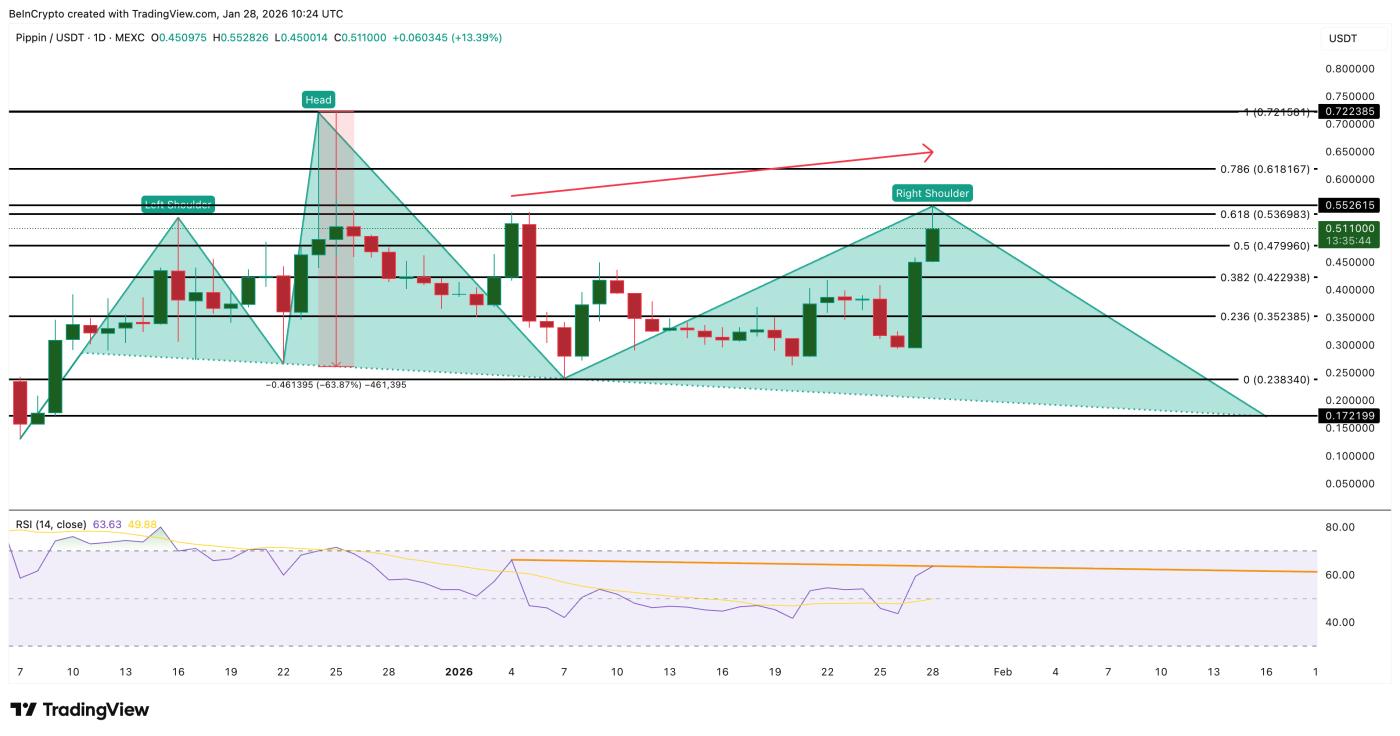
PIPPIN is forming a Vai-and- Vai pattern, with a breakout near the $0.55 level creating the right Vai . Simultaneously, from January 4th to January 28th, the price is heading towards a new high, while the RSI indicator has formed a lower high than before. This divergence creates a bearish divergence, which often appears when upward momentum weakens even as the price continues to rise.
This doesn't guarantee a price reversal, but it's a signal investors should pay attention to.
 PIPPIN price analysis: TradingView
Currently, key price levels are worth noting. If Pippin holds above $0.55 and continues to rise, the negative scenario will weaken. A strong breakout towards $0.72 would completely invalidate this pattern, opening up further upside potential for Pippin.
Conversely, if Pippin fails to hold above $0.42, a sharp correction to $0.35 is entirely possible. The greater risk only arises if the price falls significantly close to the neckline near $0.17.
In short, whales are buying when prices rise, not out of fear. However, February will be a crucial test to XEM Pippin's upward momentum will last or has reached its limit.