Bitcoin trading volume is sluggish and consolidating; spot buying is slowly recovering, while the options market is increasingly leaning towards defensiveness.
Written by: Glassnode
Compiled by: AididiaoJP, Foresight News
summary
- Bitcoin's price remains near key on-chain cost, and this support level is being tested. Sufficient market confidence is needed to prevent further structural weakness.
- Short-term holders are emotionally vulnerable. If prices fail to recover above the key break-even point, recent buyers may face renewed selling pressure.
- Overall, holders remain conservative in their behavior. This suggests that the market is currently in a phase of accumulating shares, rather than an expansionary upward trend.
- Liquidity remains a key variable. Despite decreased participation, prices have remained stable. However, further buying pressure is needed for a sustained breakout.
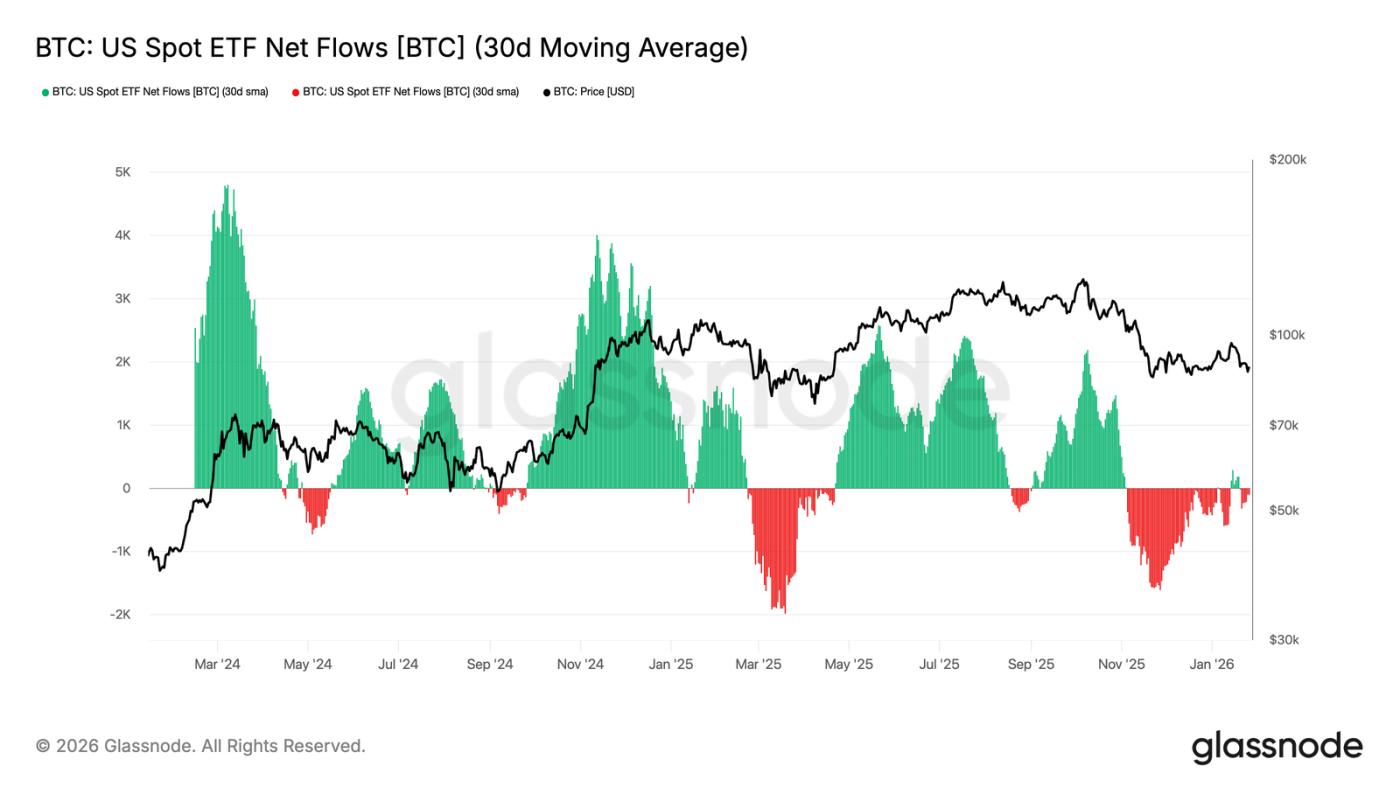
- Fund flows into spot ETFs have stabilized. After a period of continuous outflows, the 30-day average fund flow has returned to near a neutral level, and mechanical selling pressure has eased.
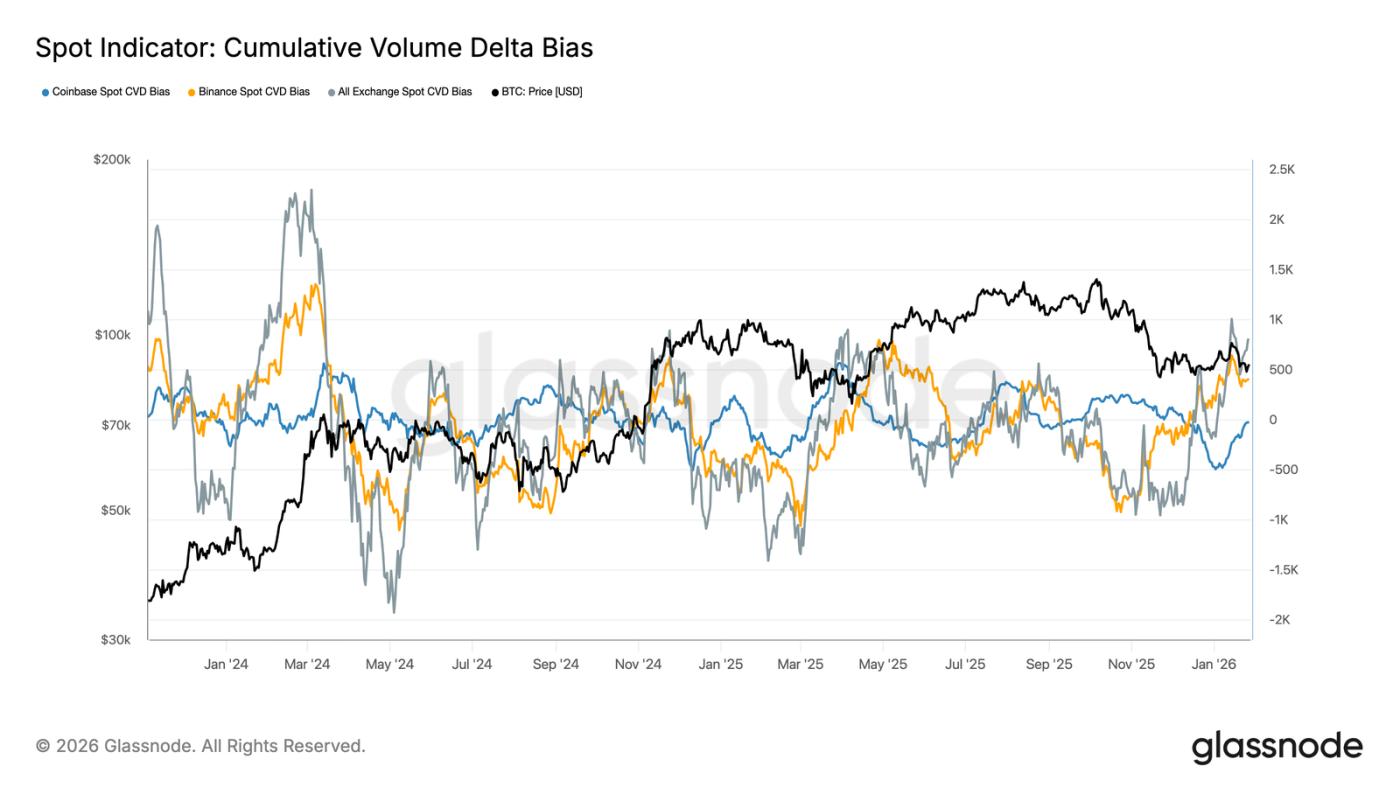
- The spot CVD (cumulative volume difference) of various exchanges is trending towards improvement, led by Binance, indicating that marginal buying pressure is returning. Coinbase, on the other hand, remains relatively stable.
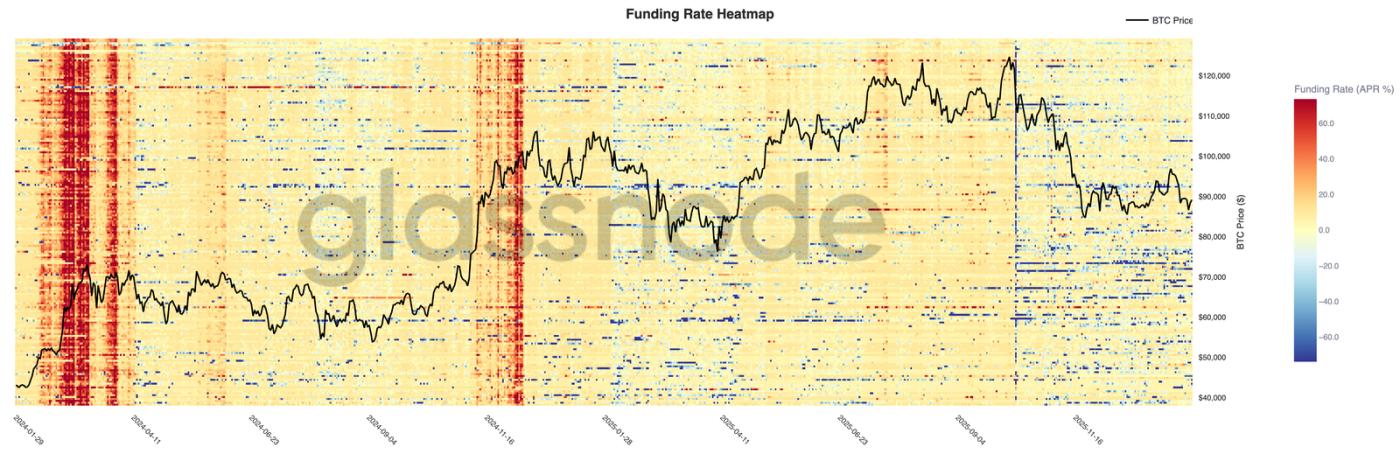
- The leverage level of perpetual futures remains low, and the funding rate is basically neutral. Speculative positions remain cautious and are easily shaken out by volatility.
- The options market is shifting towards downside protection: put skew, rising short-term implied volatility, and traders’ Gamma values turning negative have increased sensitivity to price declines.
On-chain insights
Weakening again
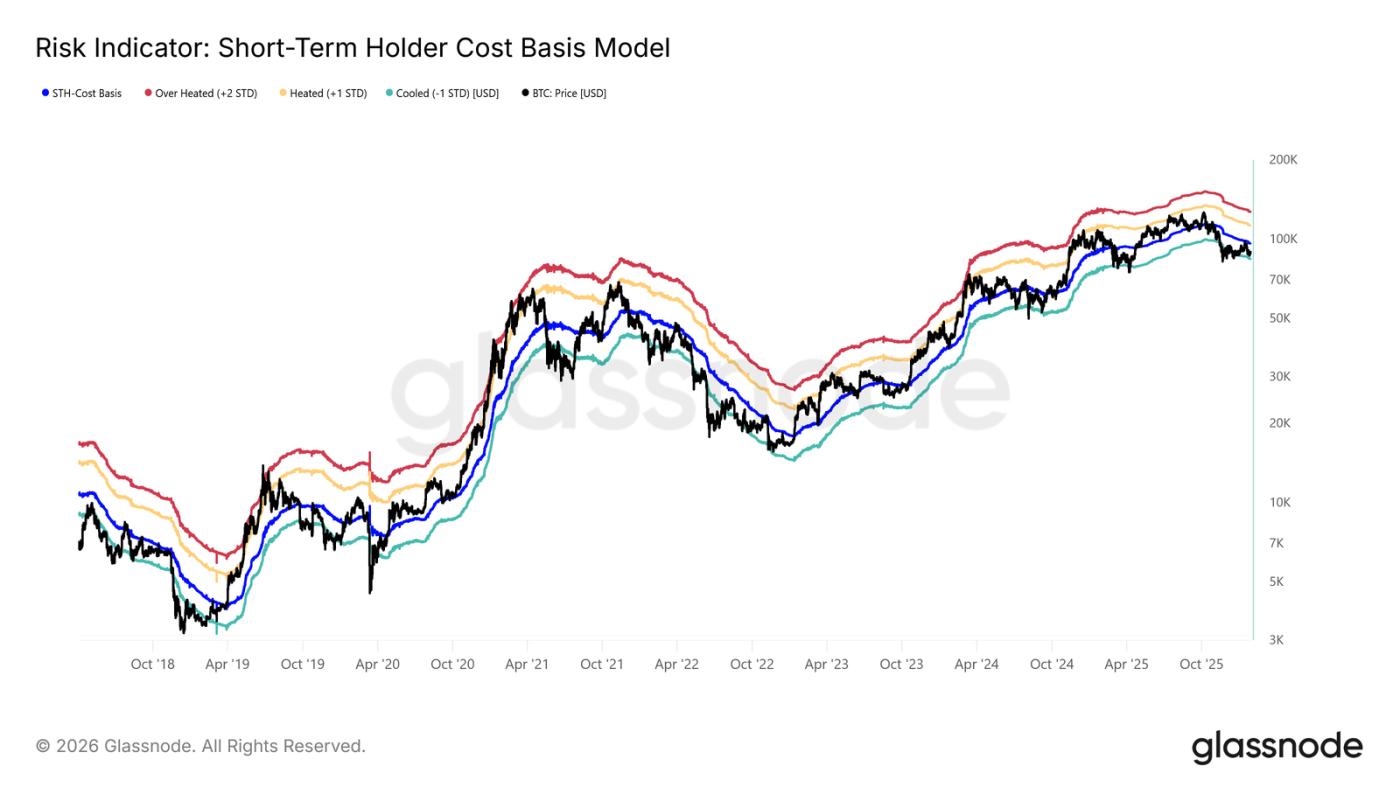
After spot prices failed to stay above the cost price for short-term holders, the market has entered a slight correction.
The current price is below the key bull-bear dividing line of $96,500, and the market structure is very similar to that of the first quarter of 2022 and the second quarter of 2018.
As shown in the chart, the lower edge of the current consolidation range (-1 standard deviation) is at $83,400. This is a key support level in the near term; a break below this level could trigger a deeper pullback, potentially testing the true market average of $80,700.
Support level sensitivity
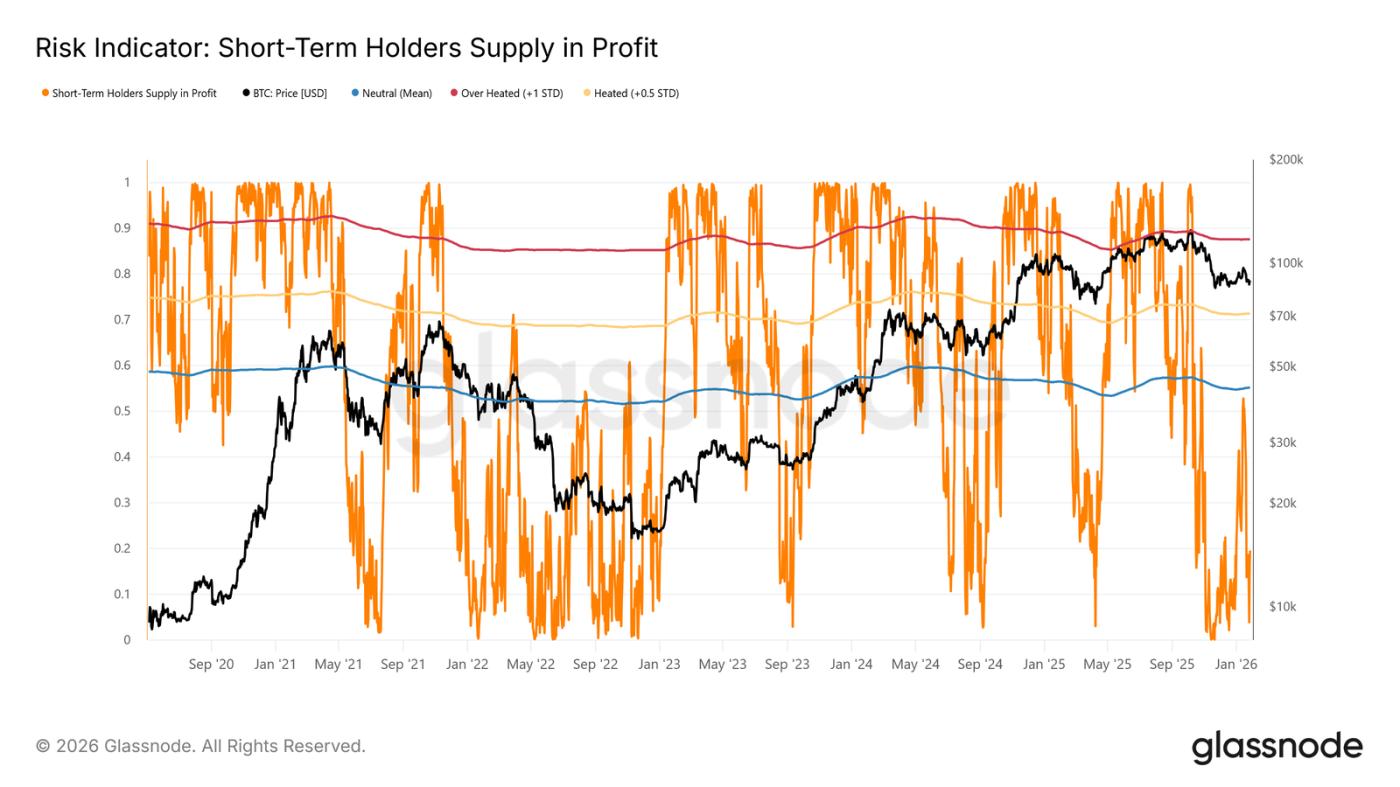
The market is so sensitive to the lower limit of short-term holders' cost price and the true market average because a high proportion of recently purchased shares are at a loss. In this situation, historically price-sensitive short-term holders are more likely to sell at a loss, thus increasing selling pressure.
Therefore, these price levels are the last line of defense against a deep bear market similar to that of 2022-2023.
Currently, the proportion of short-term holders holding losing positions has dropped to 19.5%, far below the neutral threshold of 55%. This indicates that although downside risks remain, a large-scale panic sell-off by short-term holders has not yet occurred.
Liquidity is key
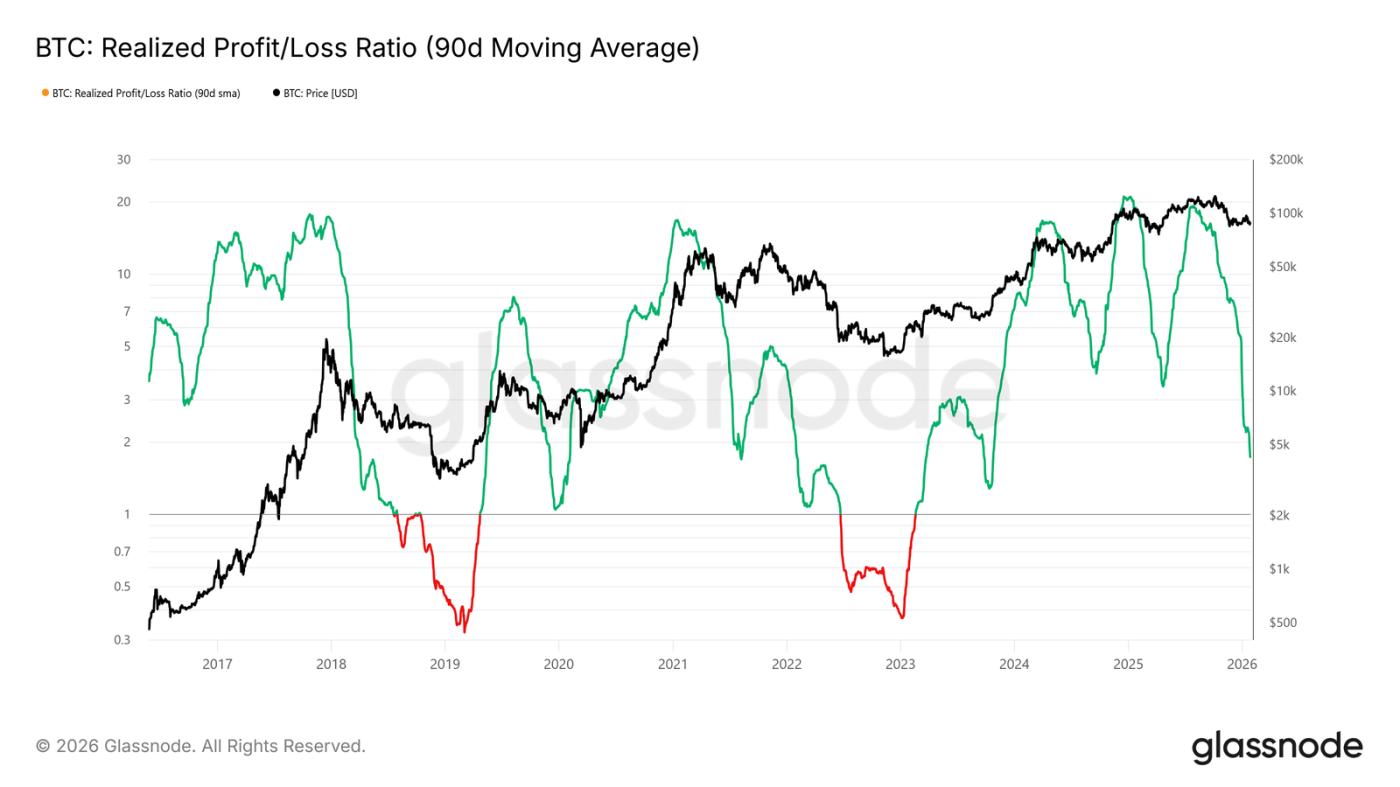
Given the importance of holding the key support zone of $80,700 to $83,400, liquidity is currently the focus. Any substantial shift toward a sustainable rebound should be reflected in liquidity-sensitive indicators, such as the realized profit/loss ratio (90-day moving average).
Historically, strong upward phases, including the cyclical rebounds of the past two years, have required this indicator to rise and remain around 5. This signifies that new funds are flowing back into the market.
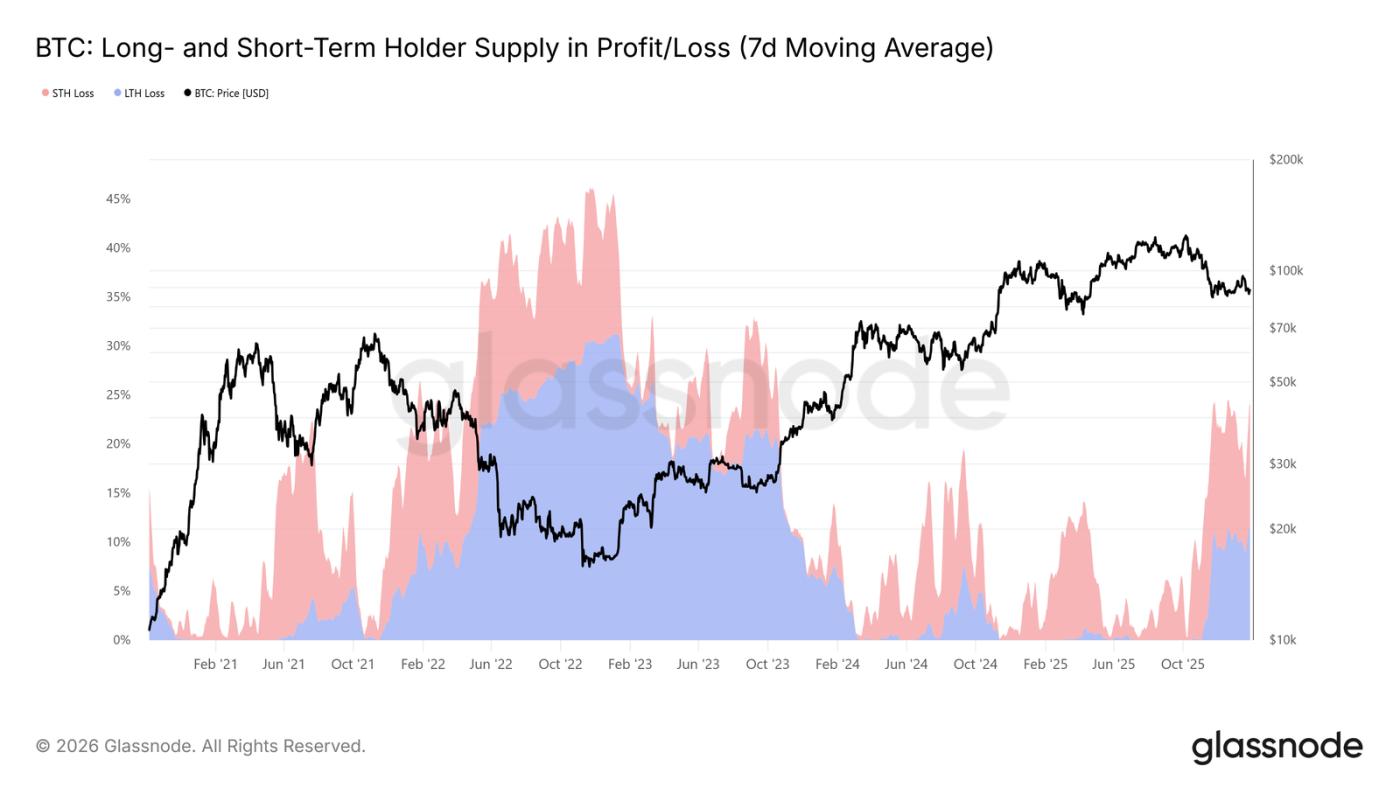
Supply under pressure
Another key on-chain metric influencing the medium-term market structure is the "profitable/lossable supply of long/short-term holders." This data shows that currently over 22% of the circulating supply is in a loss-making state, similar to the situation in Q1 2022 and Q2 2018.
As the chips bought at the top gradually "settle" into long-term holdings, and investors choose to hold the coins bought during the previous rise, the proportion of losses for long-term holders increases over time.
These steadfast holders are currently under pressure from both time and price. If the price breaks below the aforementioned key support level (the lower edge of short-term holders' cost price and the true market average), it may lead long-term holders to also choose to stop loss, increasing the downside risk in the medium term.
Off-chain insights
Outflows from spot ETFs slowed
Net inflows into the US spot Bitcoin ETF have returned to balance. After a prolonged period of net outflows, its 30-day moving average is nearing zero. This indicates that the structural selling pressure from the ETF has significantly eased.
It's worth noting that the recent rebound in fund inflows is far less robust than the accumulation waves seen at the beginning and end of 2024. This suggests that institutional demand remains cautious rather than aggressively chasing the rally. The fact that BTC prices have remained in a relatively high range despite weakening inflow momentum seems to rely more on the conviction of spot holders than on new demand from ETFs.
If fund flows return to a sustained net inflow, it will be beneficial for the continuation of the upward trend. Conversely, if this fails to happen, BTC may continue to consolidate, as the market lacks the external liquidity injection that previously drove the price up.
Improved cash flow in the spot market
The CVD bias on major exchanges is rising, indicating that buying pressure is returning to the market after a prolonged period of weakness. Binance led the rebound, recovering rapidly from deep negative values; the aggregated CVD bias across all exchanges has also turned positive.
However, Coinbase's CVD bias remains range-bound, indicating relatively stable spot demand in the US, but less active than in the offshore market. This discrepancy suggests that marginal buying power is returning, but its primary driver is global risk appetite, rather than decisive buying from the US.
If buying pressure continues to dominate, it will support further price stabilization and even upward movement. However, in this cycle, the market has repeatedly failed to maintain a positive CVD trend, so whether subsequent buying pressure can be sustained will be crucial.
The perpetual futures market remains calm.
Perpetual funding rates across most exchanges remained neutral, despite significant price volatility. This indicates that leverage has been cleared, long and short positions are relatively balanced, and neither side is continuously paying high funding fees.
It is worth noting that brief peaks in positive funding rates may occur during localized rebounds, reflecting short-term bullish buying. However, these peaks are unsustainable, confirming the view that speculative sentiment is fragile and easily dissipates.
With funding rates compressed and uneven, the market is increasingly reliant on spot demand to drive trends. A sustained positive funding rate indicates leverage restructuring and a return to risk appetite; a sustained neutral rate suggests the market may be entering a slow and volatile consolidation phase.
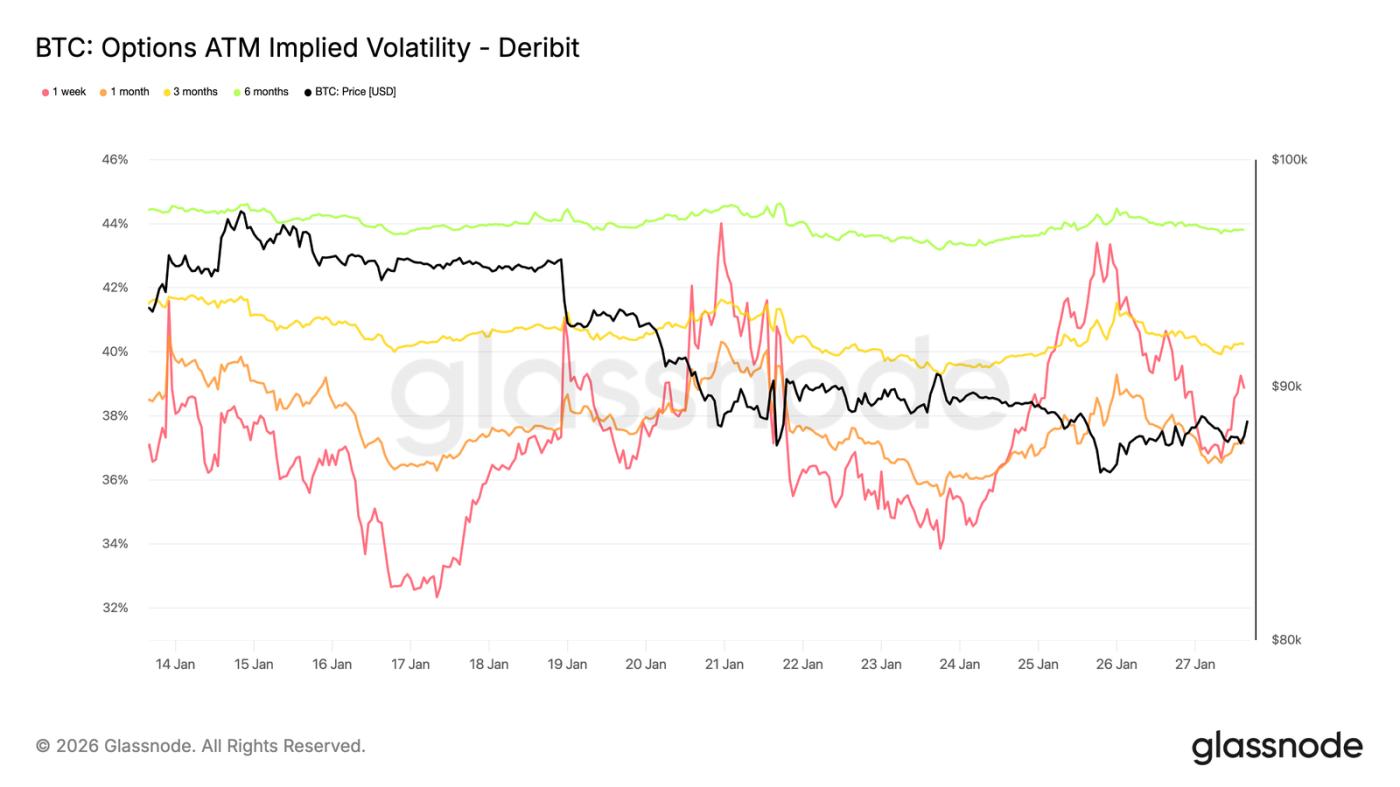
Implied volatility: rising in the short term, stable in the long term
Last weekend, short-term parity implied volatility rose sharply, reflecting increased market sensitivity to the overall short-term risk environment (rather than just cryptocurrencies themselves).
This change coincides with rising geopolitical uncertainty and escalating macroeconomic risks, which typically affect the near end of the volatility curve first. Volatility repricing is primarily concentrated in short-term options, while long-term option volatility remains relatively stable.
This indicates that the market is reassessing short-term uncertainties rather than changing long-term risk expectations. It is a reaction to external risks and there are no signs of internal pressure or structural imbalance.
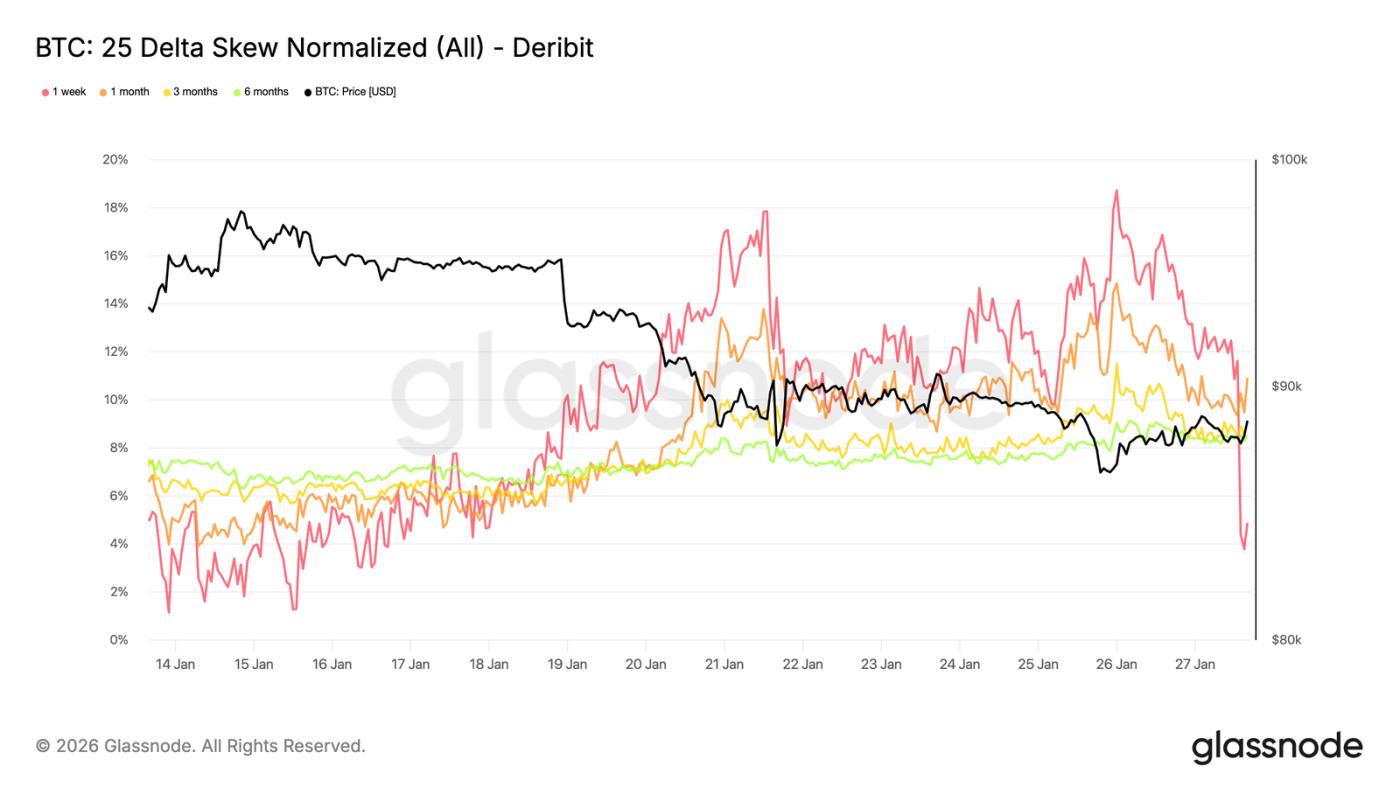
25 Delta Skew: Bearish Sentiment Spreads
As volatility adjusts, skewness becomes a clearer reflection of market sentiment. The 25 Delta skewness across all maturities has turned bearish, indicating a relatively increased demand for downside protection.
This shift suggests a more cautious market outlook for the medium to long term, despite orderly spot price movements. The adjustment is gradual, indicating planned hedging rather than panic buying of put options.
Short-term skew (especially the one-week timeframe) is volatile, while the overall curve is slightly bearish compared to last week. This difference indicates that the market is expressing caution across different timeframes, but has not fallen into extreme tension.
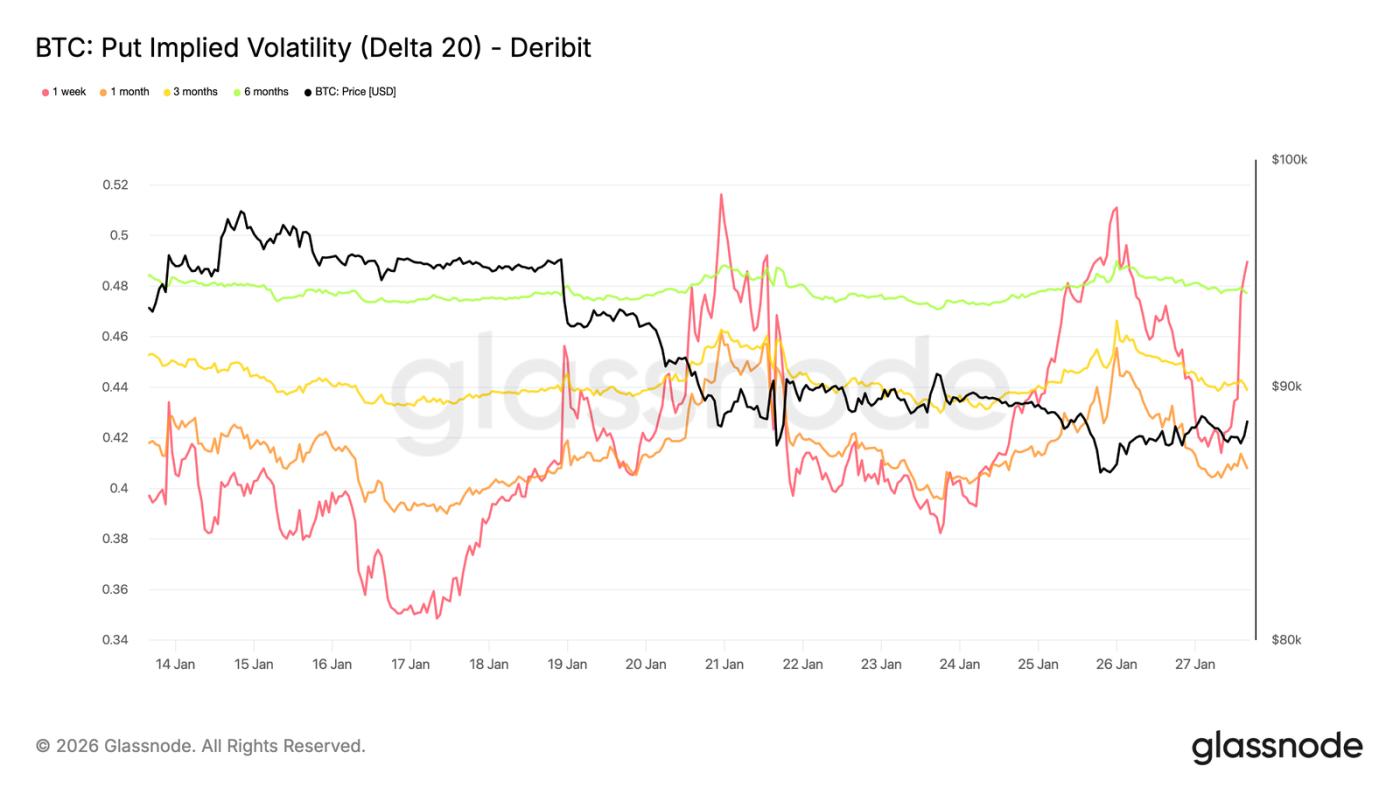
Downside Implied Volatility: Protected, but not priced into a crash.
By interpolating specific delta implied volatility, the volatility surface across different maturities can be smoothly observed. Here, we focus on 20-delta put options, which clearly reflect long-term downside protection needs.
Despite the bearish skew, implied volatility across all maturities remains relatively mild. Even looking at options up to the end of 2026, the market has only priced in the possibility of a slight decline.
This reveals an important detail: participants are willing to pay higher fees for downside protection than for call options, but do not expect a sharp decline. Market sentiment is clearly defensive, but expectations for the magnitude of the decline remain limited.
This is consistent with the recent trend of "orderly decline rather than panic selling" in the spot market.
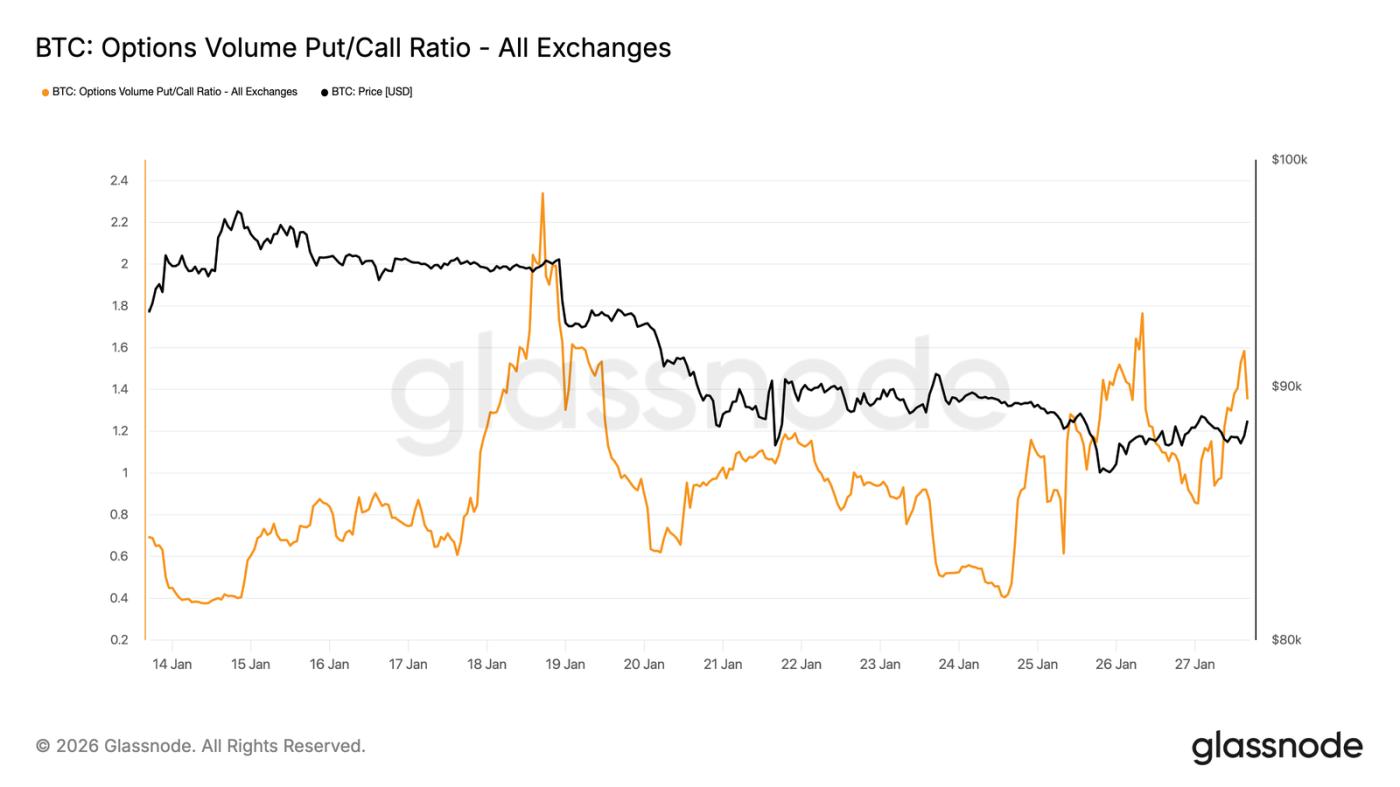
Put option trading volume leads
Looking at trading volume, the put/call ratio in the options market also confirms this defensive stance. Put option trading volume has increased relative to call option trading, but there hasn't been the surge in trading volume typically associated with panic hedging.
Trading volume was active yet orderly, indicating that traders were gradually adjusting their positions rather than engaging in emotional buying and selling. This aligns with the market's cautious tone of acknowledging downside risks while proceeding in a controlled and gradual manner.
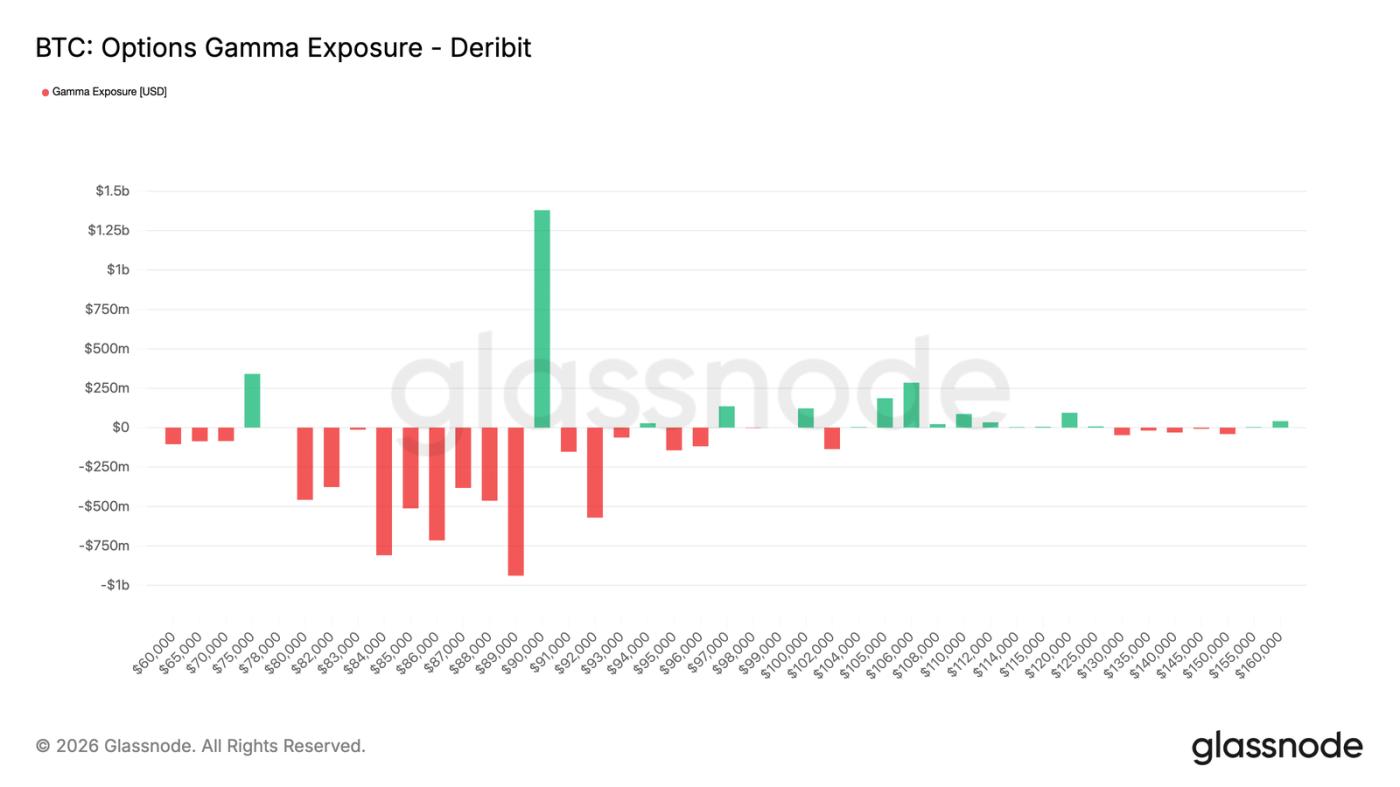
Trader Gamma: Below $90,000 is favorable for a decline.
Traders' Gamma exposure reveals a key structural feature of the current market. Traders are holding short Gamma positions across a broad range, from $90,000 down to approximately $75,000. This range happens to be a significant support level.
In a bearish Gamma environment, traders' hedging behavior amplifies price volatility. When the spot price falls, traders sell futures or spot to hedge their short put option risk, mechanically exacerbating the downward trend. This explains why pullbacks can deepen even without massive sell-offs.
Meanwhile, there remains a significant bullish Gamma concentration zone around $90,000. This means that a sustained and strong buying spree, rather than sporadic buying, is needed to break through this price level upwards.
Before the aforementioned conditions are met, the market structure is more conducive to a slow, controlled decline in prices rather than a rapid reversal.
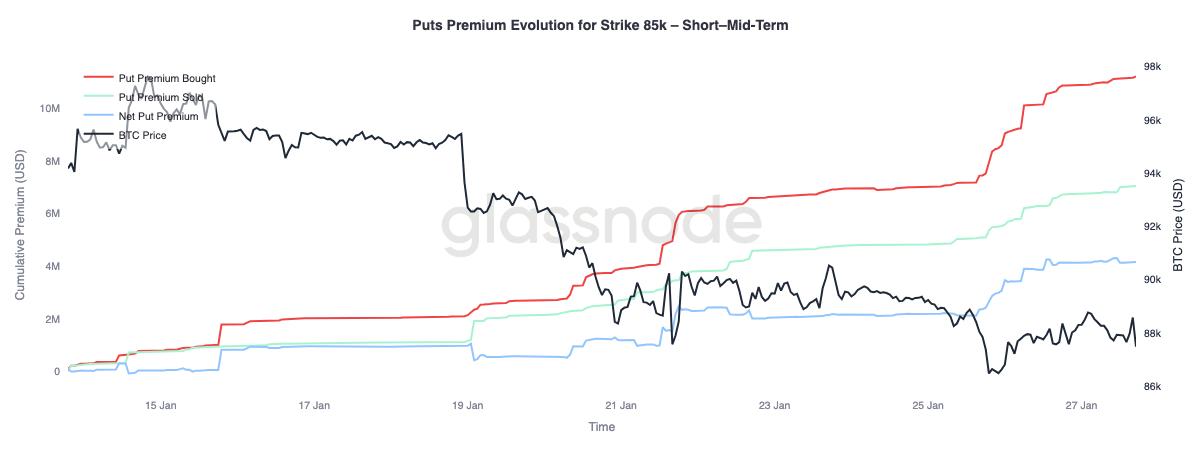
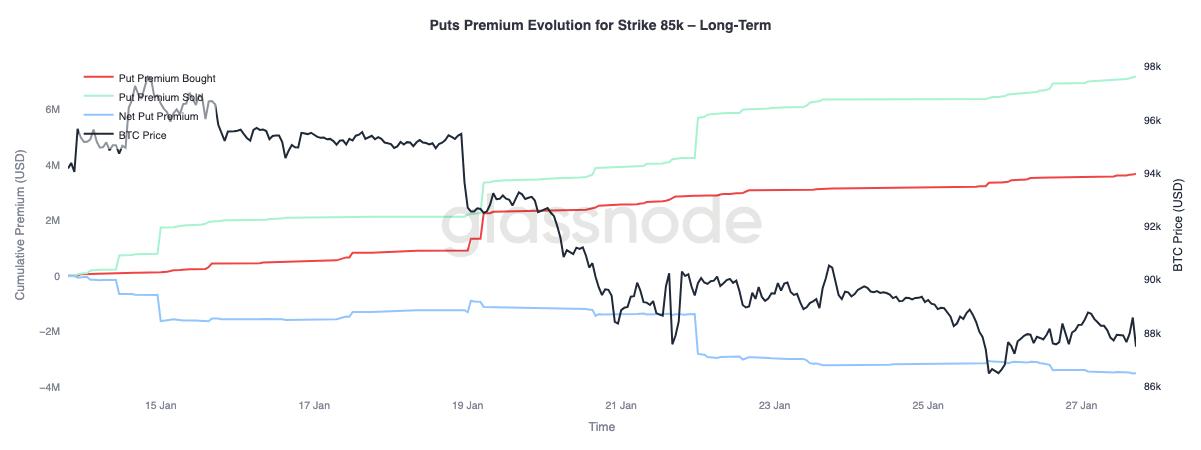
Put option premium: short-term buy, long-term sell
Focusing on the changes in put option premiums with a strike price of $85,000, we can observe a divergence in terms of maturity: for short-term options with a maturity of less than three months, net purchases of premiums dominate, driving up the net premium; while for long-term options with a maturity of more than three months, there is a net sale of premiums.
This reflects the market's reaction to Bitcoin's drop from the mid-range of $90,000 to the high-range of $80,000: hedging against short-term downside risk while simultaneously being willing to sell long-term downside protection. This structure suggests that the market is only cautious in the short term, and long-term risk expectations have not worsened.
in conclusion
Bitcoin continues to consolidate near key on-chain price levels, with a delicate balance between holder conviction and marginal demand. Short-term holders remain vulnerable, and a break below support levels could trigger a new round of selling.
However, overall fund flows have stabilized: ETF selling pressure has eased, and there are initial signs of improvement in spot market positions (especially in the offshore market), indicating that buying interest is recovering. Meanwhile, the derivatives market has been restrained, with neutral funding rates suggesting low market leverage and reduced reliance on speculative funds for prices.
Options positions reinforced market caution: the skew shifted to bearish, short-term protection demand increased, and traders' Gamma turning negative increased the risk of heightened price volatility.
The future trend depends on whether demand from the spot and ETF channels can be sustained. If fund flows return to a sustained net inflow and spot buying strengthens, it will support the continuation of the trend; conversely, if market fragility persists and the demand for hedging against declines increases, it may face further consolidation or a deeper correction.