

Author: Umbrella, TechFlow TechFlow
Original title: Understanding Premium Rates : Get 24 Hours Ahead of ETF Data
Since the approval of spot ETFs for BTC and ETH, daily ETF inflows and outflows have become a core indicator for many traders' order placements.
The logic is simple: net inflows represent institutional buying with a bullish outlook; net outflows represent institutional selling with a bearish outlook.
The problem is that the ETF data we see every day is the result of the previous day.
By the time the data is released, the price has often already been priced in.
So, is there any way to predict in advance whether ETFs will see net inflows or net outflows today?
Yes, the answer is ETF premium rate.
Verifying this pattern is not difficult; looking back at January 2026, which is about to end, is the best example.
As of January 28, there were 18 trading days in the US stock market.
Statistics show that the premium index on Coinbase remained in positive territory for only two days, while it remained in negative premium territory for the remaining 16 days.
The corresponding ETF fund flow data shows that net outflows were recorded on 11 out of these 16 days.
In particular, from January 16 to 23, the negative premium rate fell below -0.15% for two consecutive weeks. Correspondingly, the ETF market saw a net outflow of more than $1.3 billion in a single week, and the price of BTC also fell from a high of $97,000 to around $88,000.
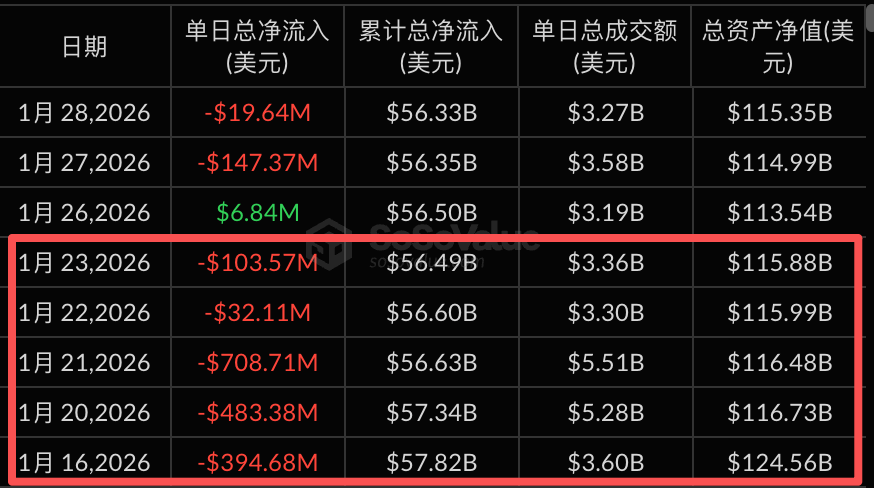
Data source: sosovalue
Let's take a longer-term view.
From July 1, 2025 to January 28, 2026, there will be a total of 146 trading days.
• The negative premium rate appeared for 48 days, corresponding to 39 days of net outflow, with an accuracy rate of 81%.
• Positive premium rates appeared for 98 days, corresponding to net inflows for 82 days, with an accuracy rate of 84%.
This is the value of the premium rate: it allows you to see where the money is going earlier than most people.
What is the premium rate?
After discussing premium rates for so long, what exactly are premium rates?
For example.
BTC is like loose apples in a farmers market, while BTC spot ETFs are like packaged apple gift boxes in a supermarket, with one apple in each box.
An apple sells for 100 yuan at the market; this is its net value (NAV).
The price of an apple gift box in a supermarket depends on supply and demand.
With so many buyers, the gift box was resold for 102 yuan, which is a positive premium rate, or a premium rate of 2%.
With many sellers, the price of the gift box dropped to 98 yuan, which is a negative premium rate, or -2%.
The premium rate reflects the degree to which the ETF market price deviates from the true price of BTC.
A positive premium indicates optimistic market sentiment, with everyone rushing to buy.
Negative premiums indicate pessimistic market sentiment and a rush to sell.
 The Relationship Between Premium Rate and ETF Inflows and Outflows
The premium rate is not only an indicator of market sentiment, but it can also be a key factor driving the flow of funds.
The key player here is the AP, or Authorized Participant, which you can think of as a privileged transporter.
The core logic of AP is risk-free arbitrage: they can buy and redeem ETF units in the primary market, and also buy and sell them in the secondary market.
They will engage in arbitrage whenever a price difference occurs.
When a positive premium occurs, the gift box is more expensive than the apple. AP will then buy BTC in the primary market, package it into ETF shares, and then sell them in the secondary market to profit from the price difference. In this process, BTC is bought, resulting in a net inflow of funds.
Conversely, when a negative premium occurs, the gift box is cheaper than the apple. AP will buy ETFs on the secondary market, unpack them, redeem them for BTC, and then sell the BTC to profit from the price difference. In this process, BTC is sold, resulting in a net outflow of funds.
Therefore, the logical chain is as follows:
Premium rate appears → AP initiates arbitrage → generates subscriptions or redemptions → results in net inflows or net outflows.

The ETF fund data we see every day is only released the day after settlement.
Premium rates are real-time, while funding data is lagging.
That's why premium rates allow you to stay ahead of the market.
How to apply the premium rate
Now that we understand the principles behind premium rates and ETF net inflows and outflows, how should we apply them to our individual trading plans?
First, the premium rate is not a metric used in isolation.
It can tell us the direction of funds, but not the magnitude or sustainability.
Here I suggest you look at it from the following perspectives together.
1. The persistence of the premium rate is more important than the daily figure.
A negative premium rate on a single day is likely just a short-term fluctuation.
However, if a negative premium rate appears for several consecutive days, it will likely correspond to a continuous net outflow, which warrants attention.
Looking back at the five consecutive negative premium rates from January 16th to 23rd this year, corresponding to five days of net outflow, BTC fell by nearly 10%.
2. Pay attention to extreme values of the premium rate.
Generally speaking, it is normal for the premium rate to fluctuate within ±0.5%.
Once the range is broken by ±1%, it indicates a significant deviation in market sentiment, which strengthens the incentive for AP arbitrage and accelerates capital flows.
3. Judge based on price position
The sustained negative premium rate at high levels may be an early signal of capital flight.
The sustained positive premium at low levels may be a sign that buy the dips hunters are entering the market.
The premium rate itself does not constitute a basis for buying or selling, but it can help you verify the current trend or identify the turning point of the trend in advance.
In conclusion
Finally, there are a few points to note.
No single indicator is the holy grail; the effectiveness of the premium rate is predicated on the proper functioning of the AP arbitrage mechanism.
In extreme market conditions, such as the crash on October 11th, market liquidity dries up, arbitrage mechanisms may fail, and the correlation between premium rates and capital flows will decrease.
In addition, the premium rate is only one window to observe the flow of funds in ETFs.
For sophisticated investors, the premium rate is just one piece of the puzzle.
We recommend using the following indicators for multidimensional cross-validation:
Changes in ETF holdings: An increase in holdings indicates that institutions are accumulating shares, while a decrease indicates that they are reducing their holdings. This is more direct than the premium rate, but the data is subject to a delay in updating.
Futures basis and funding rates: A positive basis coupled with a continuously rising funding rate indicates overheated bullish sentiment and potential market optimism. Conversely, a negative basis suggests that bears are in control.
The Put/Call ratio in the options market: Put options are for shorting other options, and Call options are for longing other options. A rising ratio indicates increased risk aversion in the market, while a falling ratio indicates that optimism dominates.
Large on-chain transfers and net inflows to exchanges: Large BTC transfers into exchanges usually indicate impending selling pressure. Large outflows from exchanges suggest that someone is hoarding coins.
For example.
When you observe that: the premium rate is consistently negative, ETF holdings are decreasing, and net inflows into the exchange are increasing.
Three signals point in the same direction: funds are withdrawing and selling pressure is accumulating.
At this point, one should at least be more vigilant and control their position size, rather than trying to buy the dips.
A single indicator cannot reveal the whole picture; cross-validation across multiple dimensions is necessary to improve the success rate of judgments.
In this market, the more dimensions you observe, the smaller the information gap becomes, but the time gap will always exist.
Whoever sees the direction of the funds first will have more initiative.
Twitter: https://twitter.com/BitpushNewsCN
BitPush Telegram Community Group: https://t.me/BitPushCommunity
Subscribe to Bitpush Telegram: https://t.me/bitpush


