
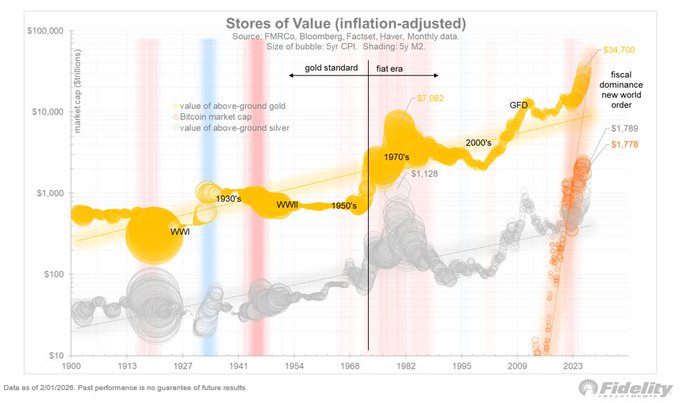
Sharing this chart showing the inflation-adjusted market capitalization of gold and silver since 1900, with Bitcoin added in 2010. The bubbles show the 5-year price inflation rate (CPI) and the shading show the 5-year monetary inflation rate (M2). Gold is at $35 trillion, and silver and Bitcoin are at $1.8 trillion (using some creative assumptions on my part to determine the “above ground” supply of silver). It’s amazing to me that it took Bitcoin 18 years to reach a market cap of $1.8 trillion it took silver five millennia. Apples to oranges of course, but still.
Sector:
From Twitter
Disclaimer: The content above is only the author's opinion which does not represent any position of Followin, and is not intended as, and shall not be understood or construed as, investment advice from Followin.
Like
Add to Favorites
Comments
Share
Relevant content


