Author | Jeff Park (Chief Information Officer, Bitwise)
Compiled by Odaily Odaily( @OdailyChina )
Translator | Dingdang ( @XiaMiPP )
Editor's Note: On February 5th, the cryptocurrency market experienced another sharp drop, with over $2.6 billion liquidated in 24 hours. Bitcoin briefly plummeted to $60,000, but the market seems to lack a clear consensus on the causes of this decline . Bitwise CIO Jeff Park offers a new analytical framework from the perspective of options and hedging mechanisms .
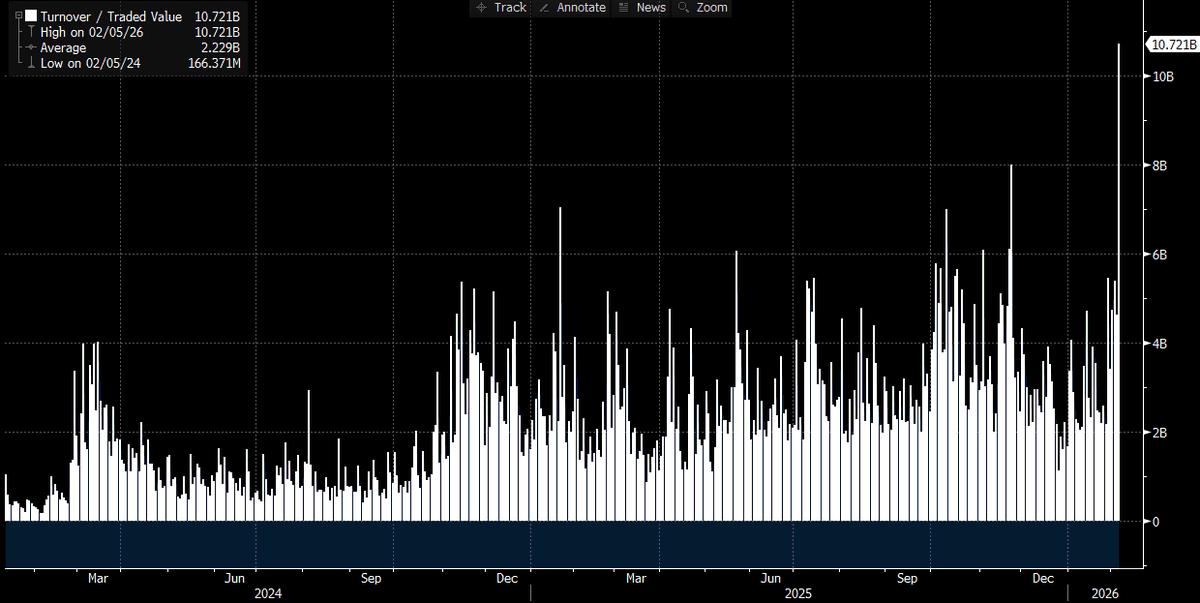
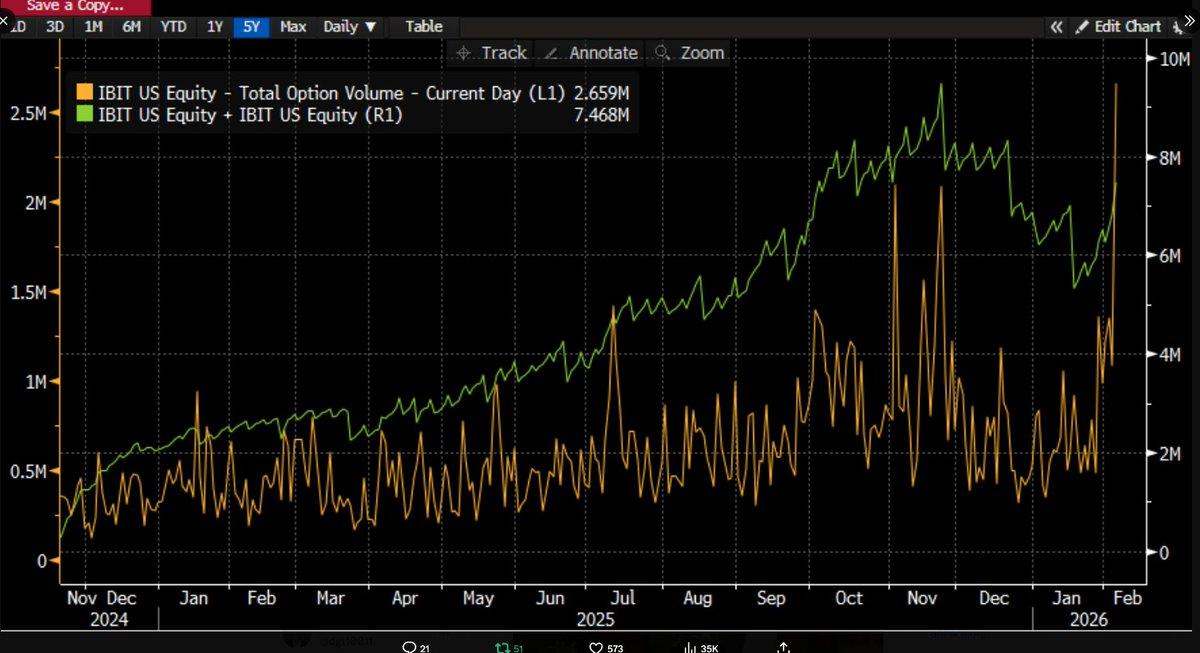
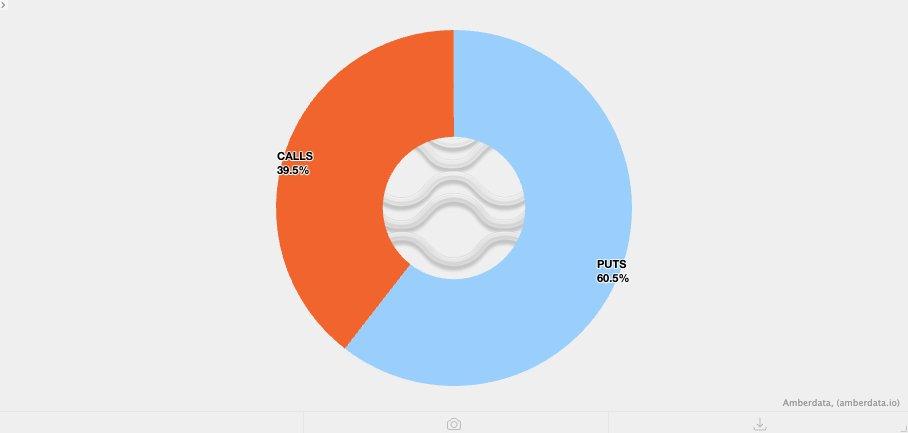
As time goes on and more data is released, the situation is becoming increasingly clear: this sharp sell-off is likely related to the Bitcoin ETF , and the day itself was one of the most volatile trading days in the capital markets in recent years. We can reach this conclusion because IBIT's trading volume that day hit an all-time high—exceeding $10 billion , double the previous record (a truly astonishing figure), while options trading volume also broke records (see the chart below, showing the highest number of contracts for the ETF since its inception). Somewhat unusually, the trading volume structure showed that this time options trading was clearly dominated by put options rather than call options (this will be discussed further later).
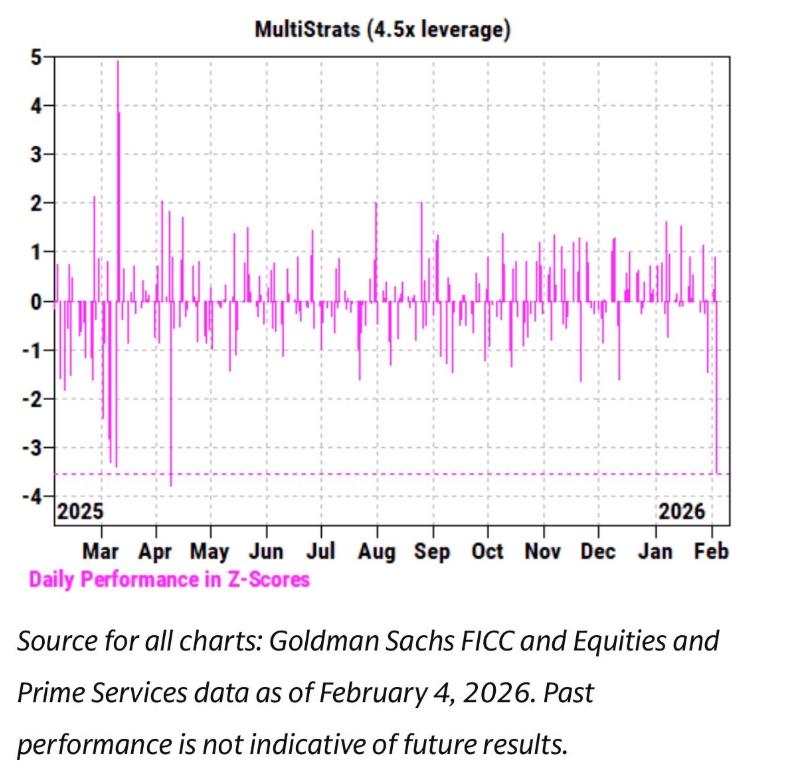
Meanwhile, over the past few weeks, we have observed an extremely strong correlation between IBIT's price movement and software stocks, as well as other risky assets . Goldman Sachs' prime brokerage (PB) team also released a report stating that February 4th was one of the worst single-day performances on record for multi-strategy funds, with a Z-score as high as 3.5. This means it was an extreme event with a probability of only 0.05%, ten times rarer than a 3-sigma event (the classic "black swan" threshold, with a probability of approximately 0.27%). It can be described as a catastrophic shock. Typically, it is after such events that risk managers in multi-strategy funds (pod shops) quickly intervene, requiring all trading teams to immediately, indiscriminately, and urgently deleverage . This explains why February 5th also turned into a bloodbath.
With so many records broken and prices clearly trending downwards (a 13.2% drop in a single day), we initially expected to see a high probability of net redemptions in ETFs. Based on historical data, this assessment wasn't far-fetched: for example, on January 30th, IBIT saw a record $530 million in redemptions after falling 5.8% the previous trading day; or on February 4th, IBIT experienced approximately $370 million in redemptions amidst a continuous decline. Therefore, in the market environment of February 5th, expecting an outflow of at least $500 million to $1 billion was entirely reasonable.
But the reality was quite the opposite— we saw widespread net inflows. IBIT added approximately 6 million units that day, resulting in an increase of over $230 million in assets under management. Meanwhile, other Bitcoin ETFs also recorded inflows, with the entire ETF system attracting a total net inflow of over $300 million.
This result is somewhat perplexing. Theoretically, it's plausible to assume that the strong price rebound on February 6th somewhat alleviated redemption pressure, but to directly shift from "potentially reduced outflows" to "net inflows" is entirely different. This implies that multiple factors are likely at play simultaneously, but these factors cannot form a single, linear narrative. Based on the information we currently have, we can propose several reasonable assumptions, upon which I will present my overall reasoning.
First, this round of Bitcoin sell-off likely affected a type of multi-asset portfolio or strategy that is not purely crypto-native . This could be the multi-strategy hedge funds mentioned earlier, or funds similar to BlackRock's model portfolio business that allocate between IBIT and IGV (software ETFs) and are forced to automatically rebalance during periods of high volatility.
Second, the accelerated sell-off of Bitcoin is likely related to the options market, especially options structures that correlate with the downside.
Third, this sell-off did not ultimately translate into an outflow of funds from Bitcoin assets, which means that the main driving force behind the market was the "paper money system," namely , position adjustments led by traders and market makers and generally in a hedging state.
Based on the above facts, my current core assumption is as follows.
- The direct catalyst for this sell-off was a broad deleveraging triggered by multi-asset funds and portfolios after the correlation between the decline in risky assets reached a statistically abnormal level.
- This process subsequently triggered an extremely aggressive deleveraging, which included Bitcoin exposure, but a significant portion of the risk was actually in “Delta-neutral” hedging positions, such as basis trading, relative value trading (such as Bitcoin relative to crypto stocks), and other structures that are typically “boxed out” by the dealer system to cover the remaining Delta risk.
- This deleveraging subsequently triggered a short Gamma effect, further amplifying downward pressure and forcing traders to sell IBIT. However, due to the intensity of the sell-off, market makers were forced to engage in net short of Bitcoin without considering their own inventory. This process, in turn, created new ETF inventory, thereby reducing market expectations of a large-scale capital outflow.
Subsequently, on February 6, we observed a positive inflow of funds into IBIT. Some IBIT buyers (the question is, to what extent do these buyers belong) chose to buy on dips after the decline , which further offset the small net outflow that might have occurred.
First, I personally believe that the initial catalyst for this event was the sell-off in software stocks, especially considering the high correlation between Bitcoin and software stocks, even higher than its correlation with gold. Please refer to the two charts below.
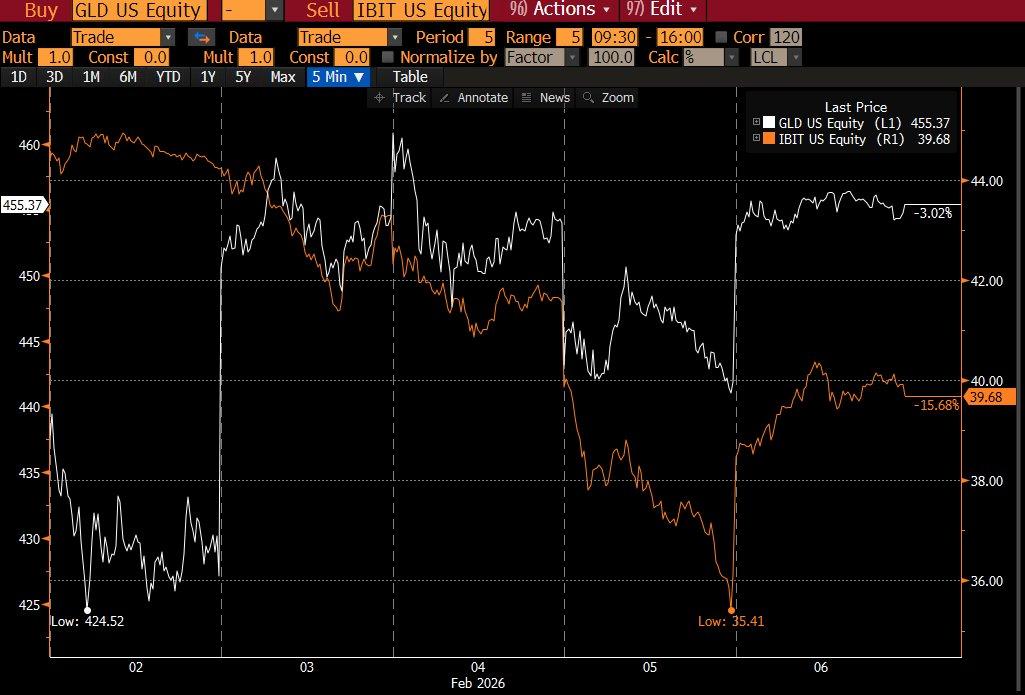
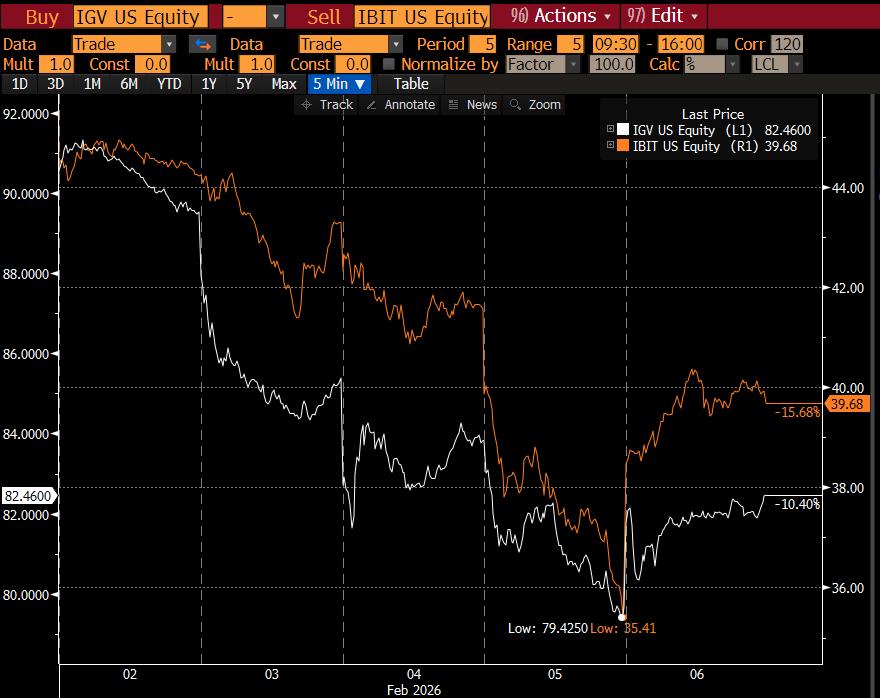
This makes logical sense, because gold is not typically a major asset held by multi-strategy funds involved in margin trading, although it may appear in RIA model portfolios (a pre-designed asset allocation scheme). Therefore, in my view, this further confirms the judgment that the center of this round of turmoil is more likely located within the multi-strategy fund system.
The second assessment therefore appears more reasonable: this aggressive deleveraging process did indeed include the risk of Bitcoin being hedged . Take CME Bitcoin basis trading as an example; this has long been one of the most favored trading strategies by multi-strategy funds.
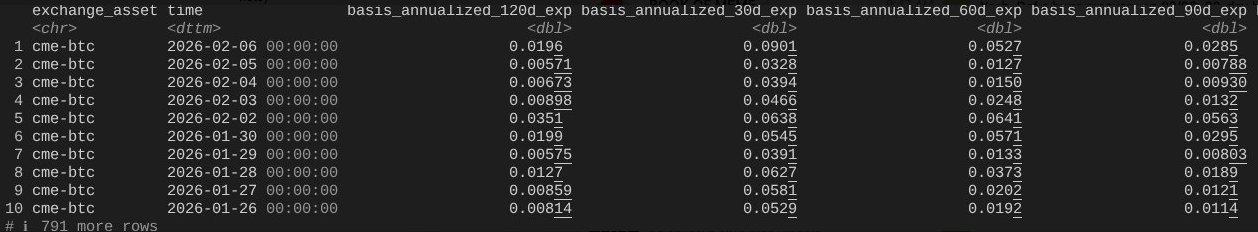
Looking at the complete data from January 26th to yesterday, covering the CME Bitcoin basis trends for 30, 60, 90, and 120-day maturities (thanks to top industry researcher @dlawant for providing the data), it's clear that the near-month basis jumped from 3.3% to a staggering 9% on February 5th. This is one of the largest jumps we've personally observed in the market since the ETF's launch, almost definitively pointing to one conclusion: basis trading was subject to massive forced liquidation under orders.
Imagine institutions like Millennium and Citadel being forced to liquidate their basis trading positions (selling spot and buying futures). Considering their size within the Bitcoin ETF ecosystem, it's easy to understand why such an operation would have a dramatic impact on the overall market structure. I've previously written down my own analysis on this point.
Odaily Odaily adds: The current large-scale indiscriminate selling in the US is likely coming from multi-strategy hedge funds. These funds often employ delta hedging strategies or run some form of relative value (RV) or factor-neutral trading, which is currently widening spreads and may also be accompanied by growth stock equity correlation spillovers.
A rough estimate suggests that about one-third of Bitcoin ETFs are held by institutional investors, and of those, approximately 50% (and possibly more) are believed to be held by hedge funds. This represents a considerable flow of fast money, which could easily be liquidated in a capitulation if funding costs or margin requirements rise in the current highly volatile environment, especially when risk managers intervene, particularly when the basis gains no longer justify the risk premium. It's worth noting that today's USD trading volume on MSTR is one of its highest in history.
This is why the biggest factor driving hedge fund failures is the infamous "co-owner risk": multiple seemingly independent funds holding highly similar exposures all rush to the same narrow exit when the market declines , causing all downside correlations to approach 1. Selling in the current liquidity crunch is a classic example of "closing out risk," a phenomenon we are seeing today. This will eventually be reflected in ETF fund flow data. If this assumption holds true, I suspect prices will quickly repric after this liquidation, but rebuilding confidence will take time .
This leads to the third clue. Now that we understand why IBIT was sold off amid widespread deleveraging, the question becomes: what exactly is accelerating the decline? One possible catalyst is structured products. While I don't believe the structured product market is large enough to trigger this sell-off on its own, when all factors align simultaneously and exceptionally perfectly in a way that exceeds the expectations of any VaR (Value at Risk) model, they could very well become an acute event triggering a chain reaction of liquidations.
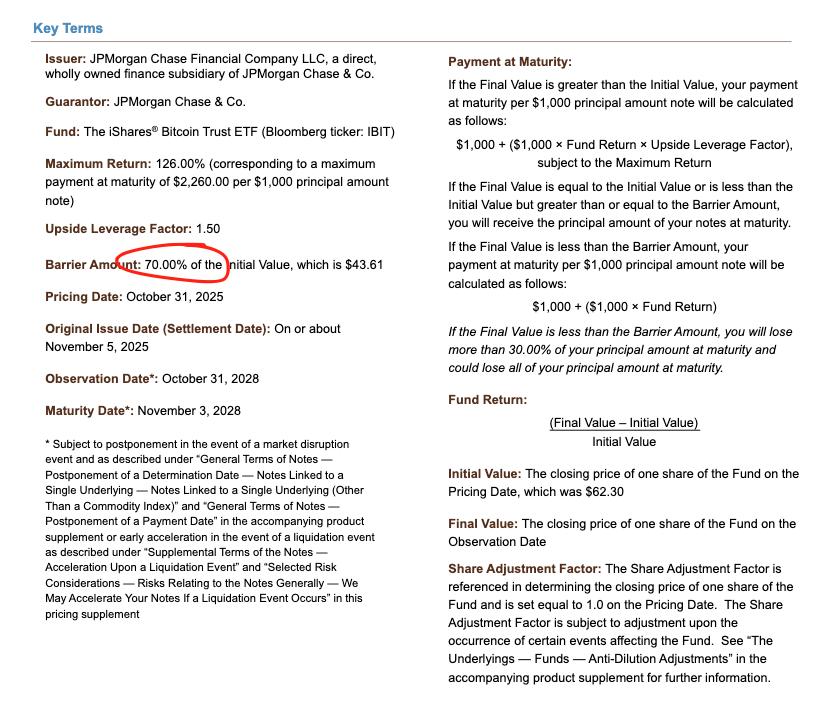
This immediately reminded me of my time at Morgan Stanley. There, structured products with knock-in put barriers (options only "activate" into valid put options when the underlying asset price hits/crosses a specific barrier level) often had extremely destructive consequences. In some cases, the option's Delta could even exceed 1, a phenomenon that the Black-Scholes model doesn't even consider—because under the standard Black-Scholes framework, for a typical vanilla option (the most basic European call/put option), the option's Delta can never exceed 1.
Take, for example, a note priced by JPMorgan Chase last November, where the knock-in barrier was set at 43.6. If these notes continue to be issued in December, and the price of Bitcoin drops by another 10%, then one can imagine a large number of knock-in barriers accumulating in the 38-39 range, which is the so-called "eye of the storm."
If these barriers are breached, and traders are hedging knock-in risk through methods such as selling put options, then under negative Vanna dynamics, the rate of change in Gamma will be extremely rapid. At this point, the only viable response for traders is to aggressively sell the underlying asset as the market weakens . This is precisely what we observed: implied volatility (IV) collapsed to near historical extremes of 90%, reaching a near-catastrophic squeeze. In this situation, traders were forced to expand their short positions in IBIT to the point of ultimately creating a net increase in ETF shares. This part does require some extrapolation and is difficult to fully confirm without more detailed spread data, but given the record trading volume that day and the deep involvement of authorized participants (APs), this scenario is entirely possible.
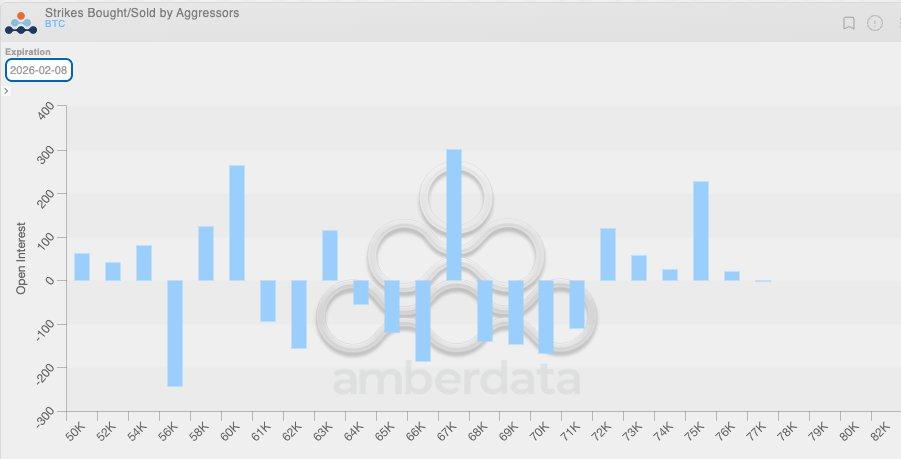
The logic becomes clearer when considered in conjunction with another fact. Due to the previously low overall volatility, clients in the crypto-native market have generally favored buying put options in recent weeks. This means that crypto traders are inherently in a short Gamma position and are underestimating potential future volatility in their pricing. When truly significant market movements occur, this structural imbalance further amplifies downward pressure. The position distribution chart below clearly illustrates this, showing that in the $64,000 to $71,000 range, traders are primarily concentrated on short Gamma positions in put options.
This brings us back to February 6th, the day Bitcoin experienced a strong rebound of over 10%. At this point, a noteworthy phenomenon was the significantly faster expansion of CME's open interest (OI) compared to Binance (thanks also to @dlawant for aligning the hourly data to 4 PM ET) . From February 4th to 5th, a clear collapse in CME OI was observed, further confirming the assessment that basis trading was massively liquidated on February 5th; on February 6th, these positions may have been re-established to take advantage of higher basis levels, thus offsetting the impact of capital outflows.
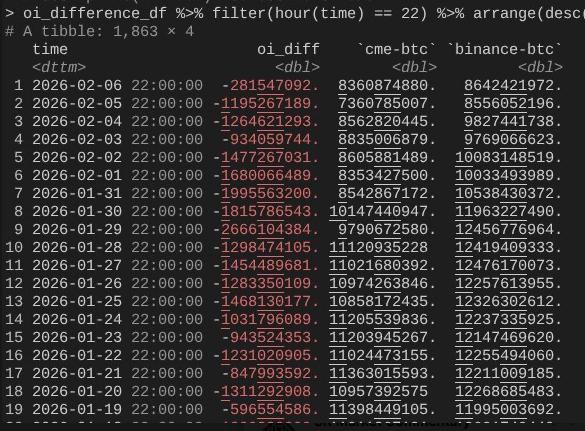
At this point, the entire logical chain is closed again: IBIT is roughly balanced in terms of subscription and redemption because CME basis trading has resumed; however, the price is still low because Binance's OI has experienced a significant collapse, which means that a considerable portion of the deleveraging pressure comes from short Gamma positions and strong parallel trading in the crypto native market.
This is my best explanation for the market performance on February 5th and the following February 6th. This deduction is based on several assumptions and is not entirely satisfactory, as it does not have a clear "culprit" to blame (like the FTX incident). However, the core conclusion is this: the trigger for this round of selling came from risk-averse behavior in traditional finance outside of crypto, and this process just happened to push the price of Bitcoin into a range where short Gamma hedging would accelerate the decline. This drop was not driven by directional bearishness, but by hedging demand, and ultimately reversed rapidly on February 6th (unfortunately, this reversal mainly benefited market-neutral funds in traditional finance, rather than crypto-native directional strategies). While this conclusion may not be exciting, it at least offers some reassurance that the previous day's sell-off was likely unrelated to the 10/10 event .
Yes, I don't believe what happened last week was a continuation of the 10/10 deleveraging process. I read an article suggesting the turmoil might have originated from a non-US, Hong Kong-based fund that participated in a yen carry trade and ultimately failed. But this theory has two obvious flaws. First, I don't believe a non-crypto prime brokerage would be willing to service such a complex multi-asset trade while providing a 90-day margin buffer, and not become insolvent before the risk framework tightened. Second, if the carry trade funds were "getting out" by buying IBIT options, then the Bitcoin price drop itself wouldn't accelerate the risk release—these options would simply become out-of-the-money, their Greek value quickly dropping to zero. This means the trade itself must contain real downside risk. If someone was simultaneously long on USD/JPY carry trades and selling IBIT put options, then frankly, such a prime brokerage doesn't deserve to exist.
The next few days will be crucial as we gather more data to determine if investors are using this dip to build new demand, which, if so, would be a very bullish signal. For now, I'm quite excited about the potential inflows into ETFs. I remain convinced that genuine RIA-style ETF buyers (rather than relative value hedge funds) are discerning investors, and at the institutional level, we're seeing significant and substantial progress, evident throughout the industry and among my friends at Bitwise. Therefore, I'm focusing on net inflows that haven't accompanied an expansion of basis trading.
Finally, all of this demonstrates once again that Bitcoin has integrated into the global financial capital markets in an extremely complex and sophisticated manner. This also means that when the market is on the side of reverse pressure in the future, upward movements will be steeper than ever before .
The fragility of traditional financial margin rules is precisely the antifragility of Bitcoin. Once the price rebounds—which I believe is inevitable, especially after Nasdaq raised the limit on open interest in options—it will be a truly spectacular move.