

Market Overview
This week, the cryptocurrency market experienced a significant downturn, with both BTC and ETH showing sharp declines. BTC fell 16.53% this week, ETH dropped 16.61%, and TOTAL3 decreased by 16.45%. The market sentiment index fell from 14 last week to 10, entering the extreme fear zone.
Stablecoin Market Dynamics
The total market capitalization of stablecoins declined, with USDT decreasing and USDC increasing:
- USDT: Market cap reached $185.2 billion, down 0.69% week-over-week, continuing last week’s capital outflow trend. This indicates that as market prices fell this week, non-U.S. investors continued their previous risk-averse exit behavior.
- USDC: Market cap of $70.6 billion, up 0.56% week-over-week, ending a six-week consecutive decline. Although this week’s increase was only $400 million, it reflects emerging bottom-fishing activity in the market.
BTC Market Trading Volume
This week’s BTC market trading activity saw a slight increase compared to last week. Data shows that the combined trading volume of BTC on Binance and Coinbase reached 487,940 BTC this week, a significant increase from last week’s 164,879 BTC. Specifically, Binance’s volume rose from 112,599 BTC to 337,287 BTC, while Coinbase’s volume climbed from 52,280 BTC to 150,653 BTC.
BTC ETF Market Trading Volume
This week’s BTC ETF market trading volume saw a substantial increase compared to last week. Taking BlackRock’s IBIT — the largest by market share — as an example, this week’s trading volume reached 839 million shares, a slight increase from last week’s 327 million shares.
Market Driver Analysis
Institutional Capital Outflows Intensify, Panic Signals Emerge
This week, buying power for BTC and ETH spot ETFs and listed treasury companies further contracted. The sustained sharp decline in market prices not only weakened buying interest but also triggered panic selling. This resulted in overall selling volume far exceeding buying volume this week, clearly reflecting emerging panic among market investors. The net outflow of institutional capital further intensified downward pressure on the market.
Macro Outlook Turns Pessimistic, Hawkish Shadow Looms
A core driver of this week’s volatile decline was the market’s increasingly pessimistic outlook on future Fed monetary policy. Reports that the next Fed Chair could be hawkish figure Wash have sparked deep concerns over the likelihood of continued balance sheet expansion and interest rate cuts. His advocacy for “balance sheet reduction” directly dampened sentiment in risk asset markets reliant on liquidity support.
Precious Metals Plunge Triggers Cross-Market Negative Transmission
Following last week’s decline, precious metals like gold and silver continued their sharp downturn this week. As key barometers of market sentiment, the sustained collapse in precious metals transmitted pessimism and risk-hedging fund rebalancing across markets to the crypto sector. This amplified overall selling pressure and triggered a synchronized crash in crypto markets.
Internal leverage unwinding amplified market declines
The substantial accumulation of leveraged long positions within the market acted as an amplifier for this crash. When prices began falling rapidly due to external factors, it swiftly triggered the first wave of forced liquidations. These passive sell orders further depressed prices, creating a vicious cycle of chain liquidations that significantly deepened and accelerated the market’s decline.
Key Events Forecast for Next Week
Major Macroeconomic Data Releases
The upcoming release of key U.S. economic indicators for late January — including the seasonally adjusted CPI year-on-year rate, unemployment rate, and nonfarm payrolls — will be closely monitored by the Federal Reserve. These figures will directly shape market expectations for future monetary policy and could trigger significant short-term volatility.
Precious Metals Market Continues to Influence Sentiment
The trajectory of precious metals next week remains a key variable shaping crypto market sentiment. Amid the current phase of widespread market panic and risk aversion, a stabilization or rebound in gold and silver prices could provide some stabilizing effect on the crypto market. Conversely, continued declines would intensify market pessimism.
Institutional Capital Flows Emerge as Core Observation Indicator
This week’s significant net selling by spot ETFs and treasury companies signals extreme market pessimism. Next week, these institutions’ capital flows should be the most critical market observation metric. Any marginal improvement or deterioration will directly reflect shifts in market confidence and may guide short-term market direction.
Market Outlook
Purchasing Power Recovery Faces Severe Test
Looking ahead, the restoration of institutional buying power remains the greatest unknown. Their decisions will heavily depend on upcoming macroeconomic data releases and the market’s immediate reactions. Should the data prove unfavorable, the market is highly likely to reduce purchases further — or even intensify selling — as a short-term risk-aversion measure. This could trigger another rapid downturn.
Maintain Strict Defensiveness, Prioritize Caution
Considering net institutional outflows, significant macroeconomic uncertainty, negative sentiment in related markets, and the risk of internal leverage unwinding, investors should remain highly cautious and prioritize risk control. Adopting a defensive stance with strict position management remains the optimal strategy for navigating this fragile market until clear stabilization signals emerge and institutional buying returns.
Next Week’s Forecast Targets
Bearish Targets: LINEA, VANA
LINEA:
Comprehensive L2 Ecosystem Contraction Coupled with 1.44 Billion Token Unlock Triggers Systemic Risk from Multiple Bearish Factors
Project Fundamentals and Positioning
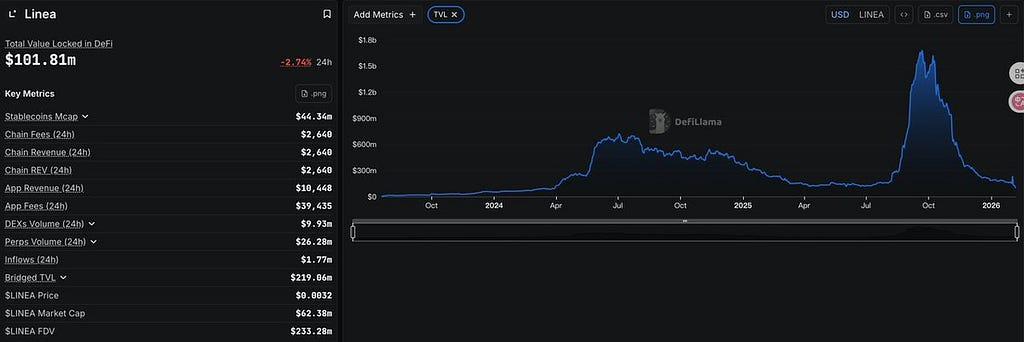
Linea is an Ethereum Layer 2 scaling solution designed to provide higher transaction throughput and lower fees for the Ethereum ecosystem while maintaining compatibility and security with the Ethereum mainnet.
Fundamental Deterioration
- Severe TVL Contraction: Linea’s TVL has plummeted from a peak of $1.683 billion to $101 million, a 93.99% decline, indicating a rapid exodus of users from the ecosystem.
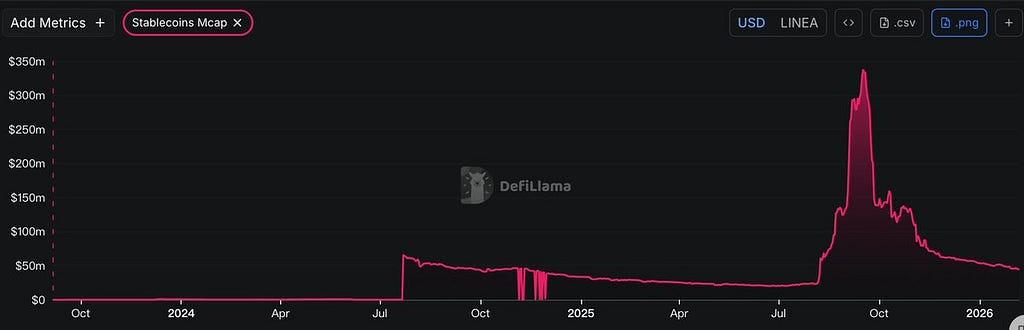
- Stablecoin Market Cap Collapse: On-chain stablecoin market cap shrank from $337 million to $44.33 million in just over a month (-86.85%), reflecting a persistent drain of capital.
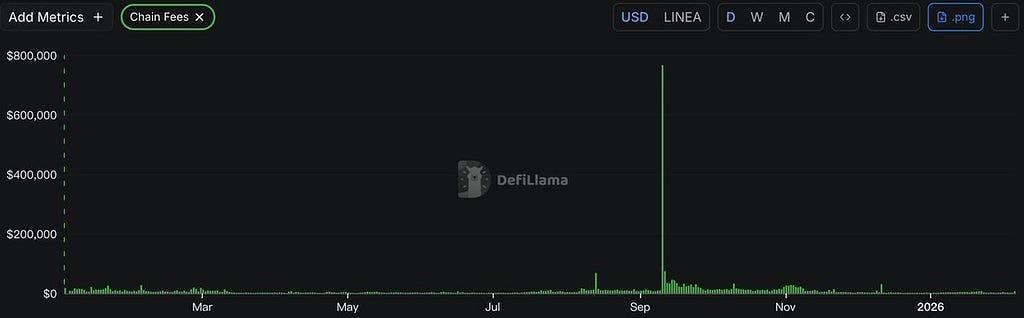
- Significant Drop in On-Chain Activity: Daily network fees have fallen to approximately $4,000, signaling a sharp reduction in active users.
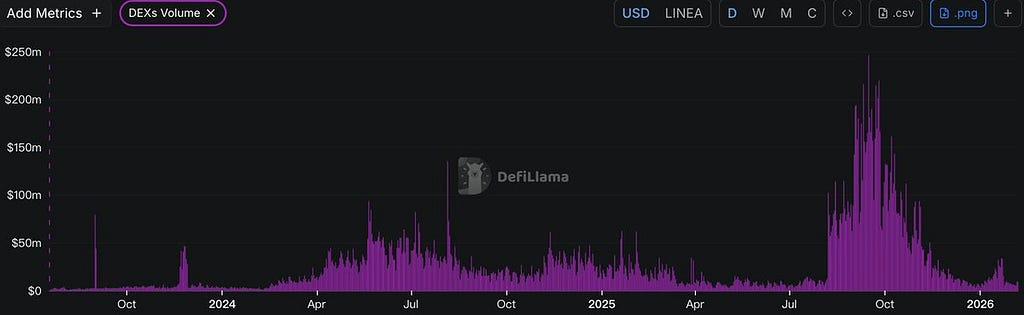
- Plummeting DEX Volume: On-chain DEX trading volume has trended downward from $219 million/day to $5.54 million/day, representing a 97.47% collapse.
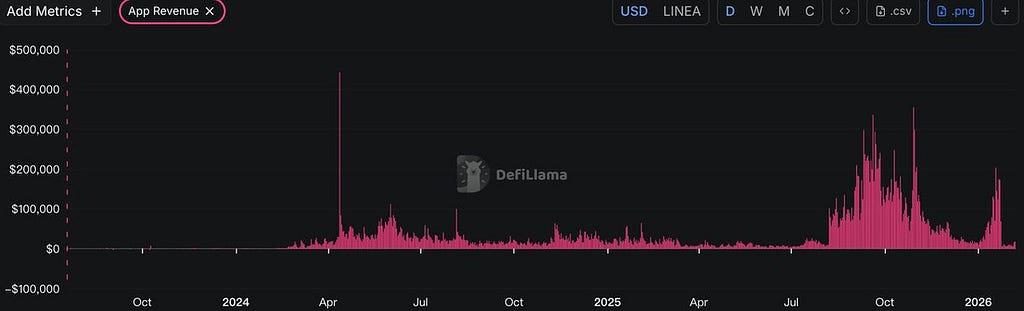
- Stagnant Ecosystem Revenue: Revenue from on-chain applications is in a steep decline, with total daily revenue across all projects at only ~$7,000.
Token Unlock Risk Assessment
- Unlock Scale & Structure: On February 10, 1.44 billion LINEA tokens (2% of locked supply) will be unlocked. Given current market conditions, this will significantly disrupt the supply-demand balance.
- Entity-Specific Risk: This linear unlock primarily involves investment institutions and the project team, who possess a strong incentive to liquidate holdings amid deteriorating fundamentals.
- Insufficient Market Absorption: With a daily trading volume of only ~$6 million, market liquidity is extremely thin and unable to effectively digest the sell pressure from this large-scale supply increase.
Summary
Linea faces multiple overlapping systemic risks: Fundamentally, TVL has plummeted by 93.99%, stablecoin market cap has shrunk by 86.85%, and all key metrics have deteriorated across the board. Liquidity-wise, the unlocking of 1.44 billion tokens on February 10 will create massive selling pressure within the limited liquidity pool averaging $6 million daily. The convergence of these multiple bearish factors is exerting sustained negative pressure on the LINEA token price, placing the project under severe survival challenges.
VANA:
User-Owned Data AI Ecosystem Collapses Amid Fundamental Deterioration and Massive Unlock Pressure
Project Fundamentals & Positioning
Vana is an EVM-compatible Layer 1 blockchain focused on the management and governance of user-owned data. Its core objective is to establish a distributed network where users own, govern, and monetize the data they contribute.
Severe Fundamental Deterioration
- TVL Contraction: Vana’s Total Value Locked has plummeted from an initial $2.97 million to $1.01 million (-65.99%), signaling a persistent capital outflow and user exodus.
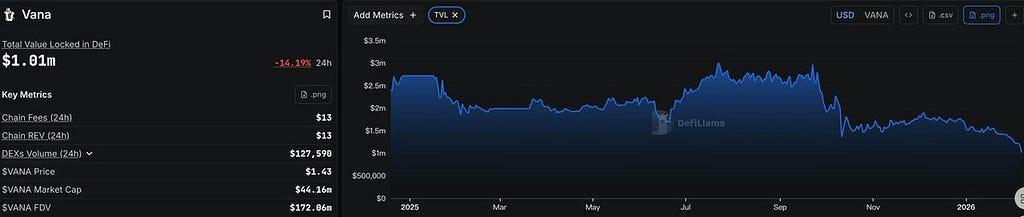
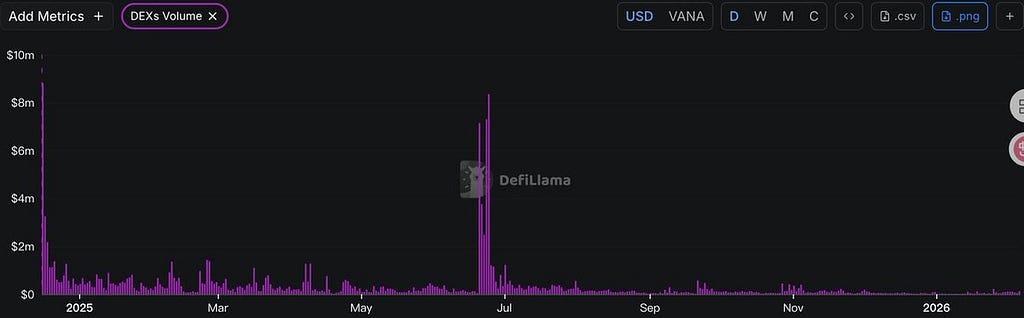
- Extreme Trading Stagnation: Daily DEX volume remains at a dismal ~$80,000, reflecting severely insufficient on-chain activity and minimal user engagement.
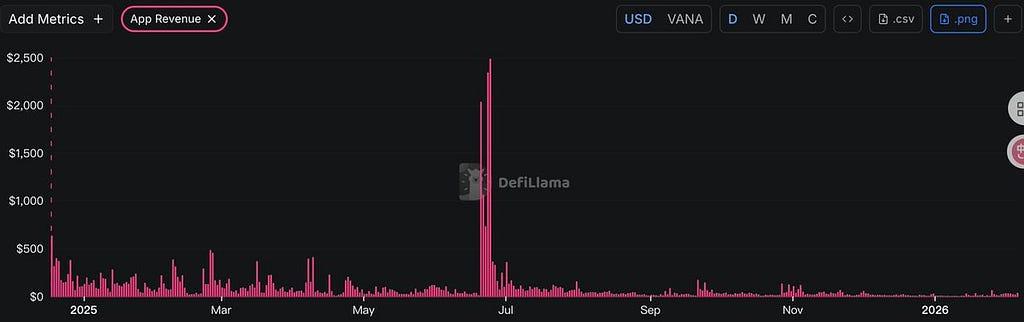
- Negligible Ecosystem Revenue: Daily revenue from on-chain applications has dropped below $30, indicating the ecosystem has effectively lost its user base with near-zero utility.
- Declining User Activity: Daily network fees have stagnated at approximately $10/day, suggesting the on-chain ecosystem is on the verge of obsolescence.
Token Unlock Risk Assessment
- Unfavorable Timing & Scale: On February 15, 1.24 million VANA tokens will be unlocked. Executing a large-scale unlock during a period of fundamental deterioration is poorly timed.
- Insufficient Market Absorption: With daily trading volume at only ~$1 million, market liquidity is inadequate to digest the incoming supply, creating significant selling pressure.
- Strong Incentive to Liquidate: This linear unlock primarily involves investment institutions and the project team. Given the current downtrend, these holders have a high motivation to cash out and exit.
- Thin Liquidity Depth: Low daily volume reflects a lack of market depth, meaning the sell pressure will translate directly into sharp negative price action.
Summary
Vana faces systemic risks across all layers: Operationally, TVL has shrunk by 65.99%, DEX volume is stagnant at $80k, and ecosystem revenue has vanished. Capitally, the February 15 unlock of 1.24 million VANA tokens into a thin $1M/day liquidity pool creates a massive supply shock. Combined with strong institutional sell motives, these factors exert continuous downward pressure on VANA’s price, making a short-term reversal highly unlikely.
Next Week’s Token Unlock Schedule
(Amounts Exceeding $1 Million)
Weekly Hot Topics
What Does DigiFT Offer When Markets Seek Safe Havens? Analyzing the Logic Behind Its TVL Growth Against the Trend
Event Background
Amidst the crypto market’s overall sharp decline, on-chain data for the vast majority of projects has followed suit with significant drops in token prices, indicating a gradual withdrawal of market capital. However, DigiFT’s TVL surged dramatically during this period, rising 122% over two weeks.
DigiFT is the world’s first RWA tokenization compliant exchange incorporated into the Monetary Authority of Singapore (MAS) FinTech Regulatory Sandbox. It focuses on enabling the on-chain issuance, management, and trading of traditional financial assets like bonds and stocks through blockchain technology.
Data Analysis
TVL
DigiFT’s TVL data reveals a 122% increase during the market downturn from January 20 to February 4, 2026.
TVL Composition
Analyzing DigiFT’s TVL breakdown reveals that its total value is primarily composed of CMBMINT (CMB International USD Money Market Fund Token), pEAK.BTC, and iSNR.
Project Product APY
Project 0’s official website indicates exceptionally high deposit rates for USDS, reaching 6.73%. This creates favorable conditions for on-chain arbitrage users to engage in revolving loans.
From the descriptions of DigiFT’s three products, we observe they are all RWA products pegged to traditional markets. Their advantages lie in high APY or low risk with high liquidity.
In summary, DigiFT’s recent TVL growth primarily stems from incremental capital flowing into the RWA market, driving overall project expansion.
Reasons for Rapid Data Growth
DigiFT’s TVL experienced counter-trend growth between January 20 and February 4, 2026. This phenomenon fundamentally resulted from the combined effects of “market capital seeking safe-haven assets in stable markets” and “the demand for high APY during risk-averse periods.”
1.The Siphon Effect of Money Market Funds
The core driver of this TVL surge was the explosive growth of on-chain money market fund (MMF) products. CMBMINT alone — the token representing CMBI’s USD Money Market Fund — attracted over $50 million in capital within two weeks. Amid extreme market panic in the broader crypto space, investors are hesitant to commit to projects, holding large amounts of stablecoins instead. This period has intensified demand for risk-free returns. Compared to volatile deposit rates in DeFi protocols, CMBMINT offers stable yields backed by underlying USD deposits and high-grade short-term notes, with robust issuer guarantees ensuring capital safety. Consequently, it has absorbed substantial on-chain safe-haven capital.
2.Diversified “Yield Curve Stratification”
DigiFT avoids reliance on a single Treasury tokenization, instead constructing a comprehensive yield stratification system to maximize satisfaction of diverse market demands. As seen on DigiFT’s official website, beyond the foundational MMF (approximately 3.4% APY), the platform has successfully attracted capital with diverse risk appetites by introducing products like iSNR (Invesco US Senior Loan Strategy, yielding 7.82%) and bEQTY (BNY Mellon US Equity Income Fund, yielding 11–15%). Risk-averse capital flows into uMINT and CMBMINT, while aggressive capital seeking alpha returns is channeled into high-yield products like PEAK and iSNR. This multi-tiered product matrix enables DigiFT to simultaneously address both cash management and risk investment demands.
3.The “Safe Haven” Effect of Regulatory Licenses
Amid increasingly stringent regulatory environments, DigiFT stands as the first regulated on-chain RWA project in the crypto market. Its Singapore Monetary Authority (MAS)-issued Capital Markets Services (CMS) license and Recognized Market Operator (RMO) license serve as key endorsements for attracting institutional capital. Recent heightened market concerns over the compliance of non-custodial, unlicensed RWA projects have triggered a “gray-to-white” capital migration. When making large-scale allocations, institutional investors now prioritize legal segregation and bankruptcy protection mechanisms over maximizing yields. DigiFT’s fully compliant structure — where underlying assets are independently custodied by licensed custodians — naturally becomes the preferred destination for substantial compliant capital during heightened market risk aversion.
Investor Participation Strategy for DigiFT
1⃣uMINT
uMINT, a tokenized money market fund issued and managed by UBS, represents the top tier of credit ratings among current on-chain RWA assets. Currently yielding an annualized 7-day rate of 3.4169% with AAA-rated underlying assets, it offers ordinary users the closest on-chain wealth management experience to “bank deposits.”
2⃣CMBMINT
CMBMINT (CMBI USD Money Market Fund Token) offers comparable security to uMINT while delivering a slightly higher yield, with the latest 7-day annualized yield reaching 3.4386%. This fund primarily invests in short-term deposits and high-quality money market instruments, aiming to capture USD market interest rate returns while maintaining absolute principal safety.
3⃣DMMF01
DMMF01 is a money market fund token managed by CSOP. Compared to the previous two, it currently offers superior yields with a 7-day annualized yield of 3.6086%. It primarily targets cash management users familiar with Asian financial institutions or seeking yield maximization. Key risks involve fund operations and custody.
4⃣DRUST0534
DRUST0534 is a tokenized single U.S. Treasury bond, with the underlying asset being a 10-year Treasury maturing in May 2034. Its yield to maturity reaches 4.17%, significantly higher than current money market fund rates. However, investors bear interest rate risk: if market rates rise further, bond prices may decline.
5⃣iSNR
iSNR (Invesco US Senior Loan Strategy) tracks Invesco’s managed US senior loan strategy, currently yielding 7.82% annually. Senior loans feature floating rates, maintaining high returns during elevated interest rates. Yet, higher returns carry medium-to-high risk stemming primarily from credit spread volatility and default risk among underlying borrowers.
6⃣bEQTY
Managed by BNY Investments, bEQTY aims to achieve dual objectives of immediate income and long-term capital appreciation through a value-driven, dividend-focused strategy. Its target return range is set at 11–15%. This is a pure risk asset allocation tool directly linked to U.S. equity market performance, carrying a medium-to-high risk profile.
Crypto Events Next Week
- Tuesday (Feb 10): U.S. Retail Sales MoM for December
- Wednesday (Feb 11): U.S. Unemployment Rate for January; U.S. Seasonally Adjusted Non-Farm Payrolls for January
- Thursday (Feb 12): U.S. Initial Jobless Claims for the week ending February 7
- Friday (Feb 13): U.S. Unadjusted CPI YoY for January
Sector Performance
According to weekly return statistics, the SocialFi sector performed the best, while the Layer 1 sector performed the worst.
SocialFi Sector: Within the SocialFi sector, TON, CHZ, and MASK hold a significant proportion, totaling: 98.05%. Their respective returns this week were: -7.32%, -14.16%, and -16.08%. Since TON carries a heavy weight within the SocialFi sector and its decline this week was smaller compared to projects in other sectors, the SocialFi sector emerged as the top performer.
Layer 1 Sector: Within the Layer 1 sector, ETH, BNB, SOL, TRX, and ADA hold a significant proportion, totaling: 95.43%. Their respective price changes this week were: -16.61%, -22.96%, -26.85%, -6.99%, and -16.91%. It is evident that projects in the Layer 1 sector experienced larger declines relative to projects in other sectors, resulting in the Layer 1 sector being the worst performer.
Summary
This week, the cryptocurrency market experienced a pronounced downward trend amid multiple pressures. Prices of major assets plummeted significantly, with BTC falling 16.53% over the week and ETH dropping 16.61%. The TOTAL3 index, reflecting the broader altcoin market, also declined by 16.45%. Market pessimism intensified sharply, with the Fear & Greed Index dropping from 14 last week to 10, officially entering the “Extreme Fear” zone. Capital outflows dominated the week, while the stablecoin market showed divergence: USDT’s market cap continued its outflow trend, whereas USDC’s market cap rose slightly by 0.56%, potentially indicating initial entry of bottom-fishing capital. However, BTC’s weekly trading volume on major exchanges surged from 164,000 to 487,000 coins. This does not signal a rebound in sentiment but rather reflects panic selling amid the downtrend and intense bull-bear battles, indicating overall market confidence remains extremely fragile.
Despite the prevailing market anxiety, we still observed structural bright spots. Compliant RWA platform DigiFT emerged as this week’s biggest winner, with its TVL surging 122% against the trend over two weeks. This success stems primarily from its Money Market Fund (MMF) products, backed by traditional financial institutions like CMBI. During market panic, these high-credit, stable-yield assets became the ideal “safe haven” for idle stablecoins on-chain. By constructing a tiered “yield curve” spanning low-risk to high-return products and leveraging its robust Singapore MAS compliance license, DigiFT successfully captured risk-averse capital across diverse risk appetites.
Looking ahead to next week, the market outlook remains challenging, and investors should adopt highly cautious defensive strategies. On the macro front, key upcoming U.S. data releases — including the seasonally adjusted CPI year-on-year rate, unemployment rate, and nonfarm payrolls for late January — will dominate market attention. Any figures falling short of expectations could trigger significant volatility. Simultaneously, the recovery of institutional buying power will serve as a core indicator for gauging market confidence, while movements in related markets (such as precious metals) will continue to shape market sentiment. Therefore, until clear signs of market stabilization emerge, strictly controlling positions and avoiding high-risk assets remain the prudent approach to navigating the current complex landscape.