Bitcoin entered Feb. 11, 2026, walking a tightrope between hopeful rebounds and heavy-handed resistance. Priced at $67,131 with a market cap of $1.34 trillion, the cryptocurrency saw an intraday range between $66,351 and $69,876 and boasted a 24-hour trading volume of $46.24 billion. But despite the fireworks in volume, momentum isn’t exactly throwing a party.
Bitcoin Chart Outlook
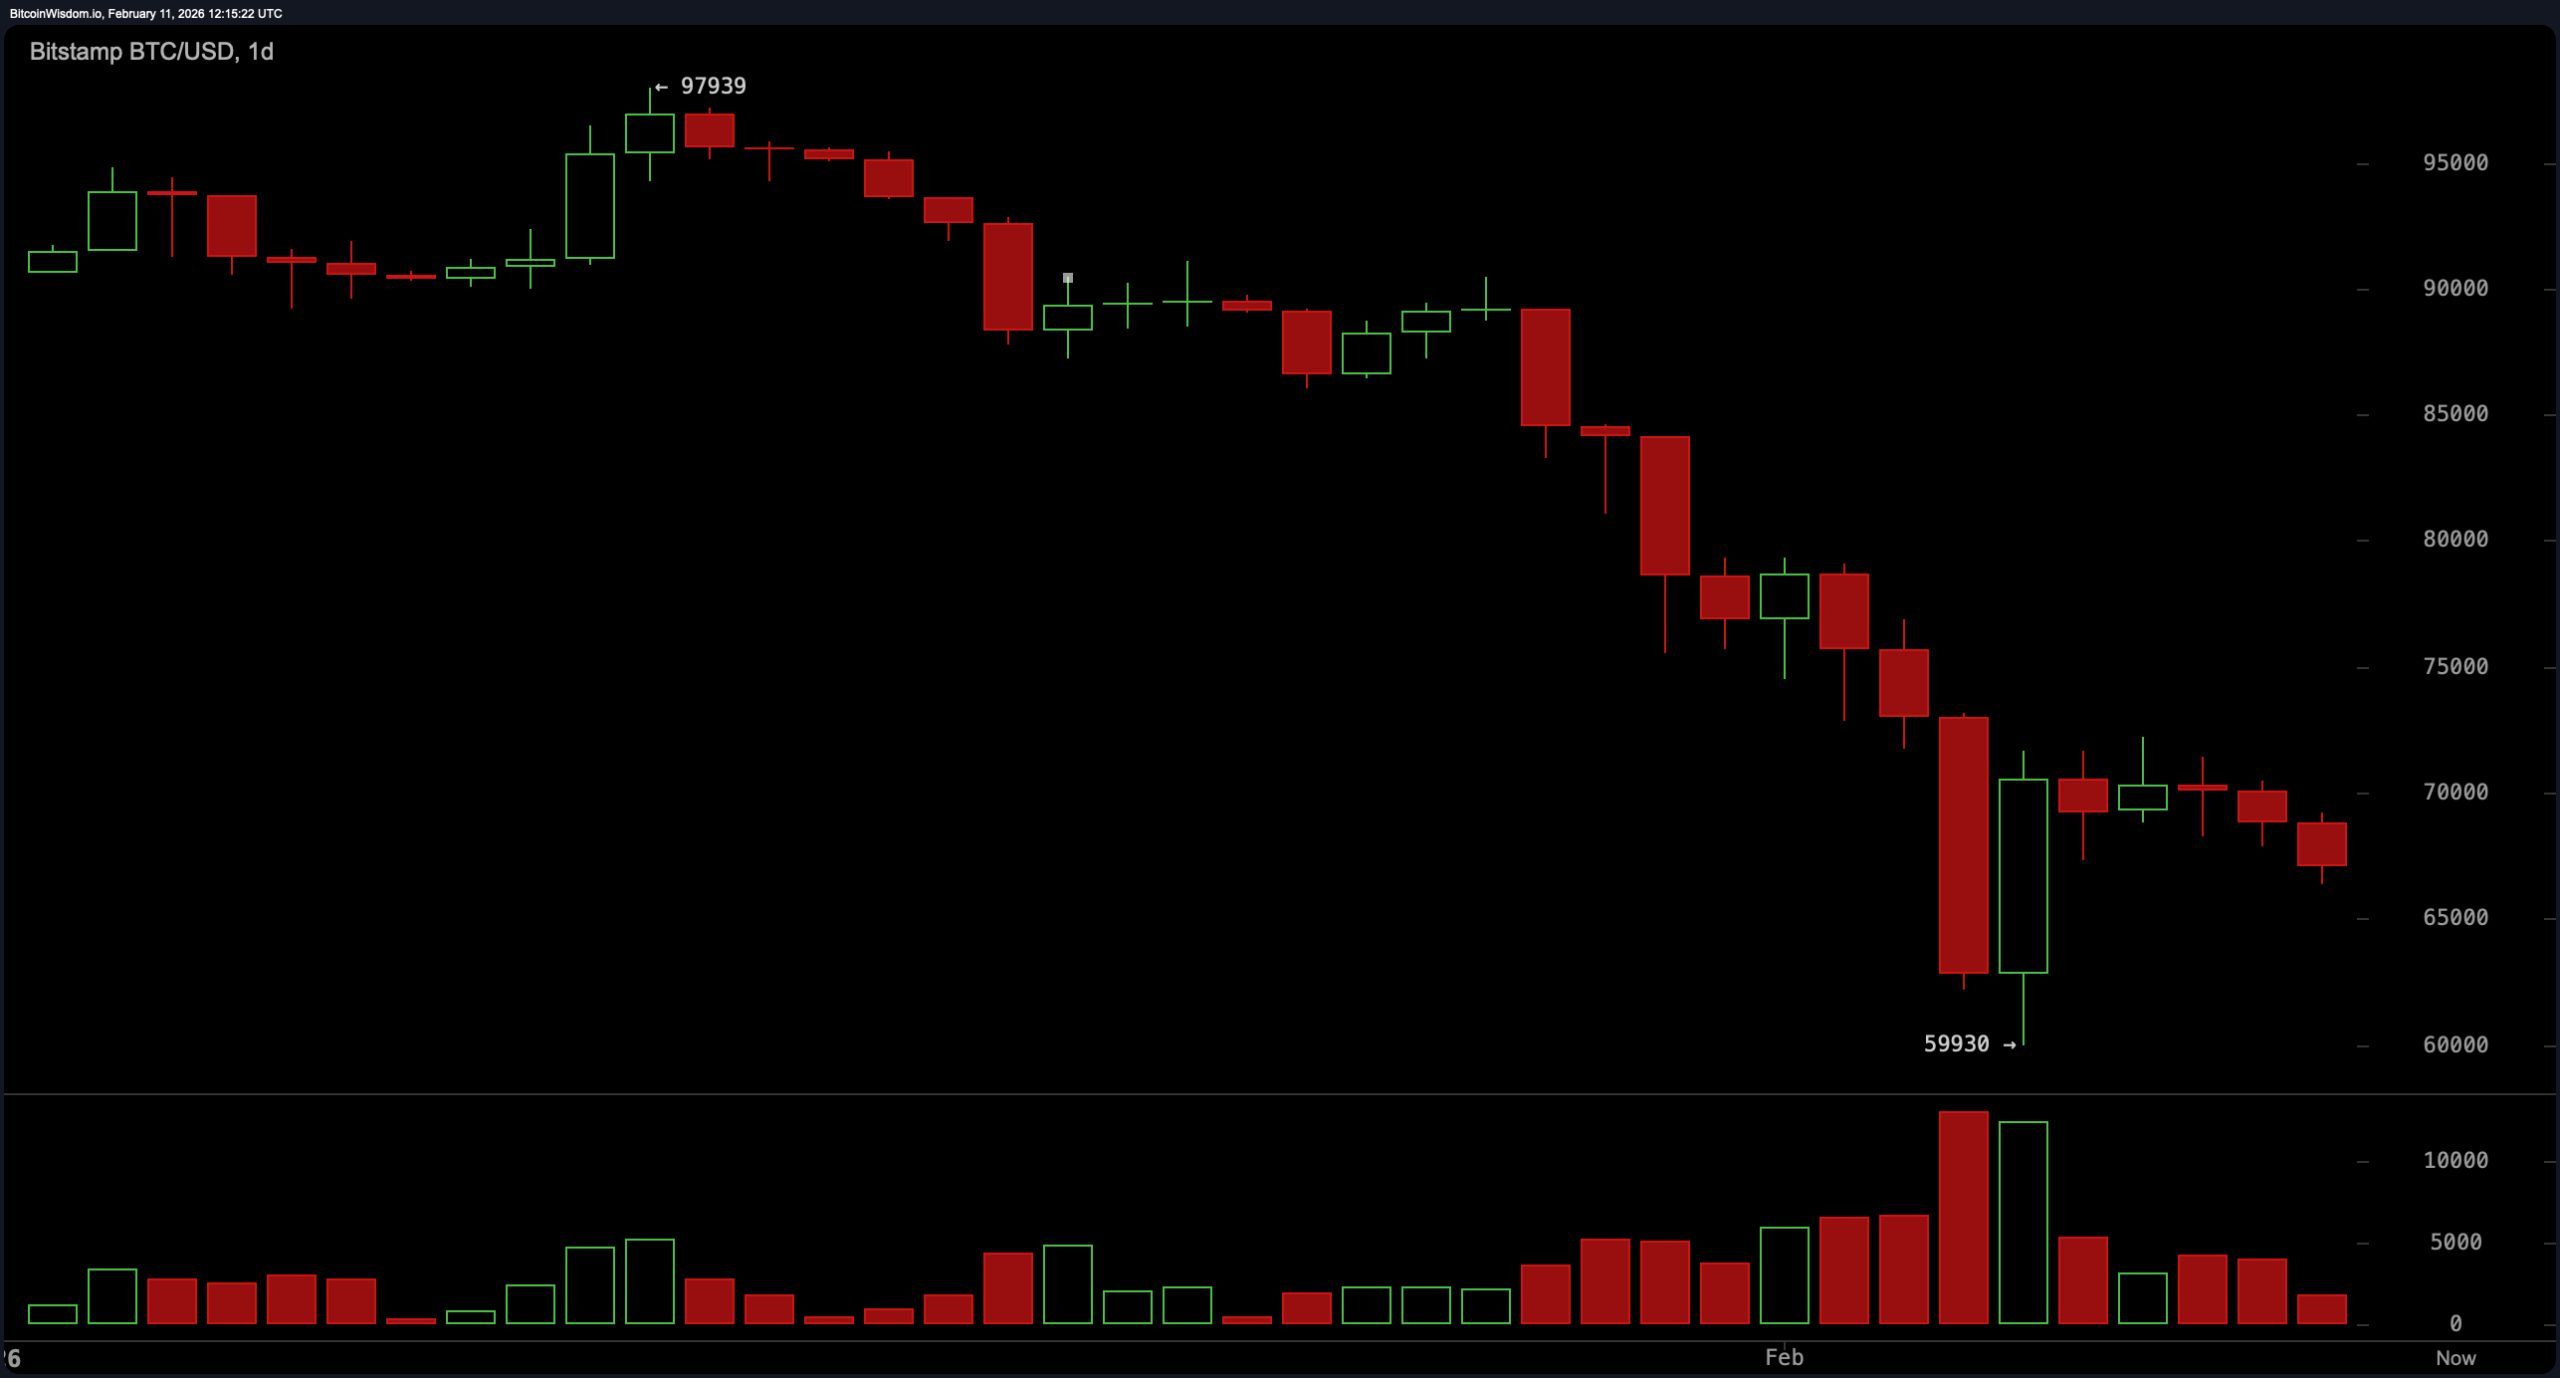
The daily chart paints a not-so-subtle picture of macro malaise. After a dramatic plunge from late January’s $97,939 peak to $59,930, bitcoin has been consolidating within a tight $66K–$70K corridor. That high- volume red candle at the $59.9K low could signal a capitulation bottom, but calling that a confirmed reversal would be like calling a drizzle a monsoon. Resistance near $75K looms overhead, and any bullish hopes need to muscle past that wall before breaking out the confetti. If bitcoin slips below $59.9K again, it’s lights out for the current upward bias.
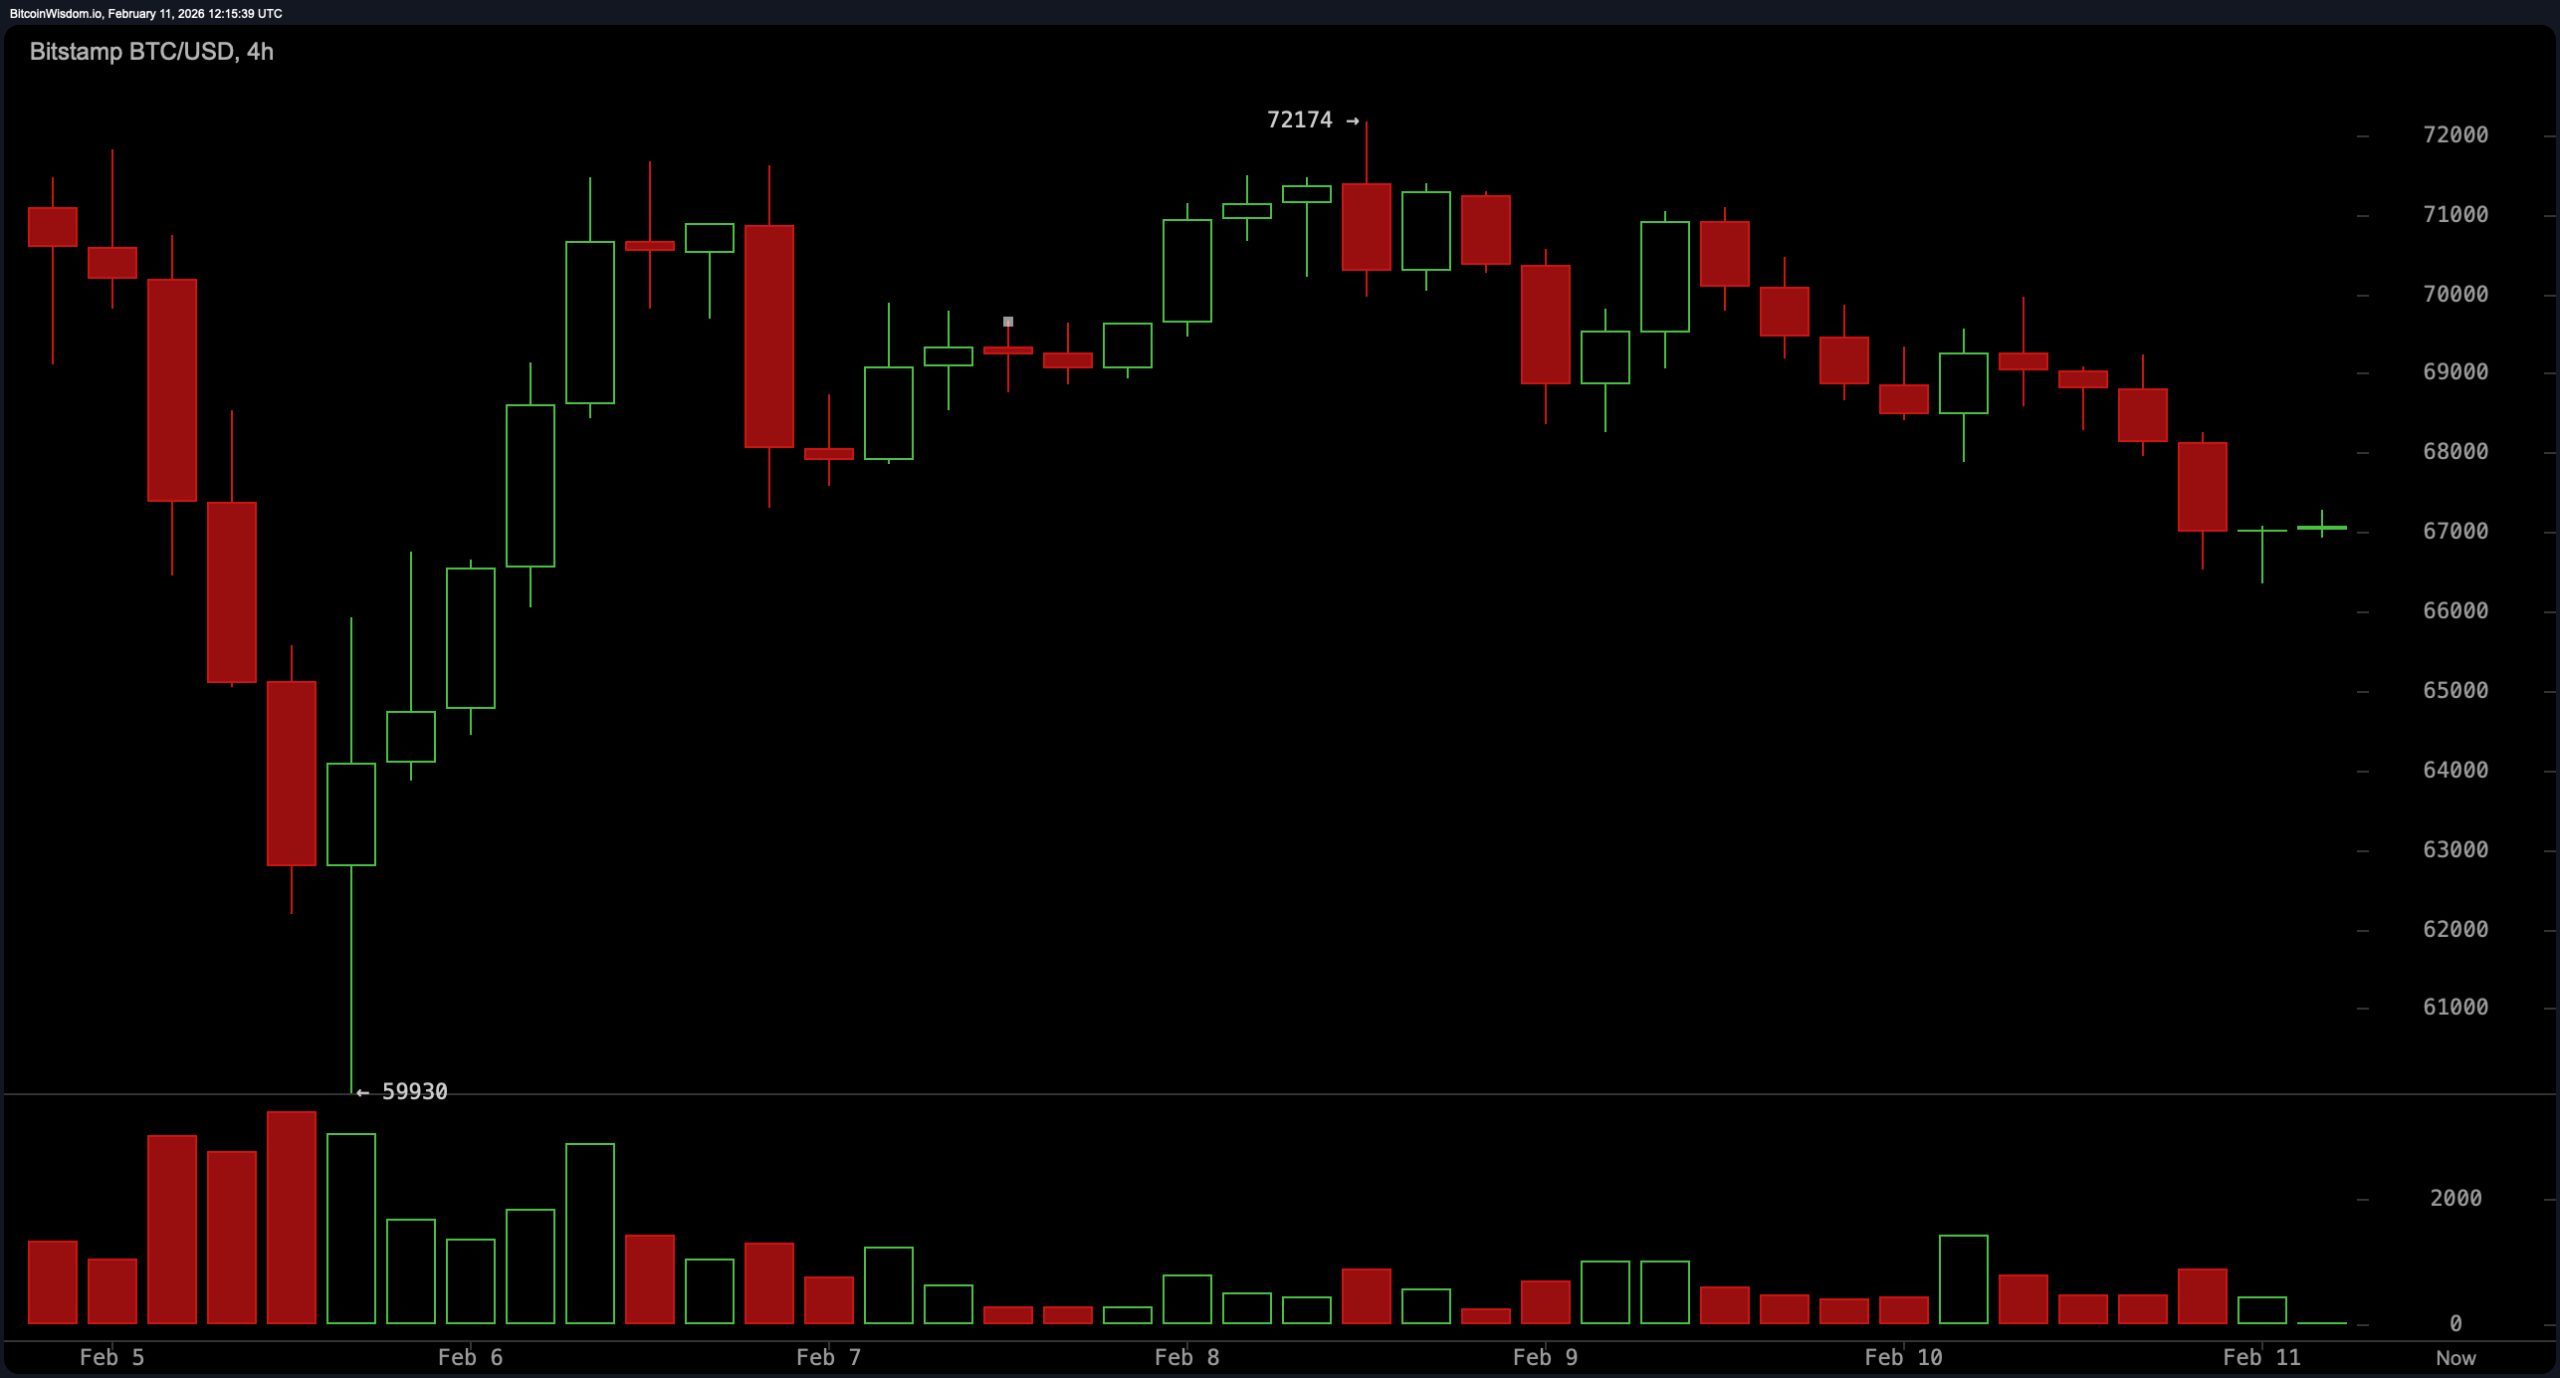
Zooming into the four-hour chart, things aren’t exactly looking like a comeback tour. The short-term structure is defined by lower highs and sluggish bounces. A rally from the $59.9K zone had potential, but the recent rejection near $72,174 on February 8 and falling volume tell a different story.
The asset is now consolidating near $67K, and while a reclaim of $69K with some volume might spark interest, the structure remains shaky. Support at $66K is the line in the sand—break it with volume, and the trapdoor opens further.
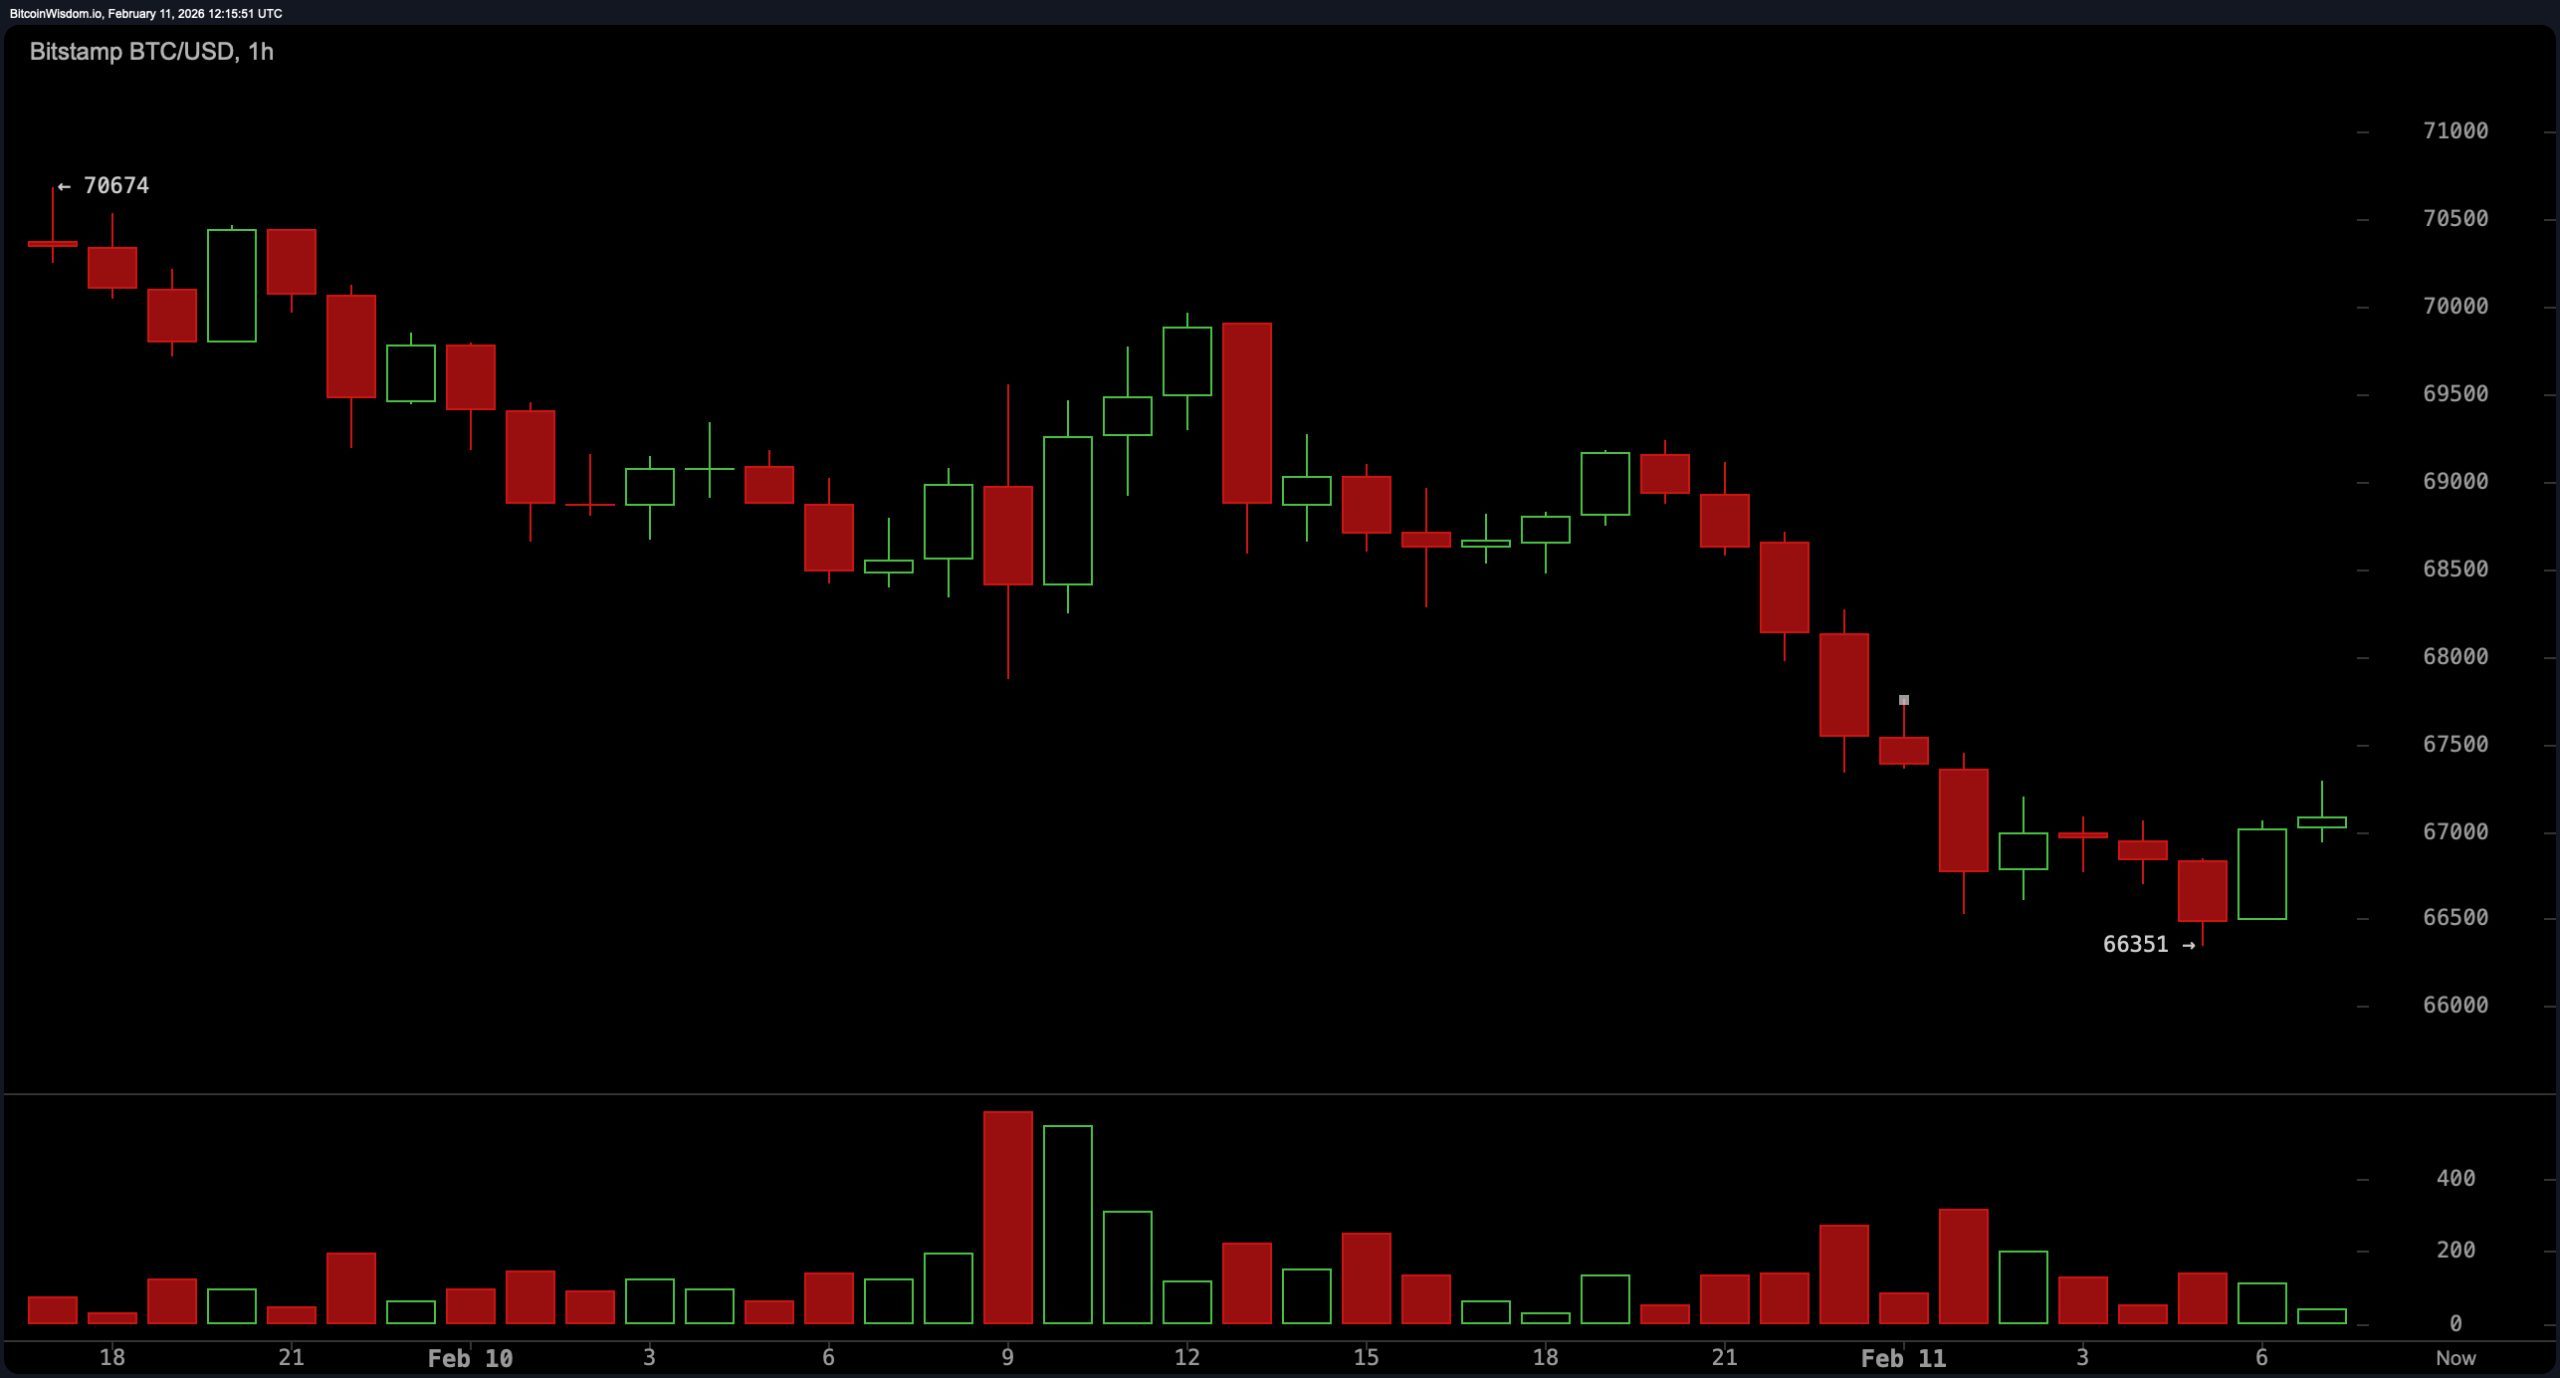
The one-hour chart, your scalper’s playground, offers marginally more intrigue—but it’s no gold rush. With a low of $66,351 and a muted rebound, the chart is bound in a choppy range of $66.3K to $67.5K. Modest green candles lack conviction, and unless volume steps in like it means business, this market remains a tug-of-war between boredom and breakdown. A clean move above $67.5K could open the path toward $70K, while a slip below $66.3K reintroduces the mid-$64K levels into the conversation.
Indicators aren’t throwing a parade either. Among oscillators, the relative strength index ( RSI) and Stochastic both sit at 30 and 29, respectively—technically neutral but low enough to raise a brow. The commodity channel index (CCI) lingers at -93, and even the average directional index (ADX) at 52 signals trend strength without picking a side. The Awesome oscillator is firmly in the red at -14,800, and momentum posts a slightly more upbeat -9,813. Meanwhile, the moving average convergence divergence ( MACD) level is sitting at -5,797, throwing cold water on bullish momentum with no hesitation.
Moving averages aren’t helping the mood either. Every single exponential and simple moving average from the 10-period to the 200-period—yes, all of them—scream “no thank you.” The 10-period exponential moving average (EMA) sits at $71,449, and the 200-period simple moving average (SMA) at $101,560, with bitcoin cruising well below them. That level of distance suggests a structurally weak chart and reinforces the view that this bounce, if you can even call it that, may be more bark than bite.
In sum: consolidation is real, support is crucial, and any significant move needs volume to back it up. Until then, keep your stops tight and your expectations tighter.
Bull Verdict:
If bitcoin holds the $66K support zone and reclaims $69K with strong volume, the case builds for a short-term recovery toward $72K and possibly retesting the $75K resistance. The high- volume low at $59.9K could mark a capitulation point, suggesting the potential beginnings of a bottoming process—albeit fragile and unconfirmed.
Bear Verdict:
The technical structure remains overwhelmingly bearish, with price action below every major moving average and momentum indicators offering no clear support. Should bitcoin break below $66K—and especially $59.9K—the broader trend would affirm continued weakness, setting the stage for deeper declines and a prolonged correction phase.
FAQ ❓
- What is bitcoin’s price right now? Bitcoin is trading at $67,131 as of February 11, 2026.
- Is bitcoin in an uptrend or downtrend? Bitcoin remains in a macro downtrend with weak short-term rebounds.
- Where is bitcoin’s support level?Key support sits at $66,000, with major support at $59,900.
- What resistance is bitcoin facing? Bitcoin faces resistance near $69,000 and a stronger ceiling around $75,000.