Hyperliquid (HYPE) price has surged nearly 31% since February 24, 2024, before undergoing a slight correction but retaining most of its gains. At the time of writing, the Token is trading around $32, up approximately 4.5% on the day and over 20% from a week ago. Over the past 30 days, HYPE's price has remained in positive territory with gains of around 5%, while most major cryptocurrencies like Bitcoin, Ethereum, BNB, XRP , and Solana have declined during the same period.
This price surge is linked to a key shift: Hyperliquid is becoming the platform of choice for trading traditional financial assets like oil, gold, and stocks anytime, anywhere – and every transaction on the platform contributes to the Token burning mechanism that reduces the supply of HYPE. Additionally, "whale" wallets and institutional investors maintain long-term long positions in HYPE, while retail investors tend to short sell.
Hyperliquid removes the biggest barrier for TradFi.
Traditional financial markets are typically closed on weekends and outside of business hours, but Hyperliquid is different. Users can trade oil, gold, silver, and even stocks like NVIDIA on Hyperliquid using perpetual futures contracts 24 hours a day, 7 days a week, with attractive leverage. This advantage became particularly prominent during the weekend of March 1-2, 2024.
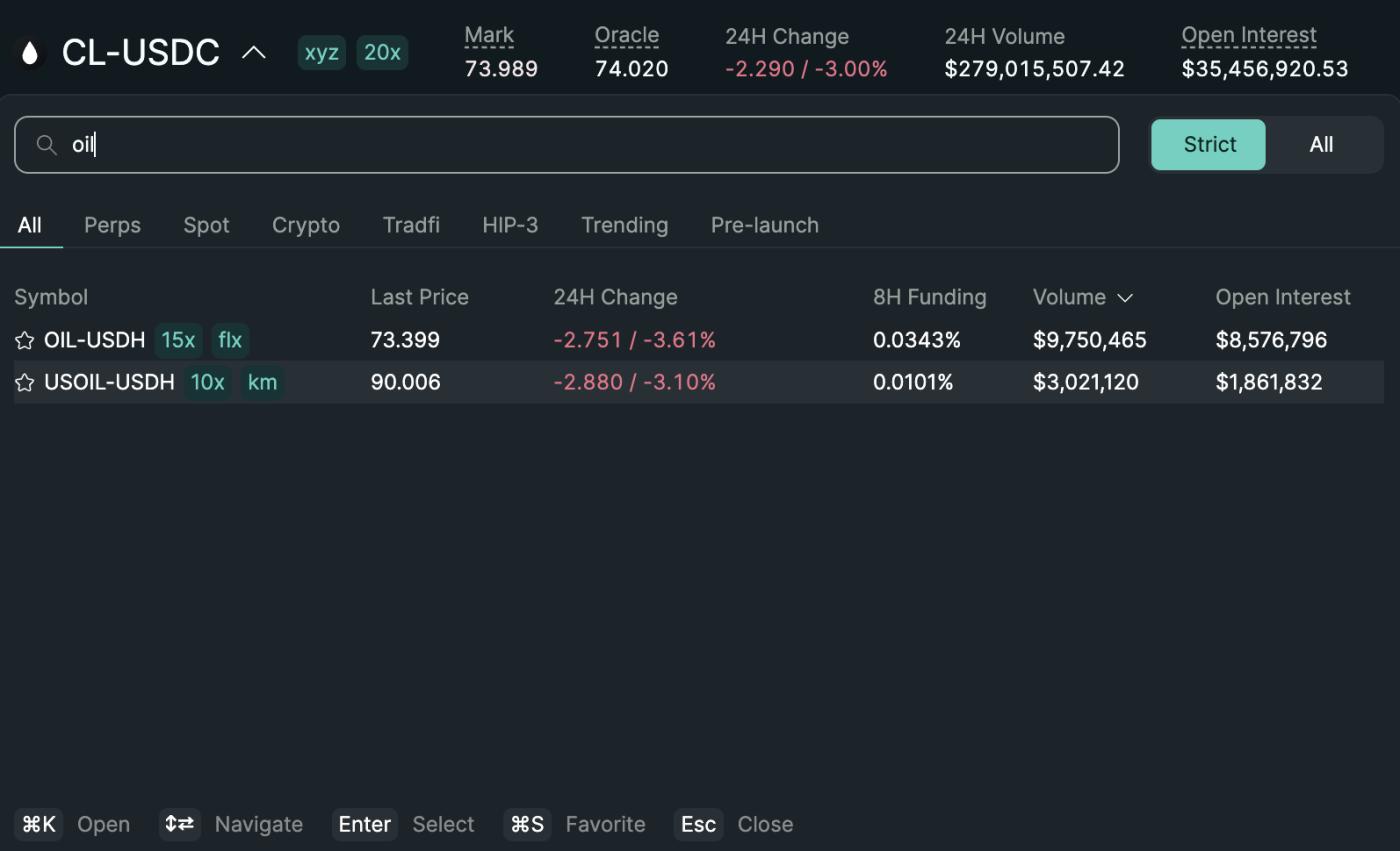 Perps Oil: Hyperliquid
On Sunday alone, volume on the exchange exceeded $6.4 billion.
Perpetual oil contracts on Hyperliquid have risen nearly 20%. Open interest (OI) on commodity-related Derivative has reached an all-time high, exceeding $1.1 billion.
This is not just a short-term surge.
According to data from Delphi Digital, Token TradFi assets accounted for 31.6% of total volume on Hyperliquid at the end of January 2024 — whereas just a month earlier this figure was below 5%. Products such as precious metals, stock indices, and individual stocks may be driving this shift.
on-chain data from Lookonchain shows that a whale deposited $7.35 million USDC into Hyperliquid to buy NVDA and SNDK shares long; currently holding over $11.94 million in NVDA and $2 million in SNDK, along with other limit orders worth $4.53 million awaiting execution. This occurred just before NVIDIA released its Q4 earnings report.
Numerous new integrations have fueled this growth rate.
Ripple Prime, launched in early February 2024, helps large financial institutions access Hyperliquid with on-chain perpetual products through the traditional prime brokerage Service Layer .
The Trojan (formerly UniBot) also integrates decentralized automated trading of traditional financial assets, including TSLA, AMZN, GOOGL, gold, and silver, directly on Hyperliquid's orderbook.
And on February 24, 2024, CoinShares officially listed the HYPE (LIQD) Staking ETP on Xetra — the first regulated product allowing traditional financial investors direct access to HYPE with Staking yields. Thus, the connection between traditional finance and crypto has now become much clearer.
The aforementioned surge in volume is particularly important for HYPE's price due to its direct mechanical link – this is the "burn flywheel" mechanism of this ecosystem.
Every oil, gold, and stock transaction burns Token permanently.
Approximately 97% of core transaction fees on Hyperliquid will flow into the Assistance Fund: an automated system wallet that buys HYPE on the market and burns it permanently.
HyperEVM's Gas Price will also be burned. This doesn't require governance voting or marketing events; it's done automatically via the source code, on-chain, and happens with every transaction—whether it's a Bitcoin perpetual contract, an oil contract during political upheaval, or a leveraged NVIDIA purchase order from a whale wallet.
Want to stay updated on Token like this? Sign up for Editor Harsh Notariya's daily crypto newsletter here .
Recent on-chain data shows the platform generated $2.74 million in fees in 24 hours, $16.96 million in seven days, and approximately $9.22 million worth of HYPE value was burned last week — an increase of over 20% compared to the week before that.
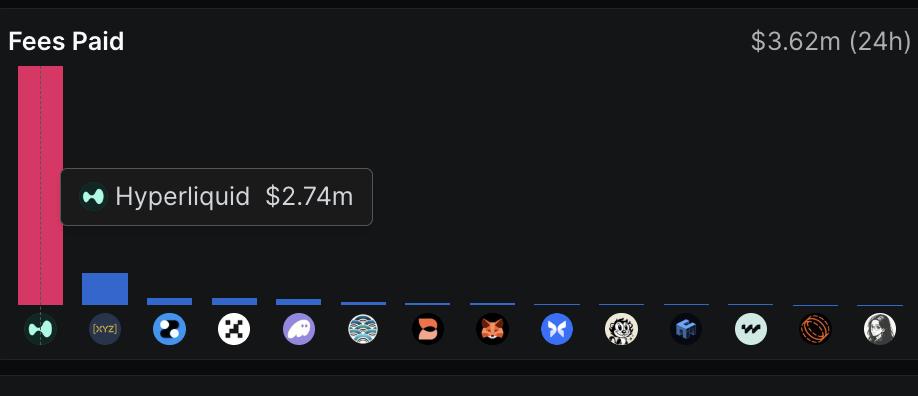 HYPE fees generated: defillama
On the supply side, only about 26,790 HYPE are created daily from Staking rewards. Recently, the amount of HYPE burned each day has exceeded 48,000 HYPE, resulting in a net withdrawal of over 17,000 Token per day from the market. The current Token burning rate is 1.8 to 2.3 times faster than the new issuance rate.
This makes HYPE distinctly deflationary given its current volume, even after accounting for the unlock on March 6, 2024, which will provide approximately 9.92 million HYPE for core contributors.
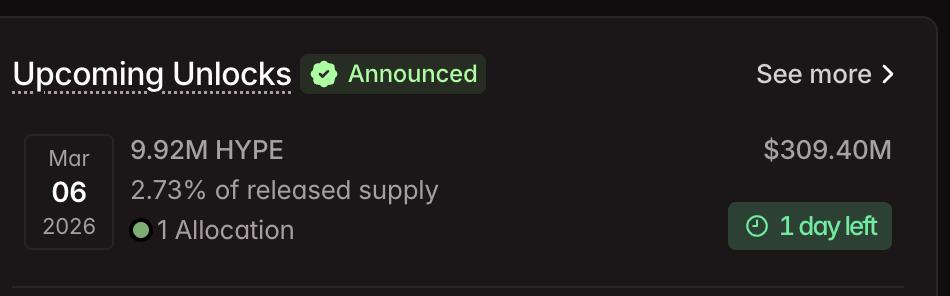 Hyperliquid: Tokenomist unlock
Hyperliquid's operating model is quite simple: The more traders use Hyperliquid to trade oil, gold, stocks, and commodities 24/7, the higher the transaction fees. These fees are then used to buy more HYPE on the market and burn it. As more Token are burned, the supply decreases. Meanwhile, increased demand strongly supports the price — and that's why large investors seem to be preparing for another price surge.
Smart money is going all-in while retail investors are betting the opposite.
on-chain data on HYPE has revealed a clear distinction between smart money and retail investors.
According to Nansen AI statistics, the overall sentiment towards HYPE for the tracked smart money wallets is "very optimistic".
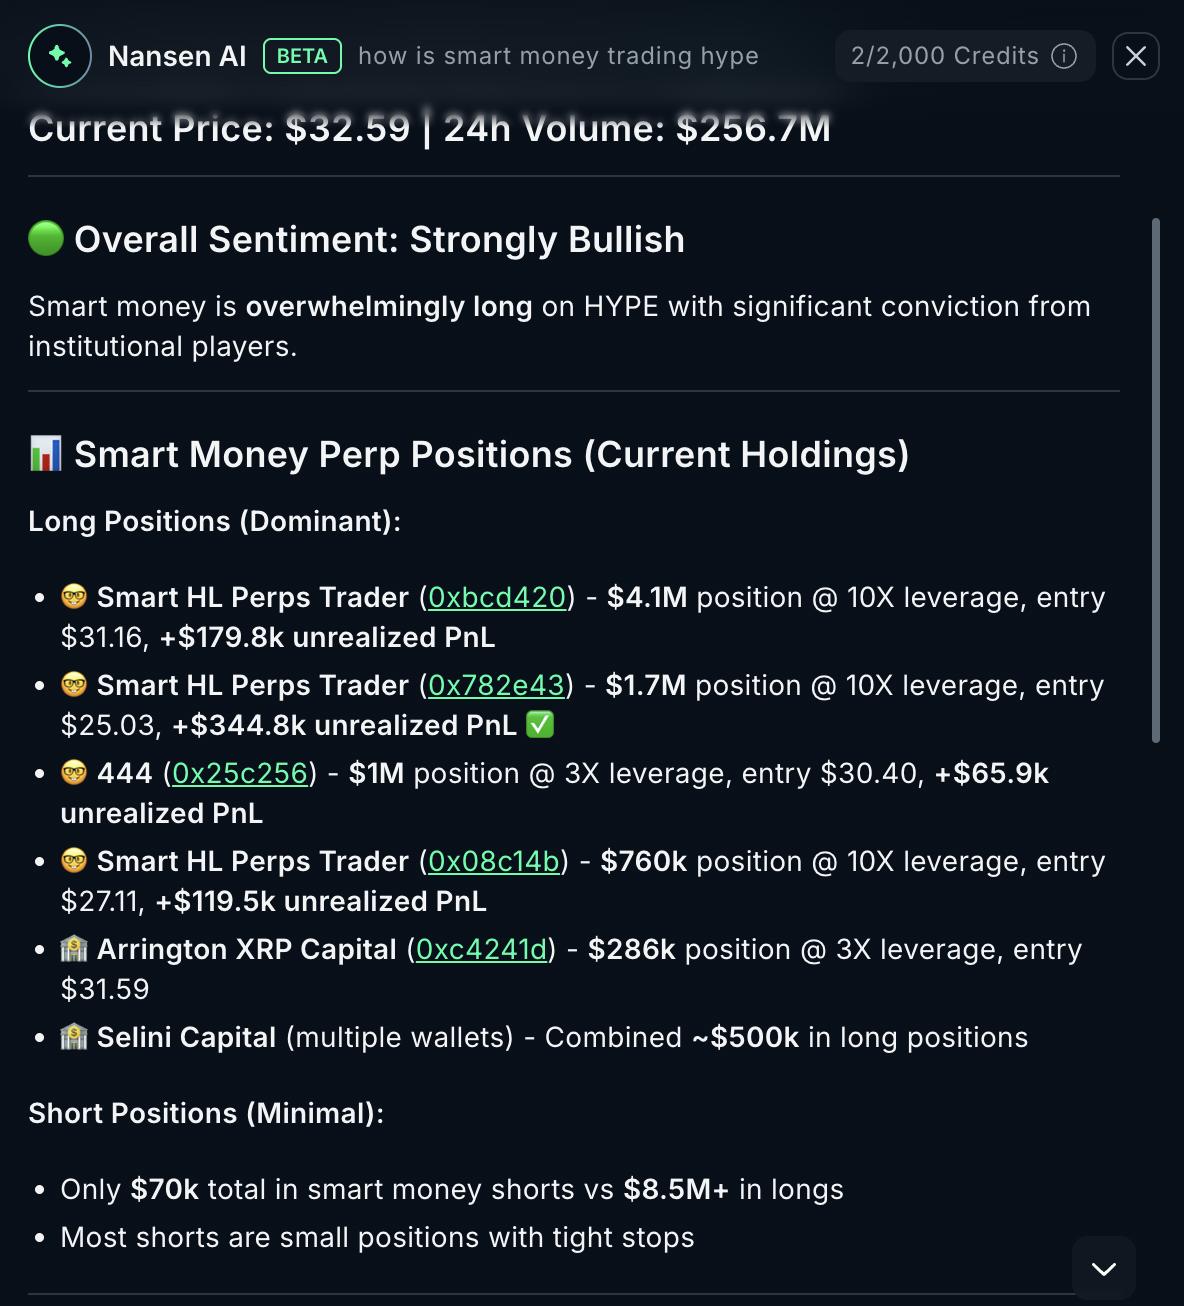 Information from Nansen AI about HYPE: Nansen
Notable names include Arrington XRP Capital with a $286,000 Longing position opened around $31. Selini Capital also holds approximately $500,000 in Longing positions across multiple wallets. Additionally, several smart money traders are monitoring Hyperliquid Derivative contracts with entry points between $25 and $31 — all currently profitable (yet to close) at the time of writing.
Conversely, retail investors are showing the opposite trend, especially on larger timeframes. Data from the Bybit HYPE/ USDT 30-day liquidation map shows that the total value of liquidated Short positions is around $33 million, while Longing positions only reached about $23 million.
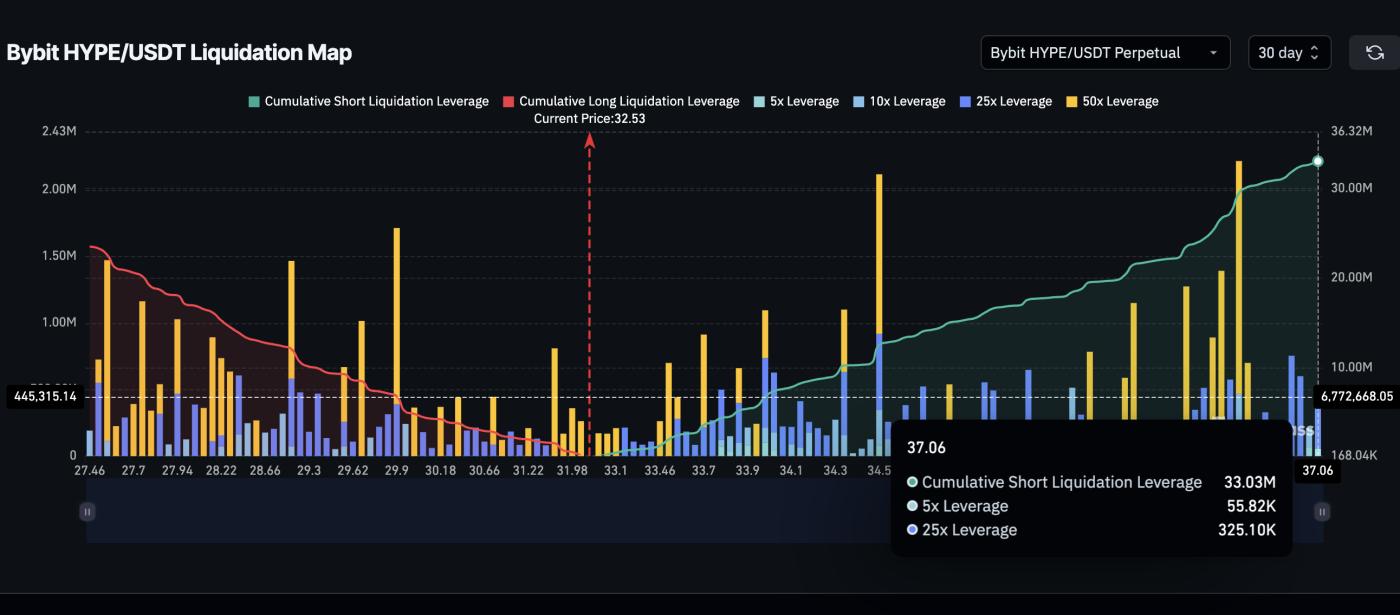 HYPE liquidation map: Coinglass
Large clusters of leveraged Short positions are concentrated around the $34 price level, creating the potential for a "Short squeeze" if the HYPE price can break through this zone.
The Smart Money Index, which tracks the positions of experienced traders, also confirms the data from Nansen AI. The indicator crossed above the signal line around February 28, 2024, coinciding with a sharp price increase. During the rally at the end of January 2024, the indicator reversed downwards immediately after being rejected at the $43 level. Currently, the indicator is trending upwards again — however, it still needs to break through the nearest horizontal resistance to confirm a stronger trend.
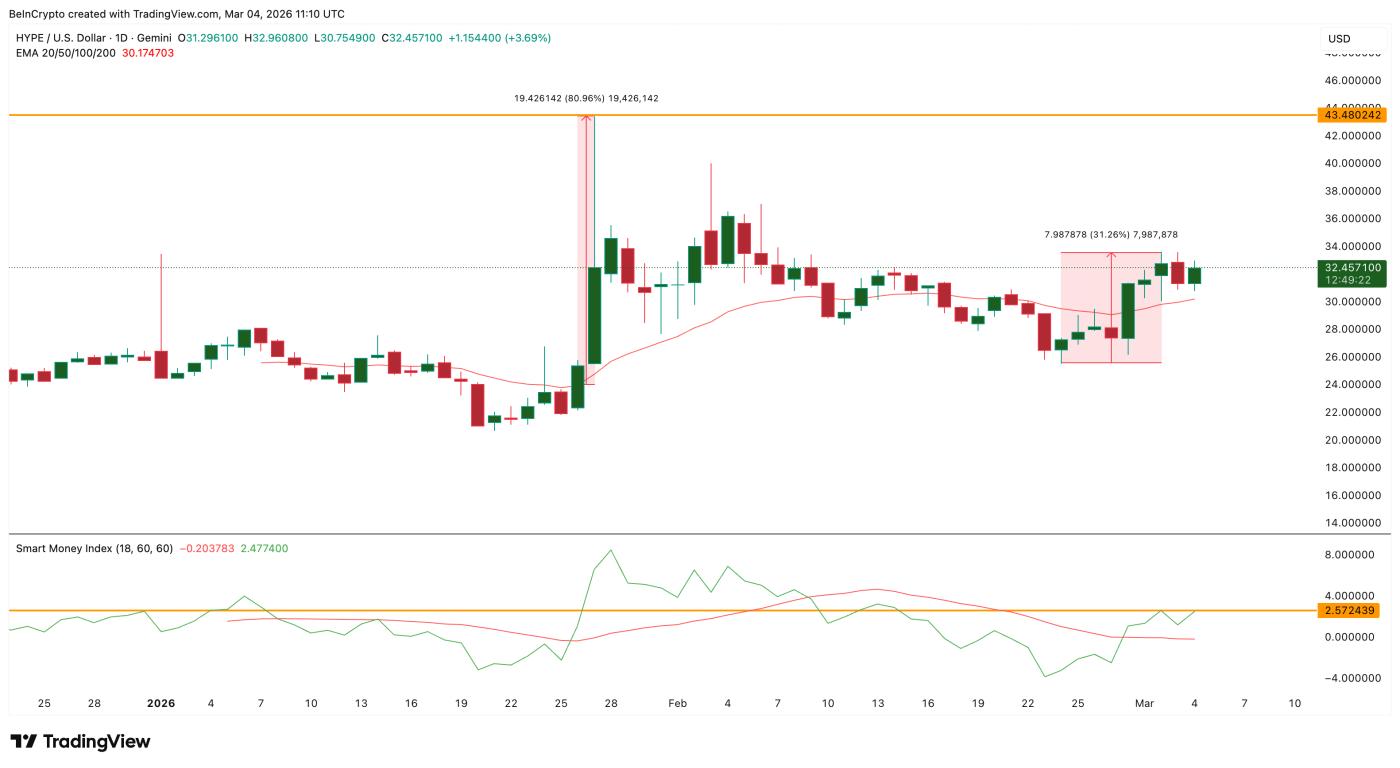 HYPE price structure: TradingView
A clear contrast is evident: smart money is consistently accumulating HYPE shares while retail investors are primarily leaning towards Short positions. This combination, along with the liquidation clusters just above the current price, often sets the stage for strong rallies in the crypto market. The technical price levels above also clearly indicate the next targets HYPE might aim for.
HYPE sets a price target of $62 to establish a new all-time high.
Hyperliquid's price surge becomes even more significant from a technical standpoint as HYPE has broken above and held the 20-day Medium . The last time HYPE surpassed the 20-day EMA was at the end of January 2024, after which the Token surged approximately 81% to $43 before a sharp sell-off and correction.
Although the current rally has only reached 31% of the short-term Dip , the HYPE price is currently about 15% higher than the 20-day EMA. During the January rally, the Token price was much further below the EMA but still had the potential to rise by 81%. This suggests that if the pattern repeats, the current rally may still be just the beginning.
The nearest technical resistance levels are around $34. This is also the area where a series of heavily leveraged Short positions are concentrated, making it the first challenge. If the price breaks through $34, it is highly likely to trigger a series of Short liquidations and push the price up very quickly.
The next technical milestones are $39 and $43. If it surpasses $43, the next expansion zone is $48 and $62 — higher than the historical peak of over $59 in September 2025. With the current price around $32, reaching these levels would give HYPE nearly 90% room for further gains.
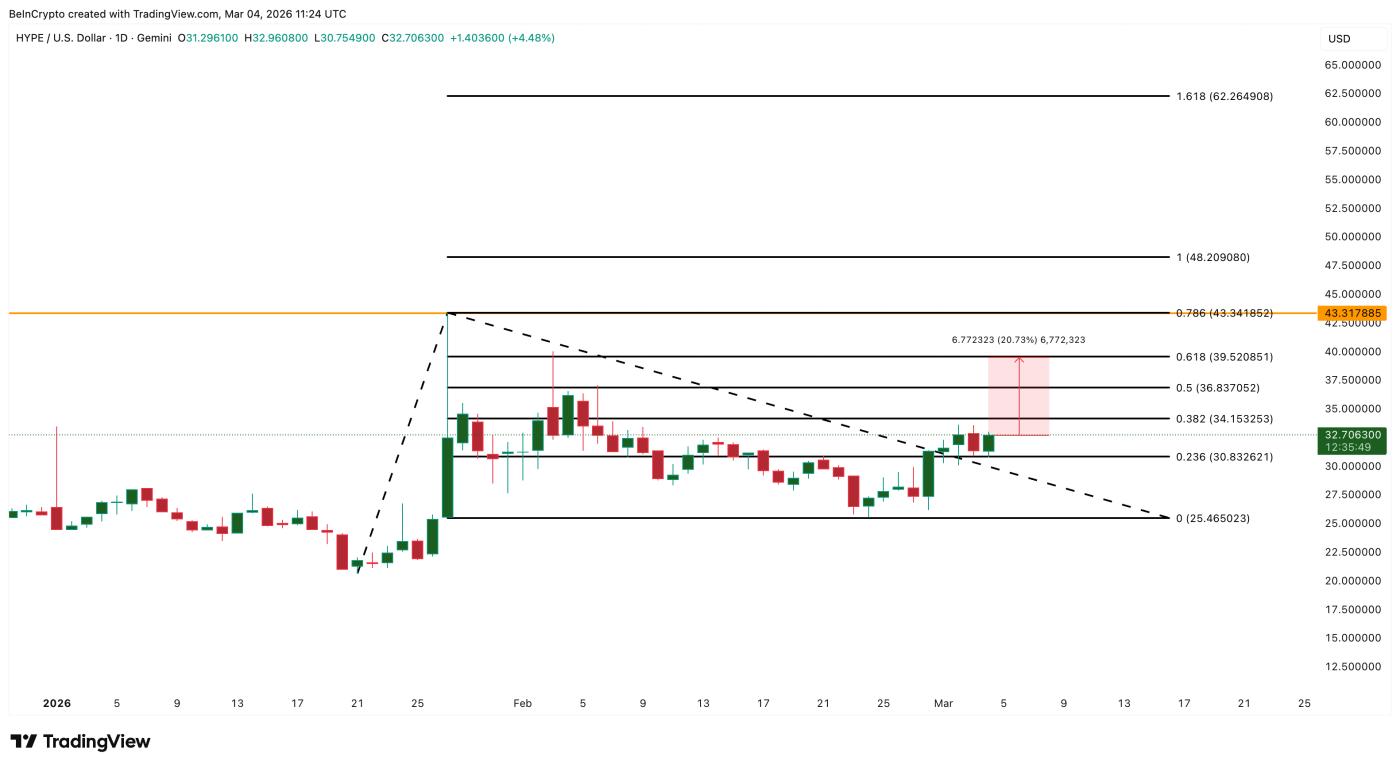 HYPE price analysis: TradingView
On the downside, a drop below $30 would weaken the uptrend. A fall below $25 would break the entire trend, even if the TradFi burn flywheel pattern remains strong.