

Bitcoin's breaking out.
As pointed out on Monday, BTC's daily chart was trading within a symmetrical triangle & breakout is now confirmed.
We are also back above the 200w EMA & have closed above it 3 days in a row.
It's progress but we need to see what happens on US open 🤞
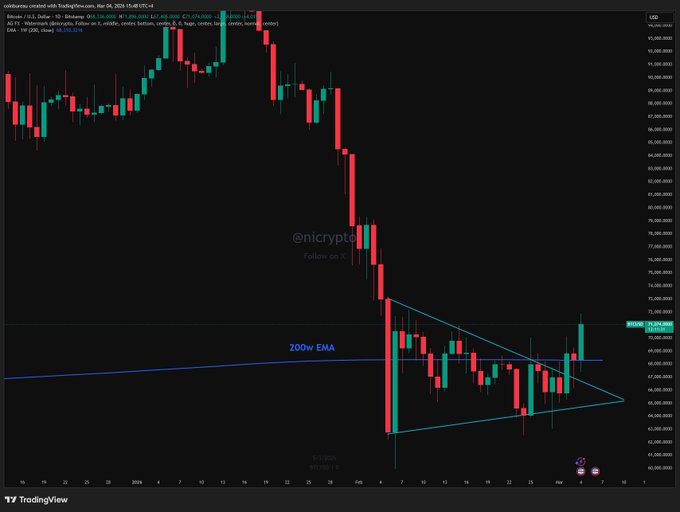
$BTC breaking out of a symmetrical triangle confirms a classic technical pattern signaling potential continuation of the uptrend
Sector:
From Twitter
Disclaimer: The content above is only the author's opinion which does not represent any position of Followin, and is not intended as, and shall not be understood or construed as, investment advice from Followin.
Like
Add to Favorites
Comments
Share

