Dogecoin is trading at approximately $0.09076, reflecting a 3.93% decline over the past 24 hours. Mild selling pressure has kept the asset under strain, with broader time-frame data confirming that bears maintain the upper hand. The current price places $DOGE near critical support and resistance levels.
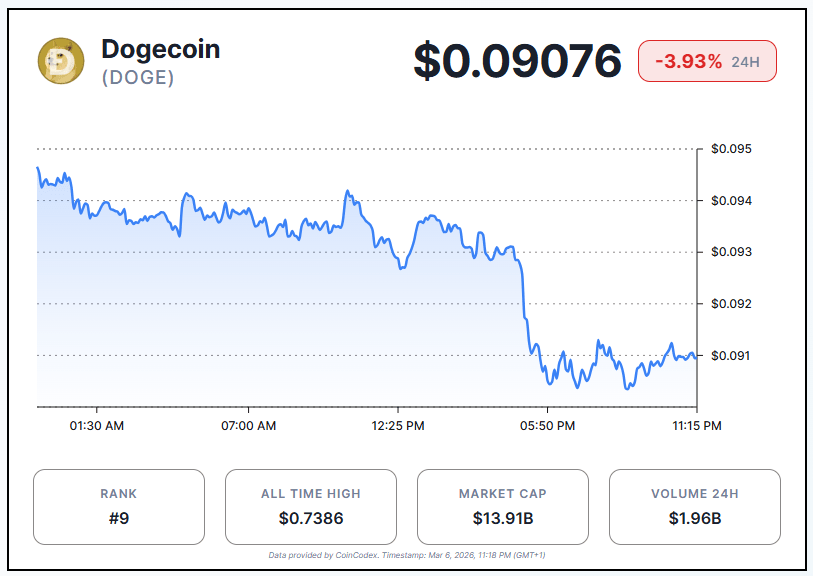
Intraday trading showed an early push toward $0.098, but momentum failed to hold. Price retreated and has since fluctuated in a tight range between $0.093 and $0.096. That range signals a short-term consolidation phase as traders weigh the asset's next move.
Chart Structure Points to Ongoing Bearish Pressure
On the daily chart, Dogecoin continues to move within a broader downtrend that has developed over recent weeks. The middle Bollinger Band sits near $0.0963, and the price remains below it, a bearish signal that sellers still control trend direction.
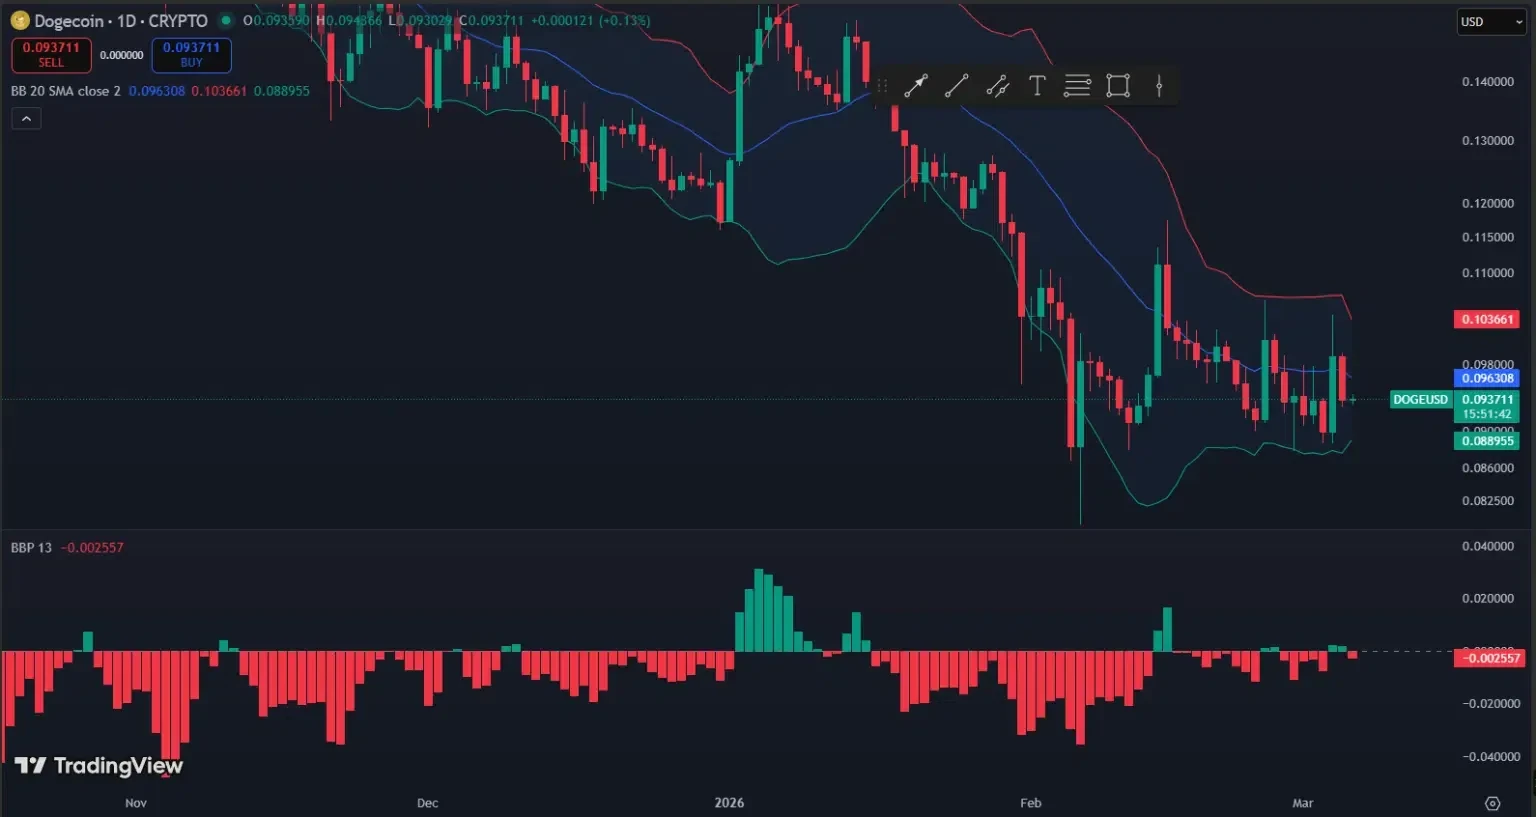
The upper Bollinger Band near $0.1036 serves as a firm resistance ceiling. The lower band around $0.0889 marks the nearest support level if selling intensifies. A reclaim of the $0.096 midline could open the path toward the $0.103 resistance zone.
The Balance of Power indicator registers a slightly negative reading of -0.0025, confirming that sellers hold a marginal edge. However, the histogram shows that bearish momentum is weakening compared to previous sessions. That shift could precede a stabilization attempt, though no confirmed reversal signal has emerged yet.
Futures Flows Show Short-Term Demand Despite Longer-Term Caution
Recent derivatives data reflect mixed but active capital movement. Over the past 30 minutes, $DOGE futures recorded approximately $22.30 million in inflows and $15.50 million in outflows, resulting in a net inflow of around $6.81 million. The one-hour window shows inflows of $28.97 million, versus outflows of $21.05 million, resulting in a $7.92 million net figure.
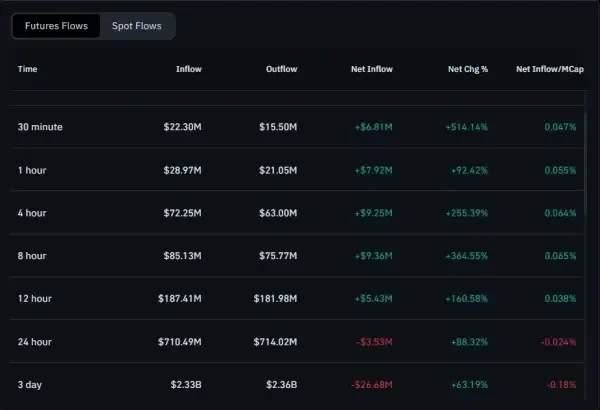
These short-term readings indicate that traders are actively adding fresh capital to $DOGE futures. The 4-hour and 8-hour windows show net inflows of $9.25 million and $9.36 million, respectively, suggesting steady participation across shorter intervals.
The 24-hour data, however, tells a different story. Total inflows of $710.49 million fall just short of outflows of $714.02 million, resulting in a net outflow of $3.53 million. Over the past three days, the net outflow has expanded to $26.68 million. That divergence between short-term inflows and longer-term outflows reflects an uncertain market in which short-term traders are active but broader conviction remains low.