

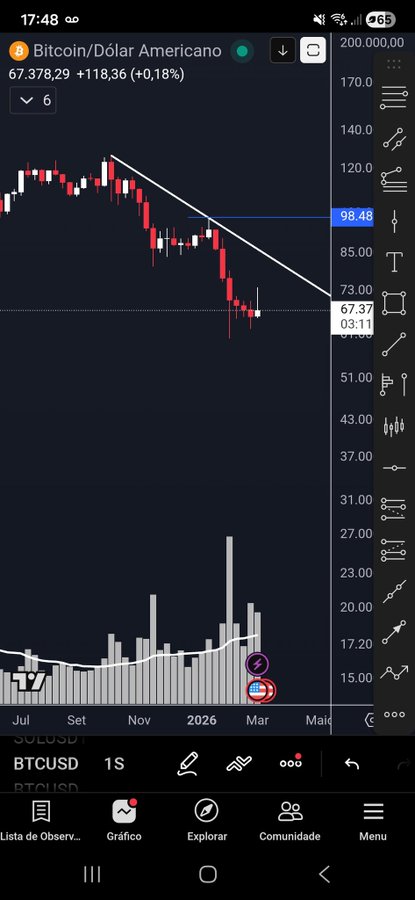
Let's analyze the candlestick chart. Obviously, the price would form a bottom in this zone, as it was an all-time high in 2021. And what about this week's candlestick chart? I believe we'll see BTC hitting this resistance line to continue the decline.
This article is machine translated
Show original
Sector:
From Twitter
Disclaimer: The content above is only the author's opinion which does not represent any position of Followin, and is not intended as, and shall not be understood or construed as, investment advice from Followin.
Like
Add to Favorites
Comments
Share
Relevant content


