
Market outlook at midday on March 17th.
$BTC opinion:
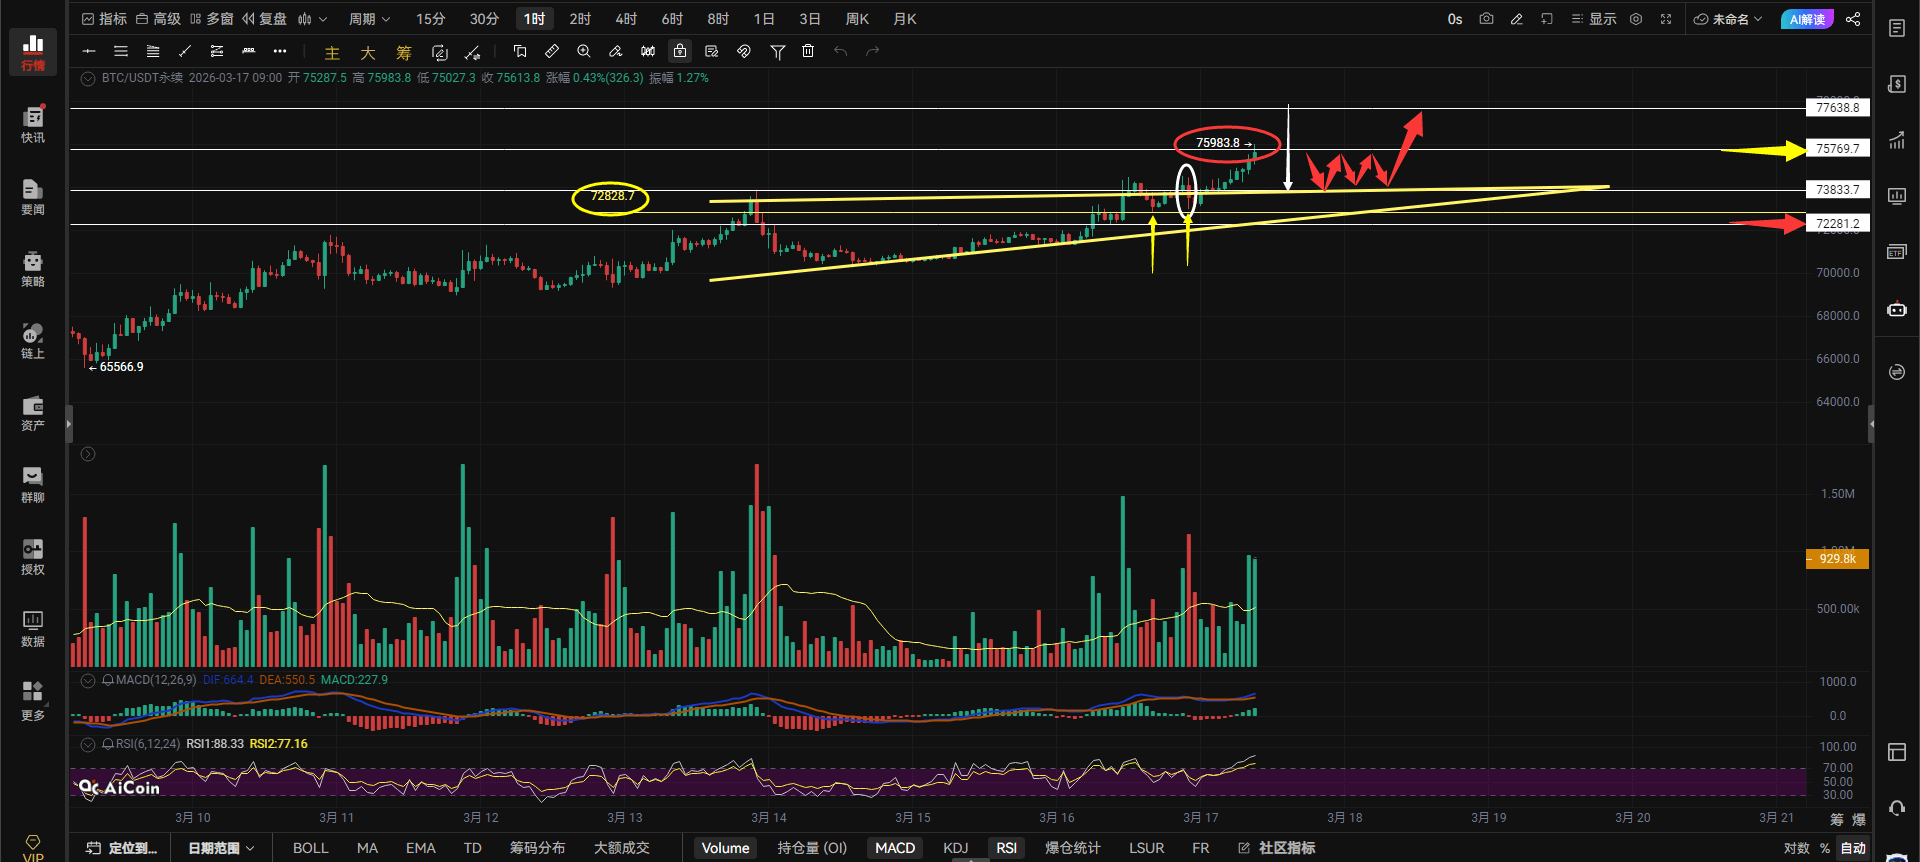
Bitcoin has once again reached a new high and broken out of the triangle pattern, having already tested the resistance at 75769 for the first time. There will likely be a second and third test of this resistance level; it's unclear when it will be broken. If it breaks through, we can expect BTC to challenge the 77638 level, but there's a prerequisite: BTC cannot fall back into the triangle's interior. It must consolidate around the upper boundary of the triangle, between 73833 and 75769. This consolidation after the upward move is essentially a mid-term break. If it falls back into the triangle's interior, it will retest the support at 72828. If it holds, it will oscillate within the triangle. As long as it doesn't break below the triangle's corresponding price of 72281, everything is fine; hold your long positions. Looking at the candlestick pattern circled in white below, some traders may have been misled by this pattern. Until the subsequent market action unfolds, this is definitely a top formation. Is it okay to short when a top formation appears?

Normally, a top formation can be used to short, but this particular top formation is not. Why? Look at the yellow arrow below; the second pullback to the support level of 72282 was not as low as the first pullback. The pullback did not break the low of the first pullback. This top formation is deceptive; it's just a normal pullback and doesn't indicate a downward trend. Then the market started to rise. You can't just short when you see a top formation and go long when you see a bottom formation. You have to consider the context. In a bullish context, you can only go long on pullbacks. Remember this!

BTC broke through 75679 with volume, and aggressive traders went long on the right side. It broke down below 74886 with volume and failed to recover on the rebound, so shorting on the right side was recommended to profit from the pullback.
If BTC breaks through and holds above 75679 on the hourly chart, the next target is 76739-77513. A break above 75679 would allow it to continue its upward trend.
If the price breaks below 74719 on the 4-hour chart, the next target is 73074-72252.
Resistance levels: 75679-76739-77513
Support levels below: 74476-72918-72221
$ETH Approach:
If the price breaks through 2362 with volume, go long on the right side and stop loss.
If the price breaks below 2330 with significant volume, consider shorting on the right side, but set a stop-loss order.
If the price retraces to 2269 and confirms the support level, consider going long.
Stop loss if it falls below 2233.
If the two-point indicator holds above 2362 on the hourly chart, the next target is 2400-2439.
Watch for a potential short position around 2400 on the two-point line.
Stop loss if it breaks through 2439. See comments section.
Market conditions change rapidly; entry and exit points should be determined based on real-time market conditions. Follow the trend after a breakout! Regardless of your confidence level, strictly adhere to stop-loss and take-profit strategies! That's all for today! Follow me to stay on track! If you're unsure about future market strategies, you can follow me on WeChat: Auroraa4466