

The pressure is being digested, but the belief continues.
Written by: Glassnode
Compiled by: AididiaoJP, Foresight News
Bitcoin rebounded to nearly $76,000, primarily driven by ETF inflows and a recovery in spot buying. Short positions remain crowded, funding rates remain negative, and pressure in the options market has eased—all indicating an improving market environment, but it's too early to form strong convictions.
Key points
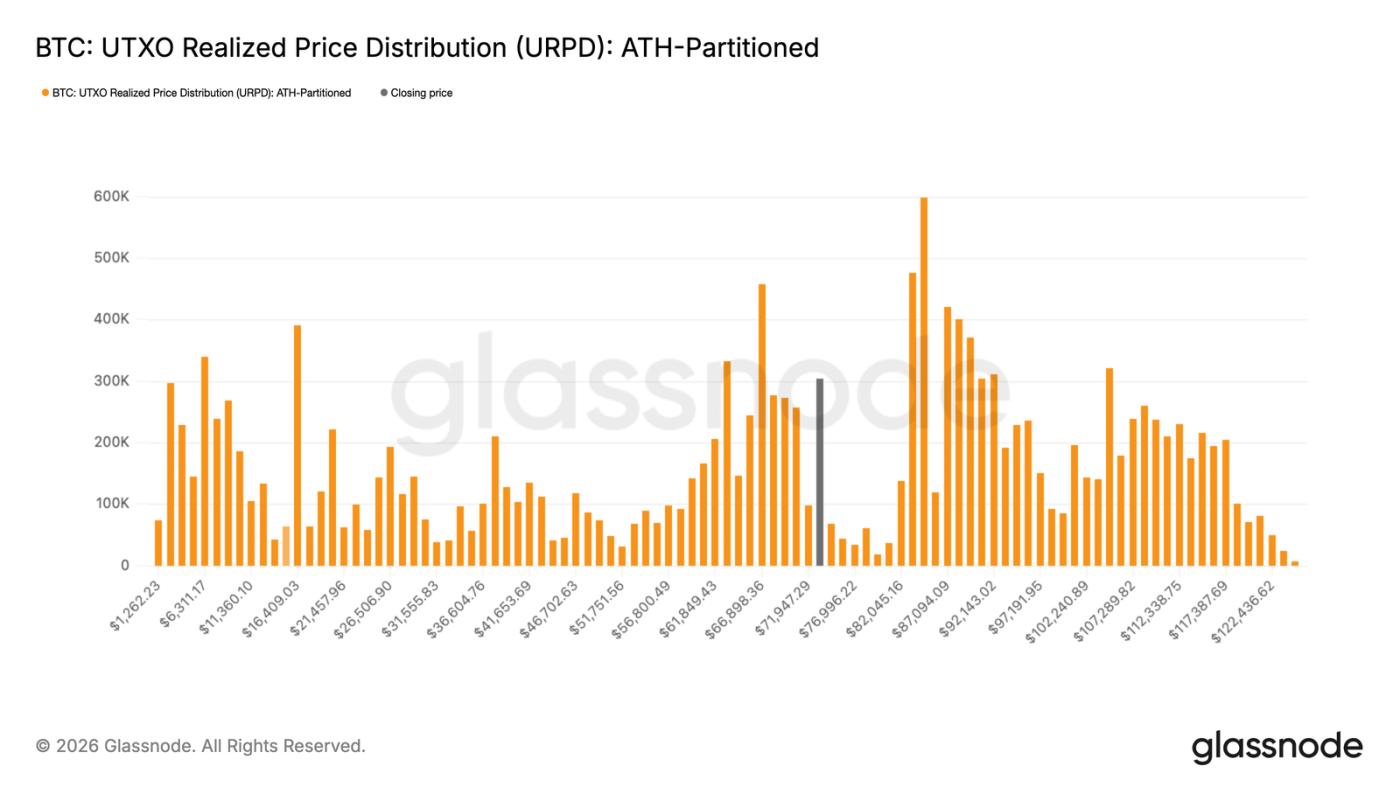
- Bitcoin has broken through $70,000 and entered the "vacuum zone" between $72,000 and $82,000. Looking at the URPD indicator, there is almost no resistance on-chain, and significant selling pressure is expected only near the upper limit of $82,000.
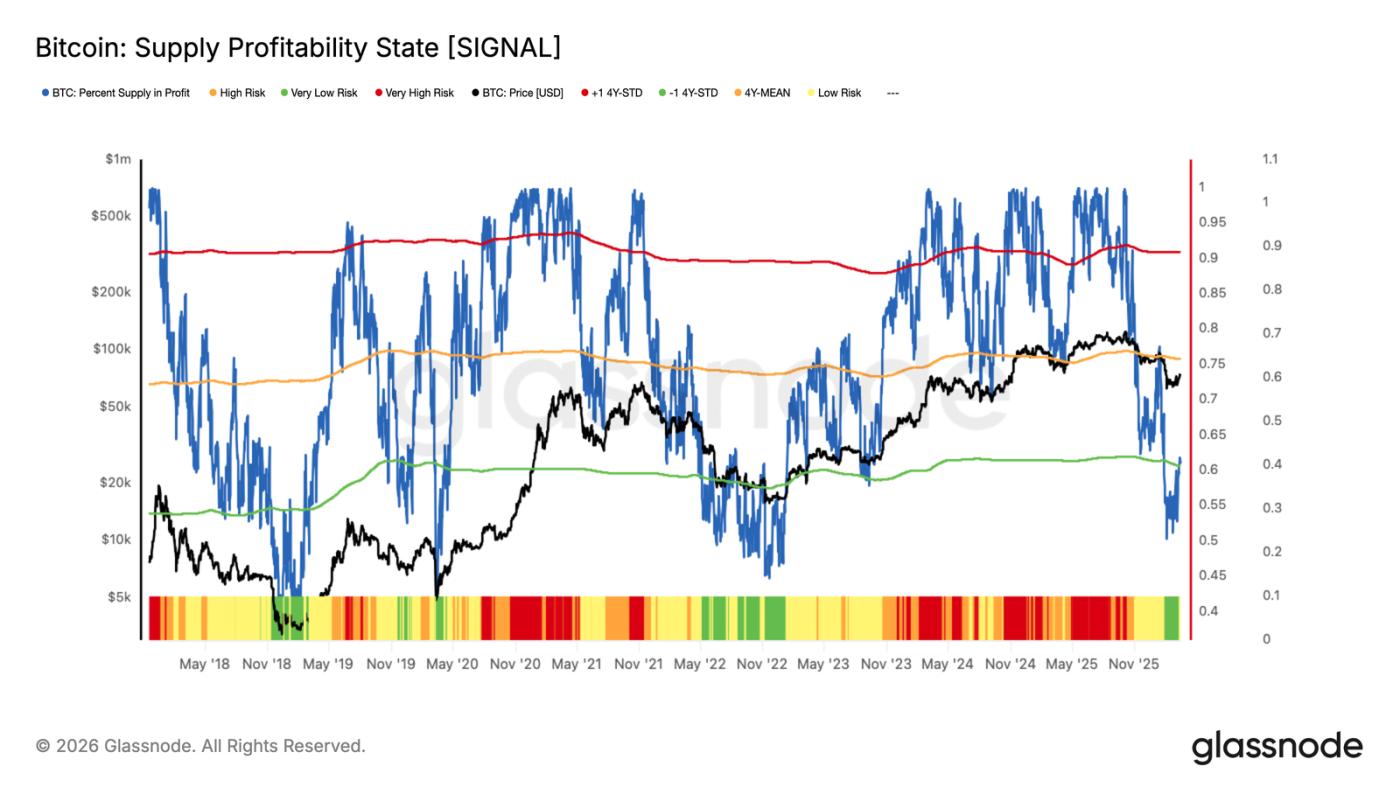
- The "profit-generating supply ratio" has rebounded to around 60%. Historically, this level often corresponds to the exhaustion of the initial rebound after the bottom of a cycle. To confirm that a bull market has truly arrived, this indicator needs to firmly stand above 75%.
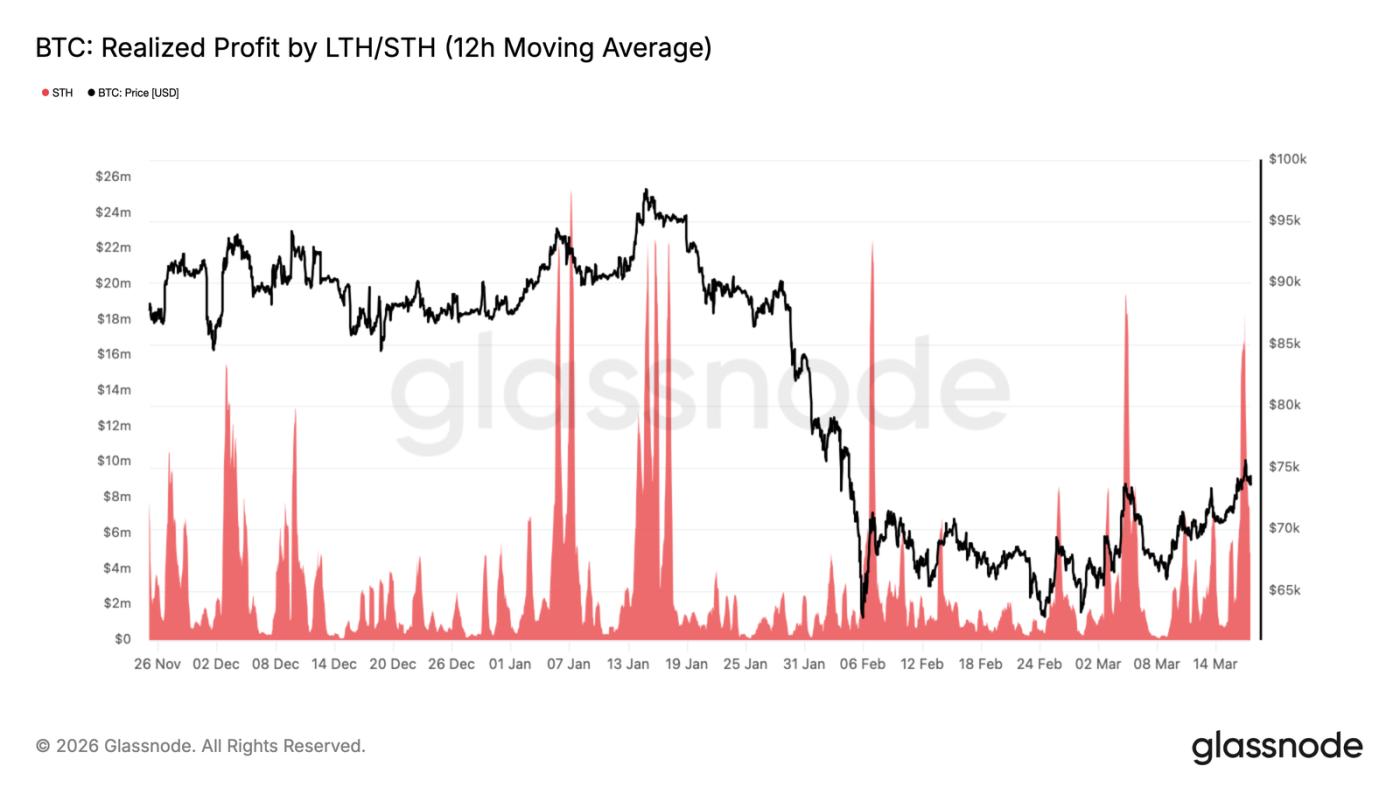
- As prices approached $74,000, "short-term holders realizing profits" surged to $18.4 million per hour, mirroring the situation in February—short-term holders continuously sold off during the rise. The key now is whether the market can absorb this selling pressure above $70,000, which is crucial for reaching $78,000 to $82,000.
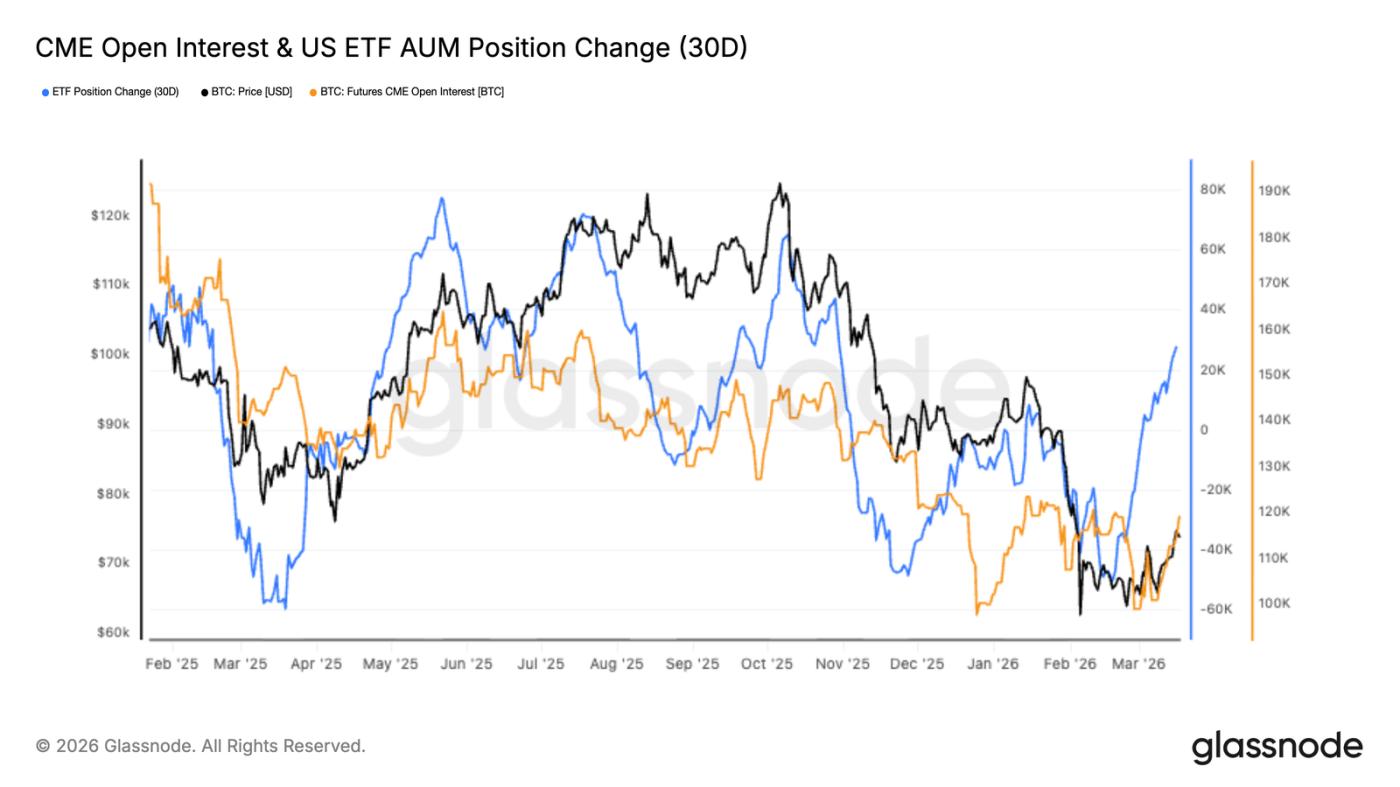
- Over the past month, ETF inflows have rebounded significantly, indicating that institutional demand is returning and the market is once again driven by spot trading.
- The relatively low open interest in CME futures indicates that this surge was primarily driven by spot purchases rather than leverage.
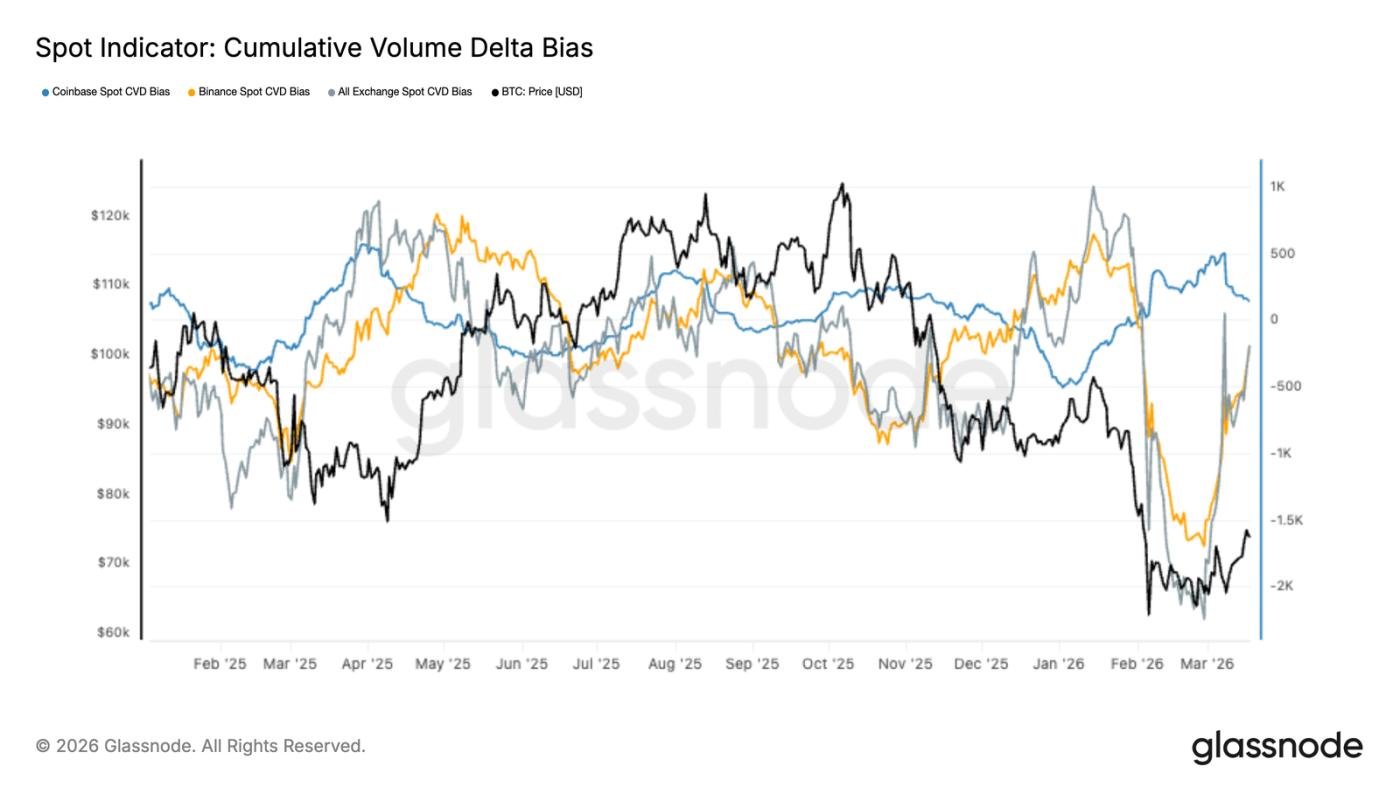
- The "Spot Cumulative Trading Volume Delta" on major exchanges has turned upward, indicating that the previous continuous selling pressure has turned into new buying accumulation.
- Coinbase's spot trading activity has stabilized and is showing signs of recovery—a clear indication that institutional investors are starting to re-enter the market. Selling pressure on Binance has also noticeably weakened; the previous sell-off has largely subsided.
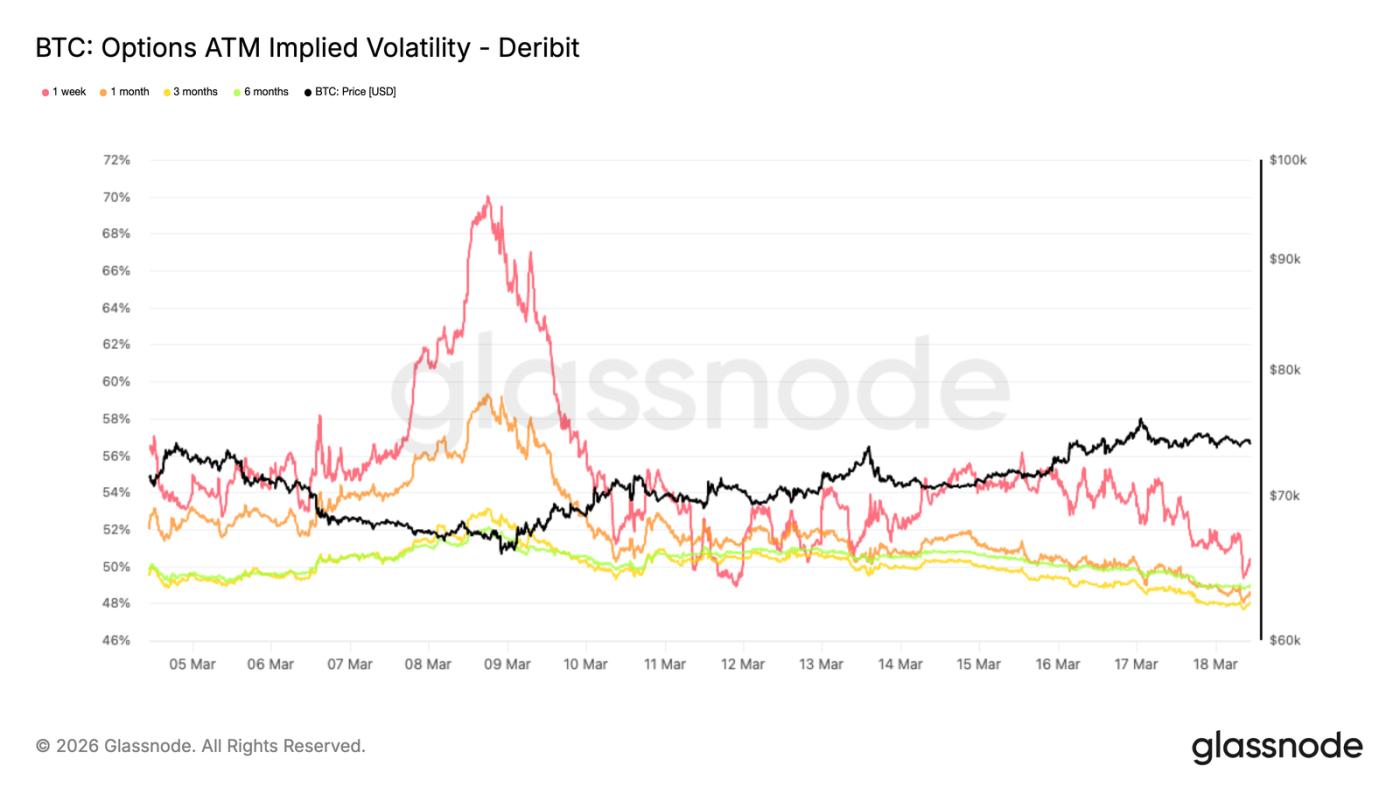
- Implied volatility across all maturities is declining, indicating reduced hedging demand and a return to normalcy in the market.
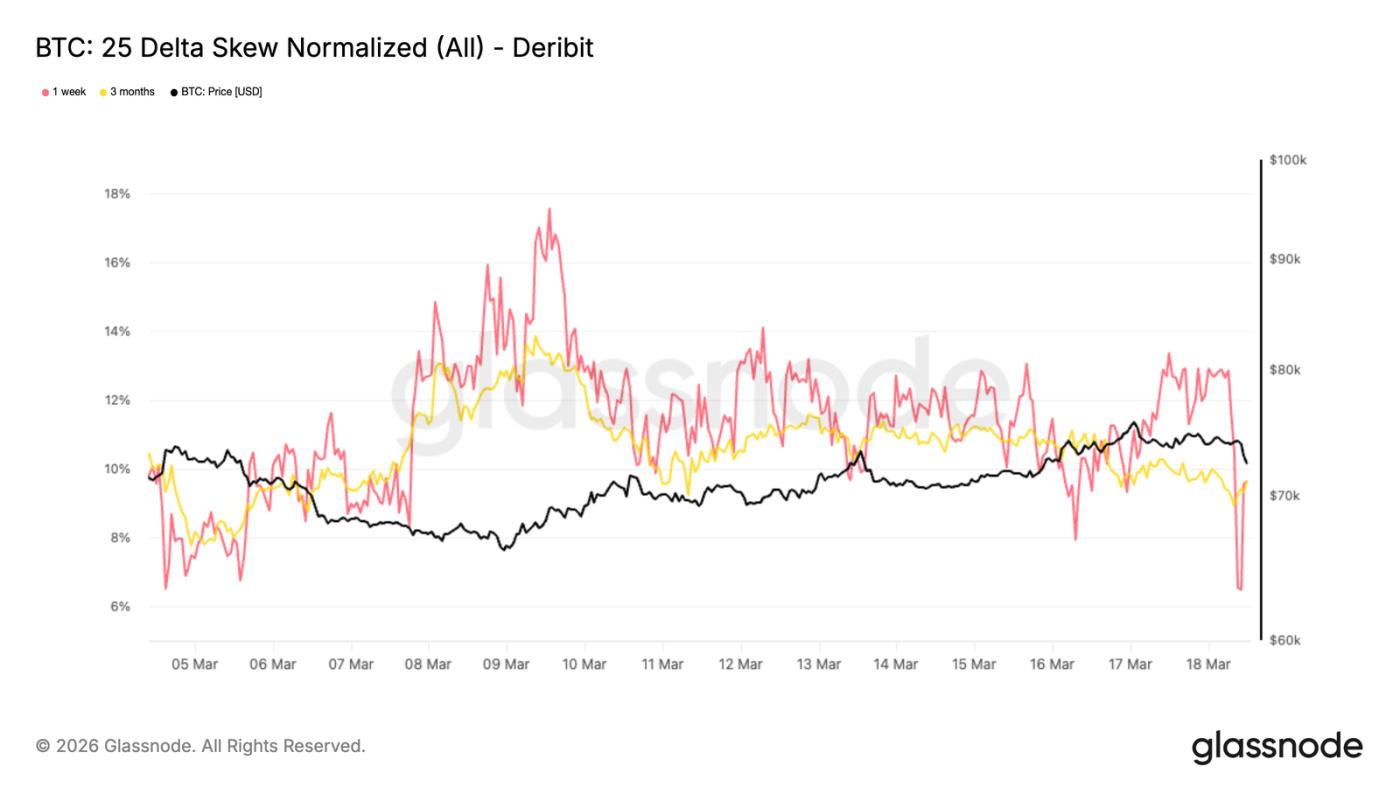
- The options skew indicator has turned slightly positive, indicating that some people are starting to position themselves for an upward move, and sentiment is improving.
- Market makers' Gamma positions are close to neutral, meaning that options will not amplify market volatility in the short term.
On-chain data interpretation
Finally broke out of the dense area
After several weeks of fluctuation, Bitcoin has finally stabilized above $70,000 and is now around $74,000, completely breaking out of the trading range of February and March. This is clearly visible using the URPD indicator—this indicator shows at what price people are buying coins, and where there is the most buying activity, which represents support or resistance.
Data shows a large amount of trading volume accumulated between $59,000 and $72,000, mainly from positions established in February and March 2026. The price has now surpassed this densely traded area. Further up, the $72,000 to $82,000 range represents a vacuum, with few previous buyers, resulting in minimal resistance during the upward surge. This breakout occurred amidst geopolitical uncertainty and resilient external markets, indicating that investors currently view macroeconomic headwinds as temporary. Regardless of long-term trends, the price is likely to fluctuate within the $72,000 to $82,000 range in the short term.
A single rebound doesn't prove anything.
Although it broke through 70,000 and entered the vacuum zone of 72,000 to 82,000, a single surge cannot indicate a structural reversal. To see if the market is healthy, we need to look at whether everyone is making money—the "profit-sharing ratio" indicator is very useful, as it counts how much Bitcoin is currently in a floating profit state.
Historically, from the bottom of a bear market to the early stages of a bull market, this indicator typically climbs from below 60% (-1 standard deviation) to its long-term average of around 75%. This recent surge has pushed it to around 60%, a level that, in the past, often marked the exhaustion of the first rebound. Only if it can firmly establish itself above 75% would it truly indicate the start of a bull market; if it continues to fluctuate around the current level, it's simply a repeat of the old bear market rally scenario.
Let's see how the market absorbs the selling pressure.
Besides observing how many people are making a profit, another important perspective is how the market absorbs these profits—when prices rise, there will always be someone wanting to sell. If recent buyers sell off, but the price doesn't fall back to the densely traded $59,000 to $72,000 range, then the likelihood of further upward movement is much higher. This week, when the price surged above $74,000, the 12-hour moving average for "short-term holders realizing profits" spiked to $18.4 million per hour, exactly the same as in February—back then, as soon as the price reached $70,000, there were sellers, making it impossible to break through.
This is typical of early rallies in a bear market: new buyers often lack conviction and are quick to sell as soon as they make a small profit. If the market can withstand this selling pressure and hold firmly above 70,000 in the coming weeks, the likelihood of it reaching 78,000 (the true market average) or even 82,000 (the upper edge of the trading range) increases significantly.
Off-chain data analysis
Institutions begin to quietly enter the market.
This Bitcoin rebound coincided with a significant recovery in allocations to US spot ETFs—the 30-day holdings change swept away the previous outflow gloom and turned upward. This indicates that institutional demand has indeed returned, and funds are starting to allocate to spot assets again.
Meanwhile, CME futures open interest remained sluggish, having just halted its decline. This rally was primarily driven by physical buying, not leverage. Historically, this structure is healthier: prices are pushed up by real money, not by leveraged bubbles.
ETF size is increasing, but futures positions haven't moved—this indicates that institutions are only just beginning to re-enter the market. If CME positions also pick up later, it shows that confidence is strengthening, making the upward trend more stable.
Spot buying has returned.
The "Spot Cumulative Trading Volume Delta" has rebounded significantly recently, and Binance has now turned into a net buyer.
This inflection point coincides with the timing of Bitcoin's rebound from its low of 60,000, indicating that this surge is indeed supported by real money and is not purely driven by derivatives. Coinbase's cumulative trading volume Delta has also stabilized and rebounded—this level usually indicates institutional activity, suggesting that some people are starting to hoard.
Data from major exchanges is improving, indicating that market depth is recovering and buyers are regaining confidence. Although it hasn't reached a fever pitch yet, it has shifted from distribution to accumulation, and the spot market has once again provided a floor for prices—this is key to a sustainable rebound.
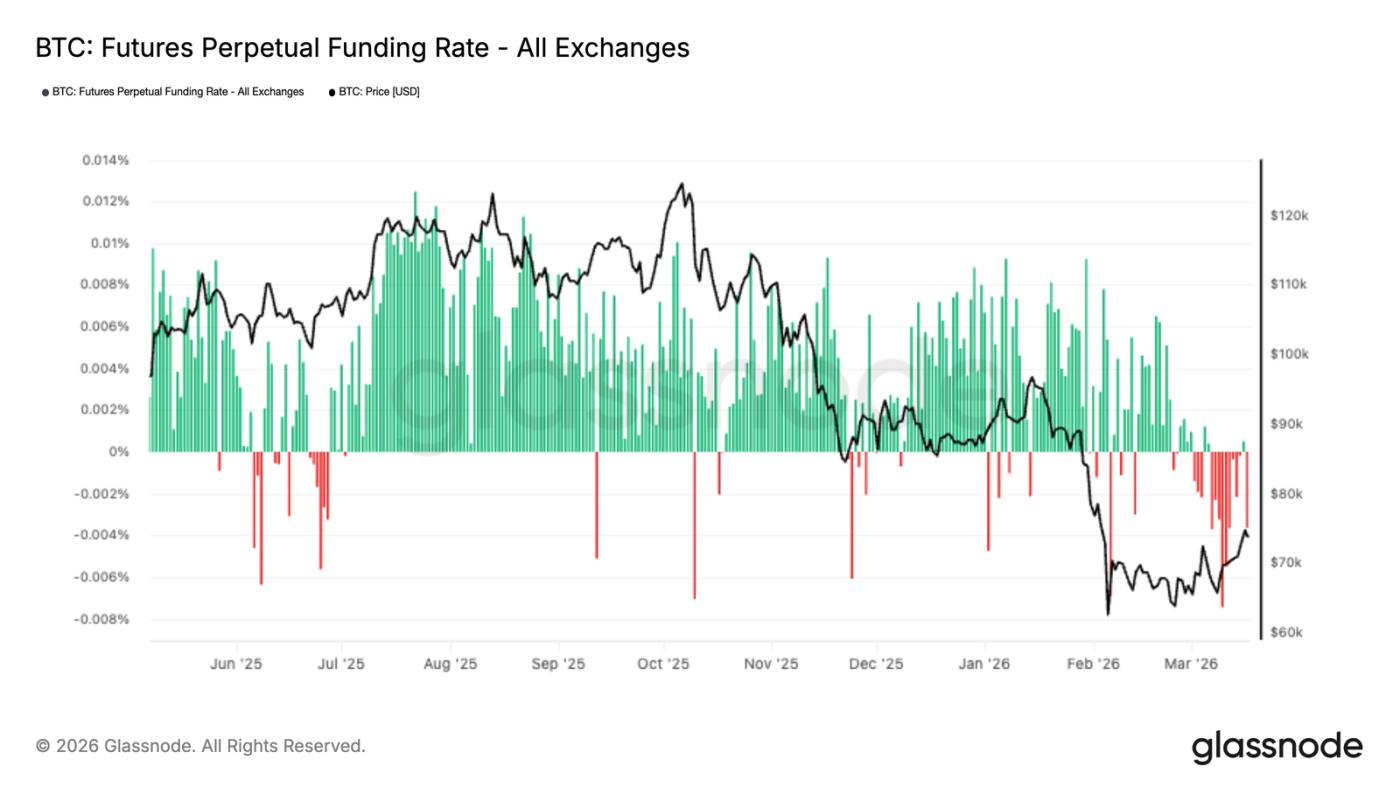
Funding rates show: Everyone loves short.
In recent weeks, funding rates for perpetual contracts have plummeted into negative territory—indicating that short sellers have a clear advantage in the derivatives market. This bearish sentiment built up as Bitcoin traded between $60,000 and $70,000, with leveraged traders generally pessimistic about the future.
Interestingly, the breakthrough of 74,000 occurred precisely against the backdrop of persistently negative funding rates. What does this indicate? It suggests that at least part of this surge was due to short covering, rather than a strong upward push by bulls.
This situation often indicates that short positions are already crowded and could be squeezed at any time. A price increase, with short positions being liquidated, could actually push the market higher. In the short term, this is indeed beneficial, but for a sustained trend to develop, we need to wait for funding rates to return to normal and for the long and short positions to rebalance.
ATM implied volatility declines
The shock of Bitcoin volatility is subsiding. One-week implied volatility has fallen from around 56% at the beginning of the week to around 50% now, and longer-term implied volatility has also generally decreased by 3 percentage points.
This indicates that traders are no longer as nervous as before, and the volatility during the market panic has subsided. A decrease in implied volatility usually signifies that the market is transitioning from a state of stress to a relatively stable period.
The signal is clear: people are gradually withdrawing their panic hedging. We've observed a significant amount of downside protection being closed out, which is one reason for the decline in implied volatility and has also contributed to this rebound. The market is moving towards a more balanced state. In an environment where both spot and derivatives trading is relatively quiet, options hedging may become a significant force influencing prices—and currently, the upward path seems more favorable.
25 Delta Skew tends towards neutral
After implied volatility normalized, the skew also began to adjust. The 25-delta skew is still negative, around -10% across all maturities, which is 4 to 7 percentage points lower than the previous high.
Negative skewness means that put options are still more expensive than call options—indicating that people still want to buy protection, and market makers are unwilling to sell downside volatility too cheaply.
However, the skew is slowly moving towards neutral. This change indicates that the demand for downside hedging is weakening, and defensive positions are decreasing.
In other words, put options are relatively less expensive now. This kind of adjustment usually occurs when the market begins to open the door to the upside, but the macroeconomic situation is not yet fully clear and sentiment remains cautious.
The current skew indicates that the market is shifting from panic protection to a more balanced options structure, while also preparing for a possible tactical rebound.
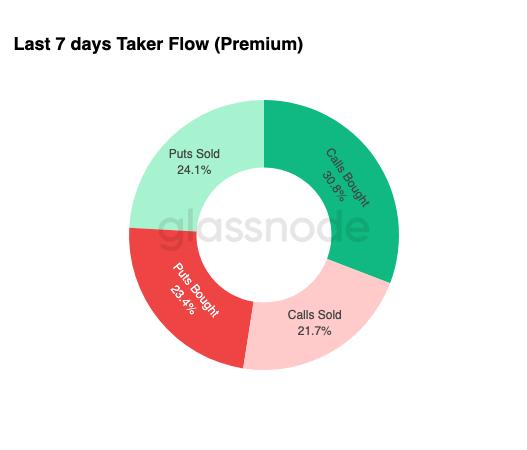
Options flows begin to warm up
The shift in sentiment is also evident in options trading. Recently, trades with positive Delta accounted for 54.9%, with 30.8% of those being buy call options – people are starting to use call options to bet on price increases again, given the limited downside risk.
At the same time, we saw a large number of downside protection positions being liquidated. As soon as traders liquidated their positions, market makers had to buy back the hedges, and this buying also provided support for the price.
These are typical characteristics of the transition period—everyone starts to plan for a rebound, but still keeps a defensive hand, so overall it is cautious yet positive.
Whether this is a structural shift or just short-term speculation remains to be seen.
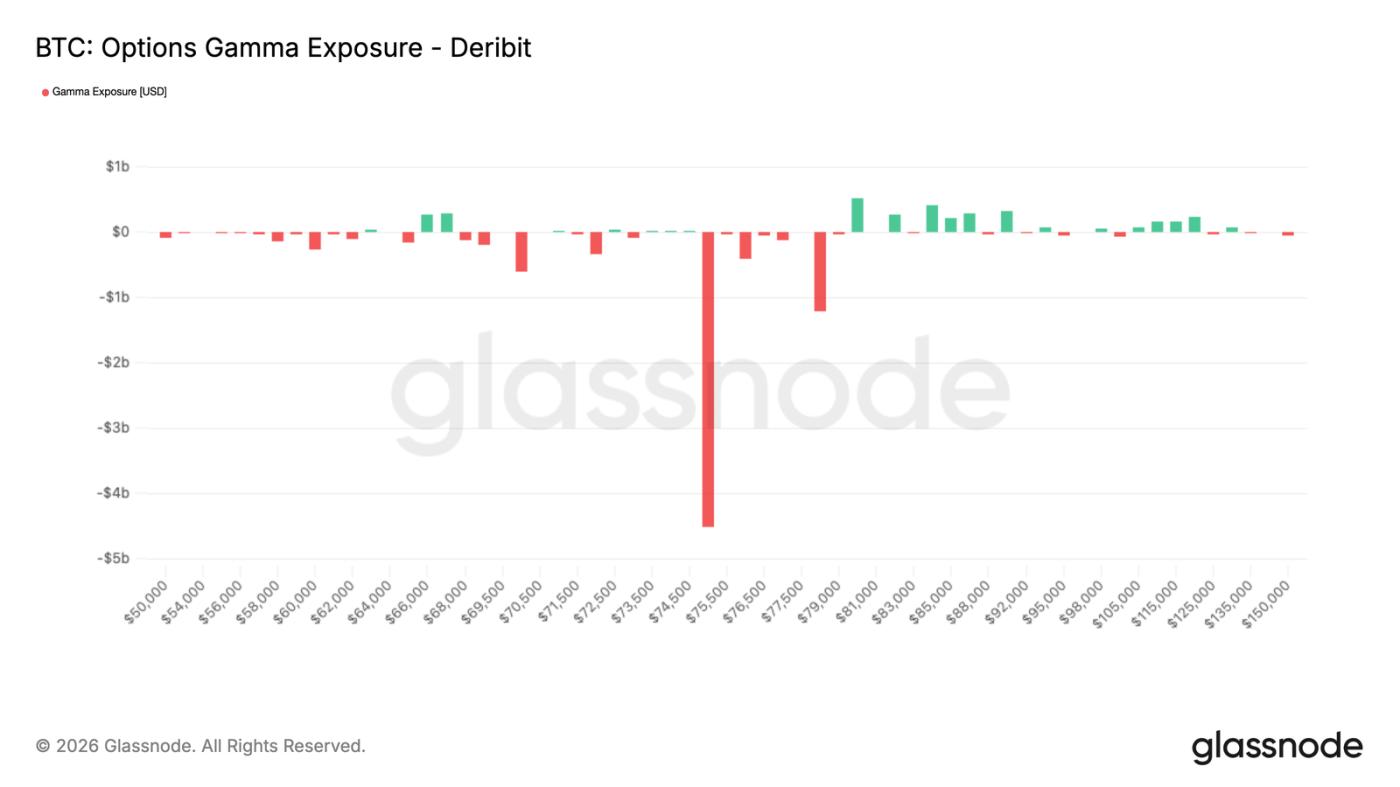
Negative Gamma values are clustered around $75,000.
Finally, keep an eye on the most important indicator: market makers' Gamma exposure. With trading currently thin, market makers' hedging activities could easily drive prices towards a key strike price.
The only meaningful level right now is $75,000 – there's roughly $4.5 billion of negative Gamma piled up there. Bitcoin is currently consolidating below this level, and even a slight upward move could trigger market makers to buy and hedge, pushing the price above $78,000.
The 75,000 mark is crucial before the March options expire—because 3.9 billion of that 4.5 billion expires this month. Once the quarter-end expiration date has passed, market makers' hedging positions will be closed out, and the upward movement may not be as smooth. The market may enter a consolidation or correction phase, returning to the main theme of the macro narrative.
in conclusion
Bitcoin's recent rebound is approaching $75,000, and the support behind it is becoming increasingly solid—ETF funds are flowing back in, the cumulative trading volume Delta is warming up, and both institutional and retail investors are re-entering the market. The market has switched from the previous "distribution mode" to an "accumulation mode," providing a more stable platform for prices.
On the other hand, the derivatives market remains defensive. Negative funding rates indicate a crowded short position – which could potentially fuel further upward movement through short covering. The options market is also stabilizing, with decreasing volatility and a slight positive skew, suggesting improving sentiment, but not yet reaching a level of speculative frenzy. Overall, there is still room for upward movement in the short term, but for a sustained trend to emerge, it depends on whether subsequent funds can continue to flow in, and whether leverage and conviction can keep pace.


