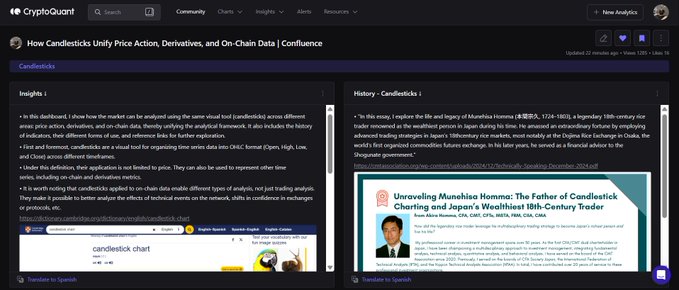
• How Candlesticks Unify Price Action, Derivatives, and On-Chain Data | Confluence ↓ • "In this dashboard, I show how the market can be analyzed using the same visual tool (candlesticks) across different areas: price action, derivatives, and on-chain data, thereby unifying the analytical framework. It also includes the history of indicators, their different forms of use, and reference links for further exploration." • @cryptoquant_com.
From Twitter
Disclaimer: The content above is only the author's opinion which does not represent any position of Followin, and is not intended as, and shall not be understood or construed as, investment advice from Followin.
Like
Add to Favorites
Comments
Share
Relevant content