The VIRTUAL price increased slightly, but Derivative indicators such as negative Funding Rate and weak Open Interest suggest that market sentiment remains bearish, even though the support zone of $0.66–$0.68 is being well defended.
Over the past 24 hours, volume has surged, but the level of bets placed by speculators hasn't kept pace. Combining data on Funding Rate, Open Interest, and Spot CVD helps assess whether the current recovery is sustainable or merely a technical rebound.
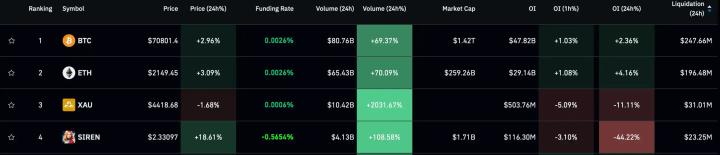
- Virtual increased by 3% and daily volume increased by 83%, but Open Interest only increased by 1.75% and Funding Rate remained mostly negative.
- Spot CVD is moving sideways, reinforcing the view that spot buying pressure is not yet truly dominant, and sentiment still leans towards a decline.
- The $0.66–$0.68 range held firm, opening up a scenario for prices to move upwards to $0.875–$0.955, and further to $0.95–$1.04 if the upward momentum continues.
Volume increased sharply, but speculative sentiment remained weak.
VIRTUAL increased by 3% in 24 hours, volume increased by 83%, but Open Interest only increased by 1.75%, indicating that Derivative funds have not yet strongly "bet" on the uptrend.
A rapid increase in volume usually reflects higher levels of interest, but it doesn't necessarily mean sustained growth is expected. When Open Interest (OI) only increases slightly, it implies that no significant new positions are being opened, or that the market is primarily rotating short-term positions.
In the crypto landscape, the synchronized pattern of "rising price + strong increase in open interest" often indicates confidence in the trend. Conversely, "rising price + weak increase in open interest" could be a pullback due to closing short positions, or short-term buying lacking commitment.
Negative funding rates and sideways-moving spot CVD indicate a downward trend.
Funding rates were mostly negative last week, and spot CVD remained flat, combined with a weak increase in open interest, suggesting that the sentiment for the virtual market remains bearish.
Coinalyze data shows that the Funding Rate has been largely negative in recent weeks. A negative Funding Rate typically implies that the sellers (Short) have a relative advantage in the perpetual market, or that participants are willing to pay a fee to hold a short position.
Meanwhile, the sideways movement of the spot CVD indicates that the accumulated buy/sell spread in the spot market is not creating a clear trend. When spot buying pressure does not increase while Derivative remain skewed towards selling, the risk of a downward reversal may continue to exist.
The 1-day trend remains bearish despite an underlying recovery.
On the 1-day timeframe, the swing structure remains bearish, but the intrinsic structure leans bullish as the price held the support zone at $0.68 after being rejected at $0.82.
On the 1-day chart, the overall trend remains bearish in a swing structure. Fibonacci retracement levels drawn based on this structure show that the price was rejected around $0.82, corresponding to the 50% retracement zone.
However, the fact that the local support zone of $0.68 was defended suggests that defensive buying pressure still exists and creates conditions for the next upward move. The two signals of "long-term decline but short-term recovery" often lead to a scenario where the price bounces off resistance zones before the market decides on the next trend.
The article also notes that Bitcoin's return above $70,000 could support overall market sentiment, giving buyers an opportunity to control the rebound in the next one to two weeks.
VIRTUAL has completed its pullback from $0.82 to $0.64.
VIRTUAL has retreated from $0.82 to $0.64 (maximum 22%), which is XEM a "healthy" correction for buyers in the short term, although the long-term structure remains bearish.
The drop from $0.82 to $0.64 confirms that the downside risk has materialized. However, in many short-term rallies, a deep pullback can "clean up" leverage and create a foundation for a price rebound.
From a long-term perspective, the structure remains bearish, therefore a more cautious strategy is to wait for the price to move closer to $1 before expecting a clear selling reaction, rather than assuming the long-term uptrend has resumed.
The 4-hour timeframe confirms the upward reaction at $0.665.
On the 4-hour timeframe, the $0.665 level (78.6% retracement level of the $0.62–$0.82 range) triggered a bullish reaction, reinforcing the scenario of a continued price recovery.
The $0.665 level is identified as the 78.6% retracement level of the previous momentum ($0.62 to $0.82). A price bounce at a deep Fibonacci level is often XEM as a signal that buyers are still willing to defend the rebound structure, as long as the support is not decisively broken.
With the $0.66–$0.68 level holding firm, the market has the technical basis to expect a continued upward trend, especially if liquidation and spot buying begin to improve compared to the current sideways movement.
The next upside target is at $0.875–$0.955, and further at $0.95–$1.04.
Based on the Fibonacci extension levels of the 4-hour swing structure, VIRTUAL could head towards $0.875–$0.955, and in the coming weeks could extend to $0.95–$1.04 if the rebound momentum is maintained.
The scenario suggests that the price is likely to move towards $0.875–$0.955, corresponding to the 23.6% and 61.8% extensions on this timeframe. These are typically profit-taking/supply testing zones where the price may stall or correct.
The summary at the end of the article also suggests a target range of $0.95–$1.04 in the coming weeks if buying strength continues to be confirmed. However, the negative Funding Rate and low Open Interest emphasize that the uptrend may still be a recovery move, and further monitoring of Open Interest and Spot CVD is needed to increase credibility.
Frequently Asked Questions
Why is the VIRTUAL price rising but the market signal is still XEM bearish?
Because the Funding Rate was mostly negative last week, Spot CVD remained flat, and Open Interest only increased by 1.75%. This combination suggests that Derivative do not yet strongly support an uptrend, and spot buying has not created clear accumulation pressure.
Which price level is currently the key support for VIRTUAL?
The $0.66–$0.68 region is XEM key support. Specifically, $0.665 is the 78.6% Fibonacci level of the $0.62–$0.82 rally, and a bullish reaction has occurred there.
What is VIRTUAL's immediate growth target?
The nearest upside target is stated as $0.875–$0.955 based on Fibonacci extension levels of the 4-hour swing structure. In a more bullish scenario, the price could head towards $0.95–$1.04 in the next few weeks.