Solana ($SOL) continues to trade under pressure near the $80 level as analysts present sharply divided outlooks. The asset has declined over the past week, reflecting sustained selling pressure and weak recovery attempts.
Bearish Structure Points to Possible $60 Retest
According to Wealthmanager, Solana remains in a clear macro downtrend since its 2025 peak. The price structure continues to print lower highs and lower lows, confirming sustained bearish control. Recent breakdowns pushed $SOL toward the $80–$85 range, where buyers failed to show strong conviction.
Besides, resistance between $100 and $120 continues to cap upside attempts. Sellers have repeatedly stepped in within this zone, preventing any meaningful recovery. Hence, Wealthmanager maintains a short bias, expecting a move toward the $60 level within two weeks.
Additionally, weak bounce patterns suggest that buyers lack momentum at current levels. If selling pressure persists, $SOL could revisit the $60–$65 demand zone, which previously supported the 2024 rally.
Sentiment Shift Signals Accumulation Zone
In contrast, Crypto Patel presents a longer-term accumulation perspective despite the ongoing correction. He notes that $SOL has dropped nearly 77% from its all-time high, placing it near the 0.618 Fibonacci retracement zone. This range, between $75 and $45, aligns with historical demand and prior consolidation.
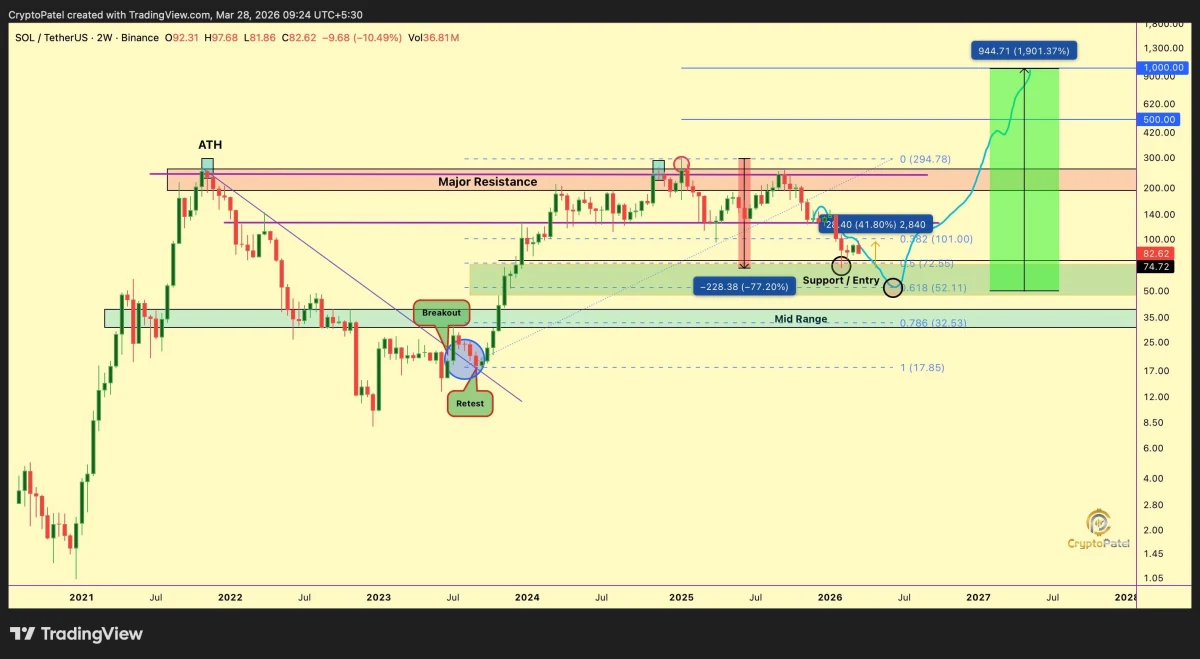
Source: X
Additionally, this phase reflects a typical market cycle, where strong bullish sentiment fades after major peaks. Fear and uncertainty now dominate near support levels, which often attracts long-term investors. Crypto Patel identifies this region as a strategic accumulation zone, with upside targets extending toward $500 and $1,000 over time.
He also emphasizes that structural strength remains intact unless price breaks below $45 decisively. Hence, current levels may represent opportunity rather than weakness for patient investors.
Long-Term Outlook Suggests Expansion Potential
Moonbag supports the bullish narrative by highlighting a developing consolidation structure. The chart shows tightening price action between support near $80 and descending resistance around $200. This compression often precedes a significant volatility expansion.
Significantly, a breakout above resistance could trigger a strong upward move toward $400–$600. If broader market conditions improve, extended targets near $1,000 become achievable over multiple cycles.
At press time, Solana trades at $82.70, with a market cap exceeding $47 billion. Consequently, the asset stands at a critical point, where short-term weakness meets long-term speculation.