

Crypto Expert: Ethereum Bulls Launch Counterattack on April 1st! Professional Trading Systems Demonstrate Their Power Once Again! Latest Market Analysis and Strategy Reference
Ethereum is currently priced at 2095. Yesterday's price action perfectly validated our prediction: a northbound move from 2025 to 2100 yielded profits, while a southbound move from 2075 resulted in a planned stop-loss at 2100. This dual-track trading strategy allowed us to profit within our expected range and minimize losses. The market is never short of opportunities; what it lacks are traders who strictly adhere to discipline. Looking at the charts, the price has been fluctuating between 2000 and 2100, with intense back-and-forth between bulls and bears. Only by planning ahead and strictly adhering to stop-loss and take-profit orders can one navigate the volatile market steadily, avoiding being swayed by emotions or exploited by market fluctuations.
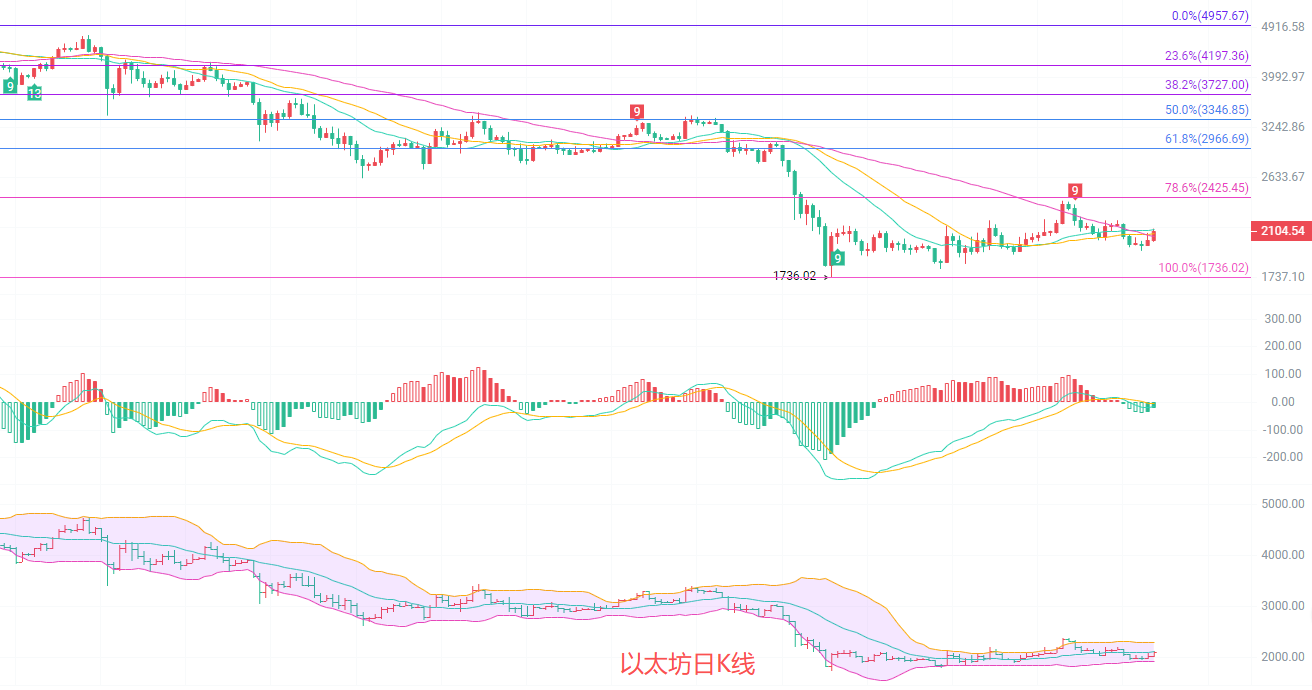
The daily candlestick chart currently shows a 3.53% increase from 2097, holding above the 20-day moving average (MA20) at 2117. Support is found at the 30-day moving average (MA30) at 2083 and the 60-day moving average (MA60) at 2059. The MACD indicator shows a continuously shortening green bar, indicating a significant weakening of southward momentum and a clear northward counterattack signal. The 0.786 Fibonacci retracement level at 2425 represents strong medium-term resistance, while 1736 is a historical strong support level. Overall, the market is in a consolidation and bottoming phase, undergoing a rebound and correction. The trend is gradually shifting from south to north, with the southward trend ending and entering a consolidation-driven northward rebound cycle. A challenge to the 2200 level is expected in the future.
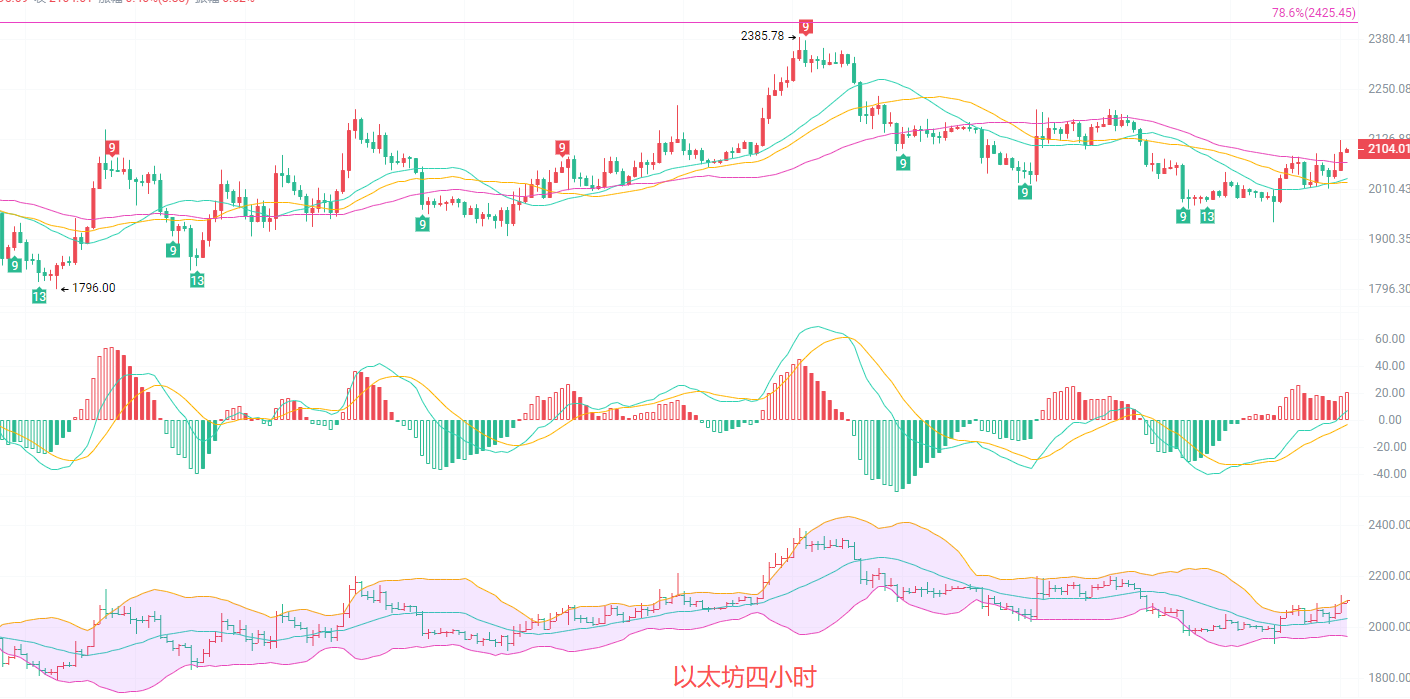
The 4-hour price broke through the MA20 line at 2031 and the MA30 line at 2025, and stabilized above the MA60 line at 2072. Short-term moving averages are arranged in a northward trend. The MACD indicator has formed a golden golden cross and the red bars are continuing to expand, indicating strong upward momentum. The Bollinger Band middle line at 2031 provides strong support, and the upper band at 2094 has been broken, with the price entering trading above the upper band. The short-term trend is clearly bullish, and the rebound is expected to continue. Our southbound strategy should be changed to a northbound strategy.
Short-term reference: (Real-world data has been updated; please contact the author for details)
The price is expected to move south from 2180 to 2200, with a stop loss at 2210 and a target of 2120. A quick in-and-out strategy is recommended, avoiding prolonged positions.
The downside target is 2085-2075, with a stop loss at 2050. The target is 2150-2200, and a break above that level could lead to 2250.
For specific operations, please refer to real-time market data. For more information and details, please contact the author. There may be a delay in article publication; this advice is for reference only, and you assume all risk.

