

Crypto Expert: Bitcoin's daily downtrend momentum remains strong on April 3rd, a short-term reversal is unlikely; risk control is paramount! Latest Market Analysis
Bitcoin is currently priced at 66,600. Its recent price action has been a love-hate relationship for many crypto investors. After rebounding from a low of 59,800, it reached a high of 68,639, prompting many to buy in. However, yesterday's sharp drop of 1.92% left those who bought in trapped. The price is now fluctuating around 66,777, with both bulls and bears consolidating their positions. Coupled with the uncertainty surrounding tonight's non-farm payroll data, the market's focus is on whether it will continue to fall or rebound and reverse. For retail investors, instead of trying to guess the top or bottom, understanding key technical signals, identifying entry and stop-loss levels, and managing risk are the most important things to do right now.
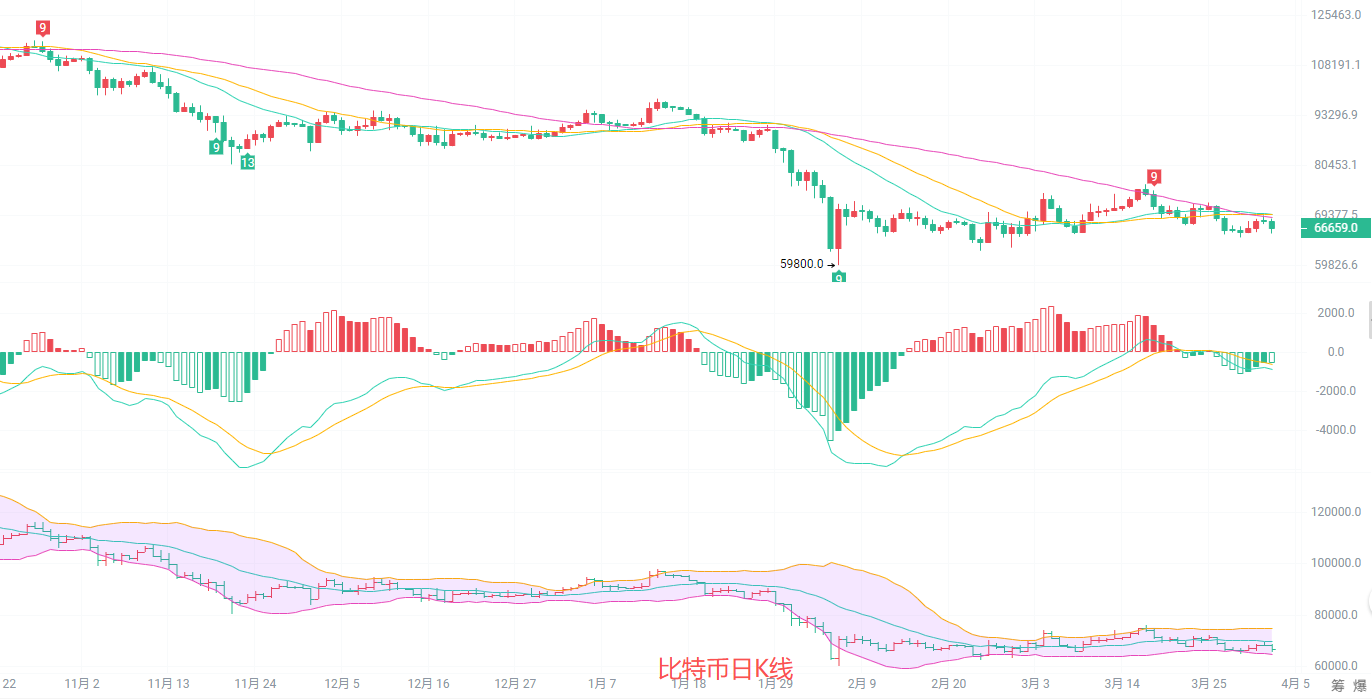
The daily candlestick chart shows a typical southward trend in the moving average system, with the 20-day, 30-day, and 60-day moving averages all trending downwards. The price is trading below these moving averages, and any rebound is facing strong resistance. The MACD indicator shows a death cross between the DIF and DEA lines below the zero line, with the green histogram continuing to expand, indicating unabated downward momentum. The Bollinger Bands are widening downwards, with the price trading near the lower band. Strong support lies at the historical low of 59800, while resistance is at the Fibonacci retracement level of 74011. Overall, the daily chart indicates a weak downward trend, making a significant rebound unlikely in the short term.
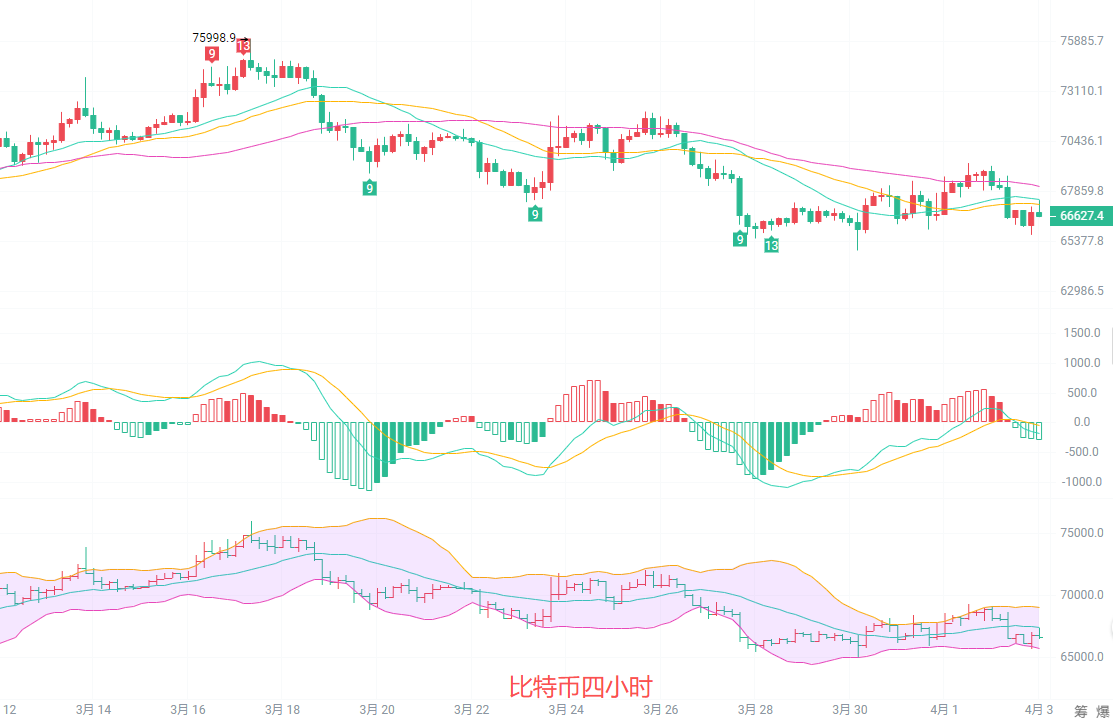
After rebounding to 68639 in the previous 4-hour timeframe, the price has faced resistance and fallen back. The 20-day and 30-day moving averages have turned downwards, forming short-term resistance. The MACD indicator's red bars are shortening rapidly, and the DIF and DEA are about to death cross, indicating a rapid weakening of northbound momentum and southbound movement beginning to dominate the market. The Bollinger Band's middle band has turned downwards, and after breaking below it, the price is testing the lower band support at 65821. The upper resistance levels are the upper Bollinger Band at 69083 and the previous high of 75998. The 4-hour chart indicates a pullback phase after the rebound, with a short-term bearish bias. Support is seen at the 66000 psychological level; a break below this level would likely lead to a test of the 65000-64000 range.
Short-term trading strategy: Follow the long-term trend, use small stop-loss orders, and trade quickly.
A northbound move is recommended from 65800 to 66000, with a stop-loss at 65500 and a target of 67500 to 68000, with a further target of 68600 if the price breaks through.
The upside target is 67500-68000, with a stop loss at 68500. The target is 66000-65800, and a break above that level could lead to 65000.
In the crypto, those who are prescient reap the rewards, those who are slow to react get the scraps, and those who are oblivious end up losing everything.
For specific operations, please refer to real-time market data. For more information and details, please contact the author. There may be a delay in article publication; this advice is for reference only, and you assume all risk.

