

Crypto Academician: Ethereum Daily Chart Dominates Bears on April 3, 2026; Bull-Bear Battle on Non-Farm Payroll Night; Comprehensive Analysis of Key Support and Resistance Levels! Latest Market Analysis for Reference
Ethereum is currently priced at 2045. The recent market movement can be described as a rollercoaster. After rebounding from a low of 1736, many thought a bull market was on the horizon, only to be wiped out by a large bearish candle on April 2nd. Now, the price is stuck around 2046, unable to break through or fall significantly, with bulls and bears locked in a fierce battle, leaving those holding positions uncertain. Whether long or short, the key is to identify crucial support and resistance levels and avoid blindly following the crowd. Next, we will use technical analysis to break down the current market situation and provide a clear trading strategy.
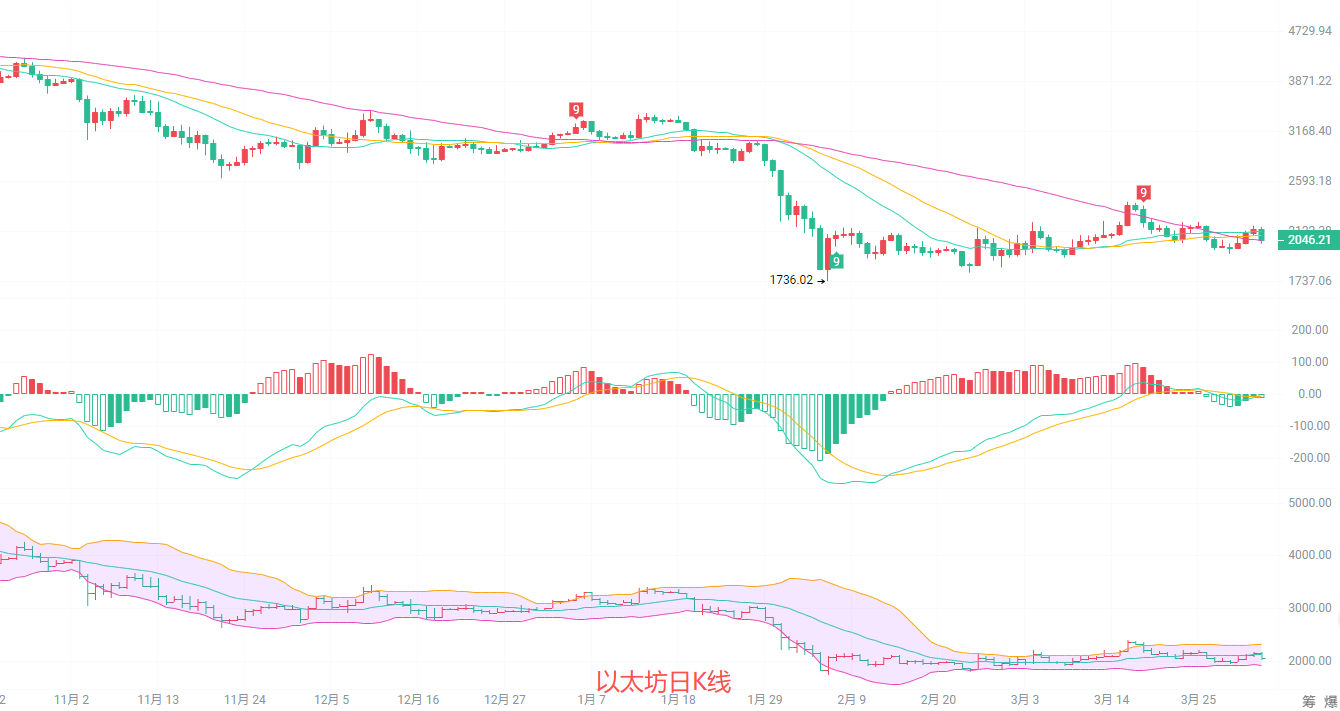
The daily candlestick chart shows a high of 2158 and a low of 2015, indicating concentrated downward pressure. The moving average system is also trending southward, with the 20-day, 30-day, and 60-day moving averages all exerting downward pressure on the price. The MACD indicator shows a death cross between the DIF and DEA lines below the zero line, with the green histogram continuing to expand, indicating ongoing downward momentum. The Bollinger Bands are widening downwards, with the price trading near the lower band. Strong support lies at the previous low of 1736, while resistance is at the Fibonacci retracement level of 2425. In the short term, the daily chart remains in a weak, downward-trending pattern, with limited upside potential.
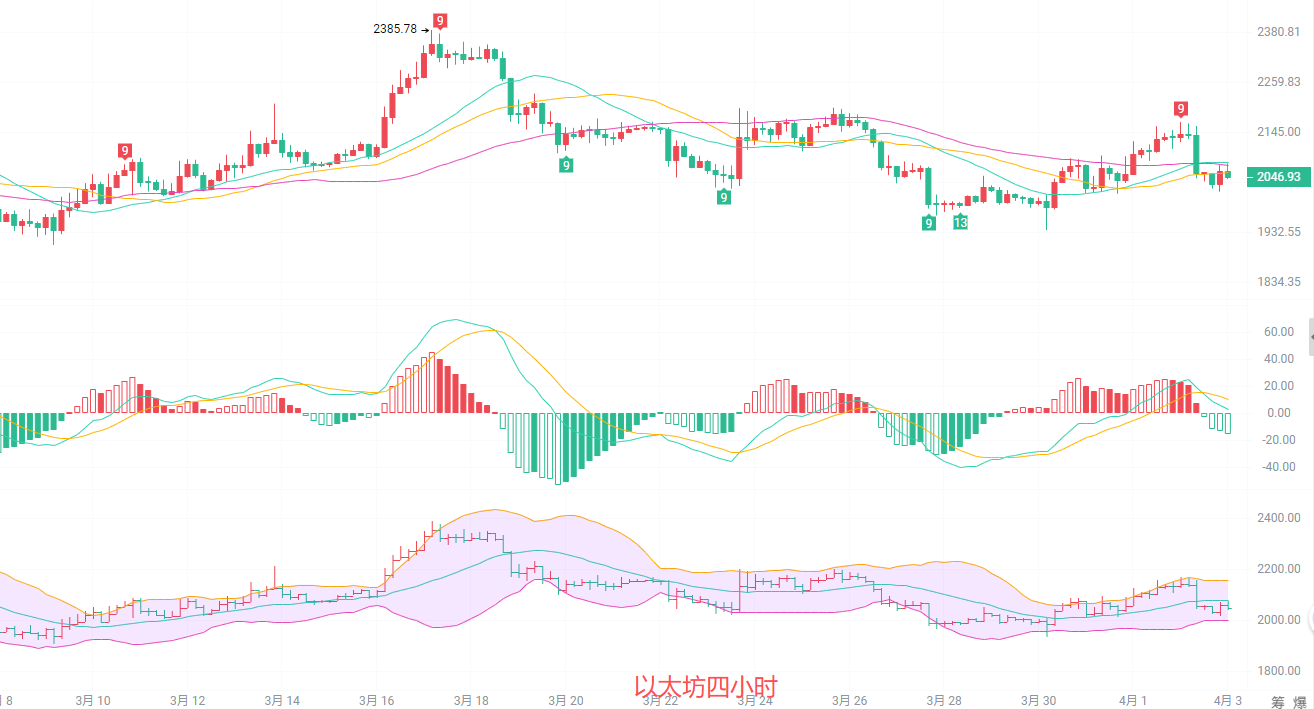
After rebounding to 2126 in the previous 4-hour timeframe, the price encountered resistance and fell back. The 20-day and 30-day moving averages (MA20 and MA30) flattened and then turned downwards, forming short-term resistance. The MACD indicator's red bars are shortening rapidly, and the DIF and DEA are about to death cross downwards, indicating weakening northward momentum and increasing southward pressure. The Bollinger Band's middle band is turning downwards, and the price broke below it, testing the lower band support, which is currently around 1999. The key resistance levels above are the upper Bollinger Band at 2157 and the previous high of 2385, indicating a short-term bearish bias.
Short-term reference: (Real-world data has been updated; please contact the author for details)
The upside target is 2060-2080, with a stop loss at 2100 and a target of 2010-1980.
The downside target is 2000-2010, with a stop loss at 1980 and a target of 2080-2120.
For specific operations, please refer to real-time market data. For more information and details, please contact the author. There may be a delay in article publication; this advice is for reference only, and you assume all risk.

