Crypto Expert: Bitcoin's Breakthrough of 73,800 on April 14th Will Open Upside Potential! Key Support and Resistance Levels Must Be Understood! Latest Market Analysis and Reference Suggestions
Bitcoin is currently priced at $72,250, rebounding from a low of $59,800 and breaking above the $72,000 mark. Technically, it has completely broken out of its downtrend channel, and an upward trend has officially begun! The current consolidation is merely a build-up of momentum before the rise. Understand the structure, seize this continuation pattern, and don't get left behind by the market! Now is the time to test your patience. Many people try to predict the direction, resulting in either chasing highs or buy the dips, ultimately losing money on both sides. It's better to wait for the market to unfold before acting. If it breaks through, follow the trend; if it breaks down, short. Even if you earn less, it's better than repeatedly getting stopped out during consolidation. The essence of trading is to trade within certain price ranges, not to gamble on uncertain directions.
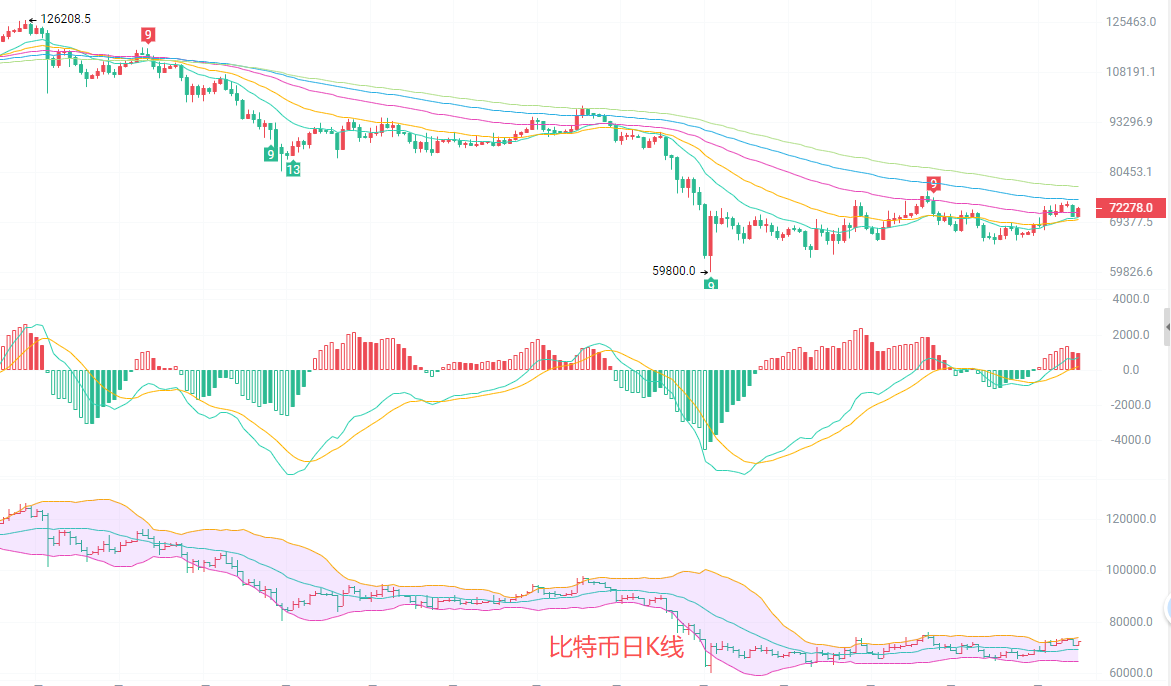
The daily candlestick chart shows consolidation around the 72,000 level, indicating intensified competition between bulls and bears. The moving average system remains in an upward trend, with the 15-day and 30-day EMAs providing support. The price is trading near the middle Bollinger Band. The MACD indicator shows a slight narrowing of the red bars, suggesting a slowdown in upward momentum and a short-term need for consolidation. The upper Bollinger Band at 73,892 represents strong resistance, while the lower band at 64,520 provides support. The 71,000 level is the key support level; holding above this level would allow the upward trend to continue.
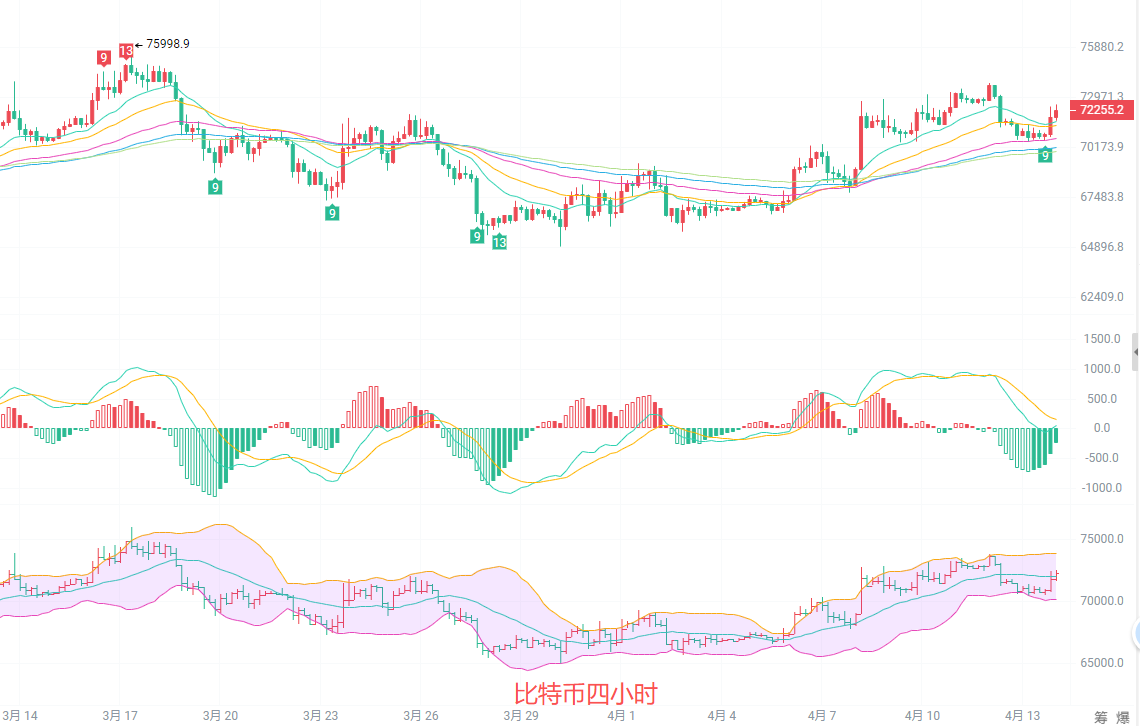
The 4-hour candlestick chart shows the price action suppressed by the upper Bollinger Band, indicating a slowdown in short-term upward momentum. While the upward alignment of moving averages remains intact, the price's divergence from these averages has widened, suggesting a potential pullback for correction. The MACD indicator's red bars are narrowing, signaling a short-term correction. Support lies around 71500, while resistance is at 72800. The price is repeatedly testing this range, creating a window for a directional move. However, an upward channel has emerged, and as long as key support holds, further gains are possible.
Short-term trading strategy: Follow the long-term trend, use small stop-loss orders, and trade quickly.
A northbound move is recommended from 71000 to 71500, with a stop-loss at 70500 and a target of 72500 to 72500.
The upside target is 72500-7300, with a stop loss at 73300 and a target of 72000-71500.
In the crypto, those who are prescient reap the rewards, those who are slow to react get the scraps, and those who are oblivious are left holding the bag.
For specific operations, please refer to real-time market data. For more information and details, please contact the author. There may be a delay in article publication; this advice is for reference only, and you assume all risk.