Nvidia (NVDA) stock price closed April 14 at $196.51, up 3.80%, marking a 4-day winning streak. The move broke NVDA out of a falling channel that had held since late October.
Yet a proprietary indicator reveals something the price chart alone does not show. The broader semiconductor sector has been gaining strength far faster than Nvidia itself. NVDA appears to have been carried to its breakout rather than leading it.
Channel Break With Volume as Three Green Bars Confirm the Push
Nvidia stock price has traded inside a falling channel on the daily chart since October 29, 2025. Every rally attempt over the past six months stalled at the channel’s upper trendline before reversing.
That changed on April 14. NVDA broke above the channel’s upper boundary with four consecutive green volume bars. Volume hit 161.31 million shares on the breakout candle. The rising sequence confirms that buying pressure built progressively rather than arriving in a single spike.
Want more insights like this? Sign up for Editor Harsh Notariya’s Daily Newsletter here.
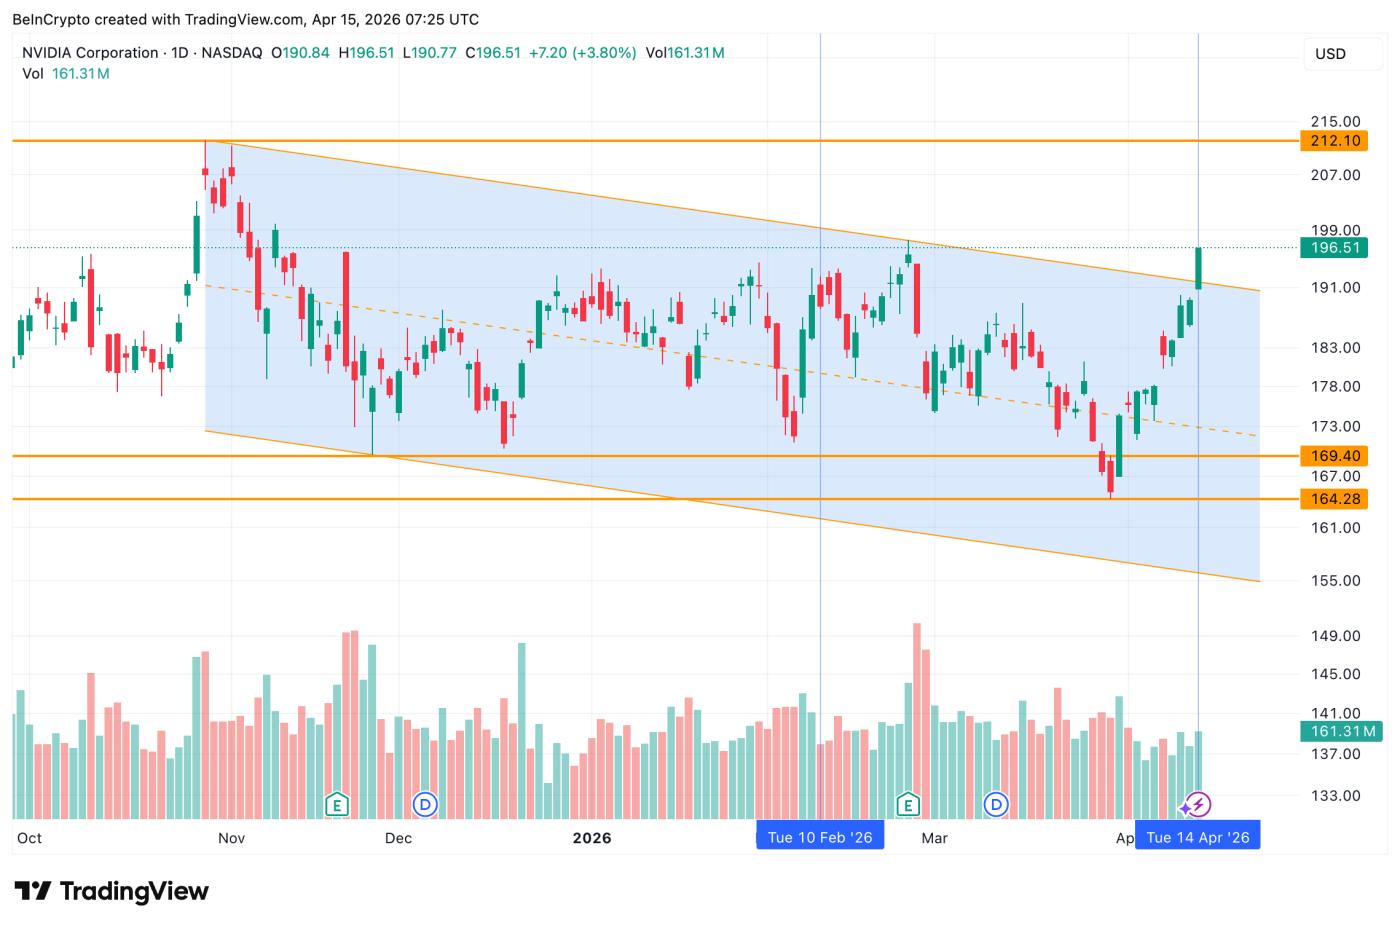 NVDA Channel Breakout Volume: TradingView
The breakout is structurally significant. It marks the first clean exit from the bearish channel since NVDA peaked in late October. However, a channel breakout only tells half the story. The question is whether Nvidia earned this move on its own merits or was pushed through by a broader force. And can the breakout even hold?
The Chip Sector Outran Nvidia and Dragged It to a Breakout
BeInCrypto’s NVDA versus SOXX Relative Performance indicator is a proprietary tool. It normalizes both to a common baseline and tracks which is gaining faster in real time.
The VanEck Semiconductor ETF (SOXX), a fund that tracks the broader chip sector, currently reads on the normalized scale. NVDA sits lower. The gap has been widening since February 10. Between February 10 and April 14 another thing happened. SOXX trended higher while NVDA trended lower on the relative scale. Yet NVDA stock still broke out.
A similar gap-widening happened in late November as SOXX led NVDA. This eventually helped the Nvidia share price avoid a drop under $169.47.
The implication is clear. The sector was fueled by TSMC’s record earnings, CoreWeave’s AI deals, and soft PPI data.
That created enough upward force to lift even its underperformer through resistance.
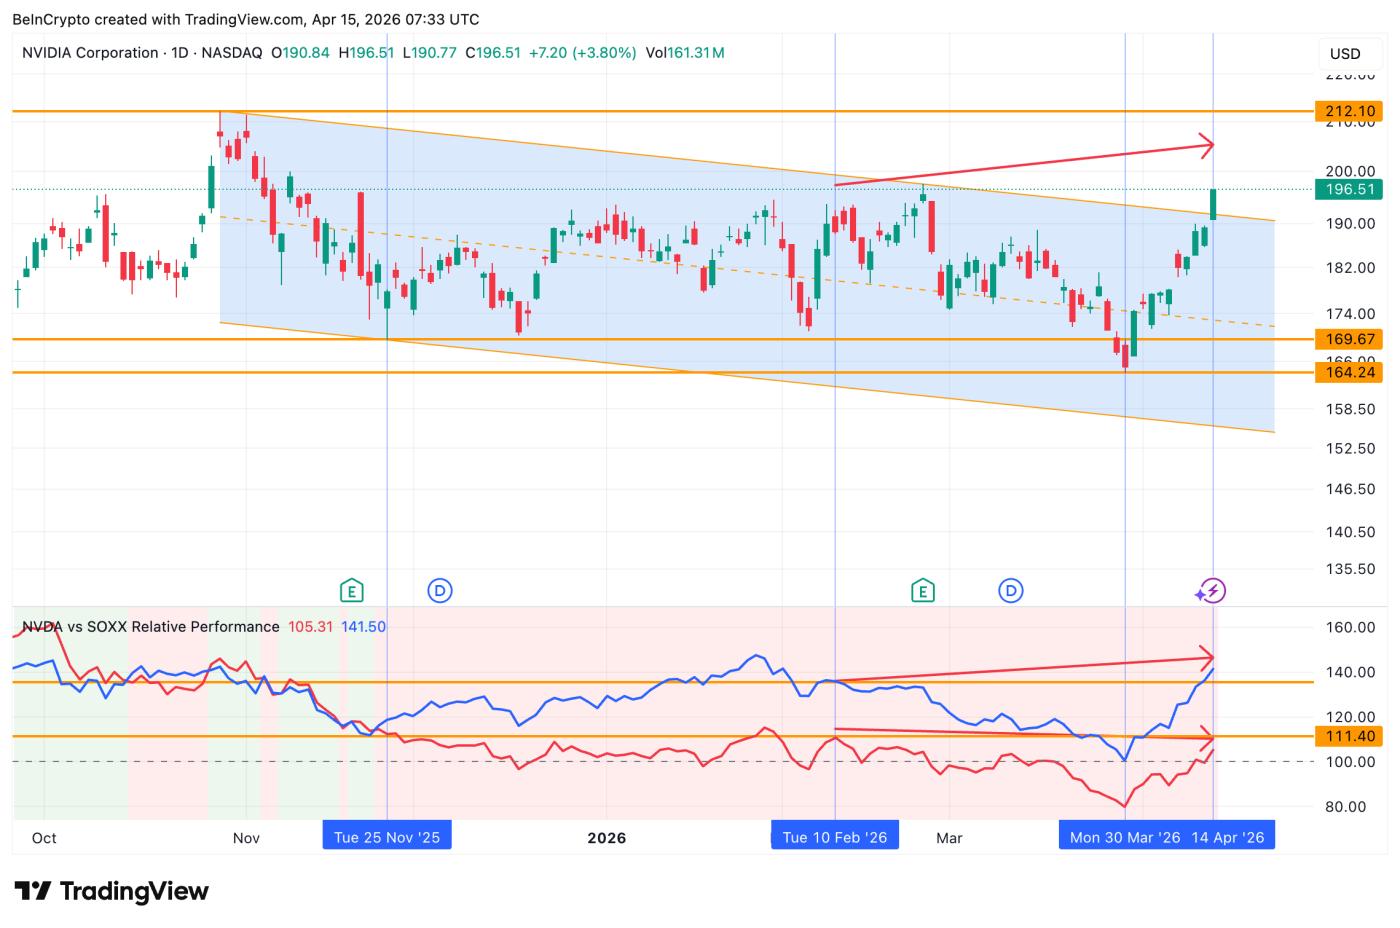 NVDA vs SOXX Relative Performance: TradingView
The year-to-date numbers confirm the gap. SOXX is up roughly 28% in 2026. NVDA has gained just 4%. The chip sector outpaced Nvidia by 24 percentage points.
Meanwhile, options positioning on NVDA reflects cautious optimism rather than outright conviction. On February 10, the put-call volume ratio, which compares bearish bets against bullish bets, stood at 0.69.
As of April 14, it has dropped to 0.41. Call activity is rising, but the open interest ratio held steady near 0.85. That means traders are adding new bullish bets without unwinding existing hedges. The positioning mirrors the SOXX story. Money is flowing in, but with protection still in place.
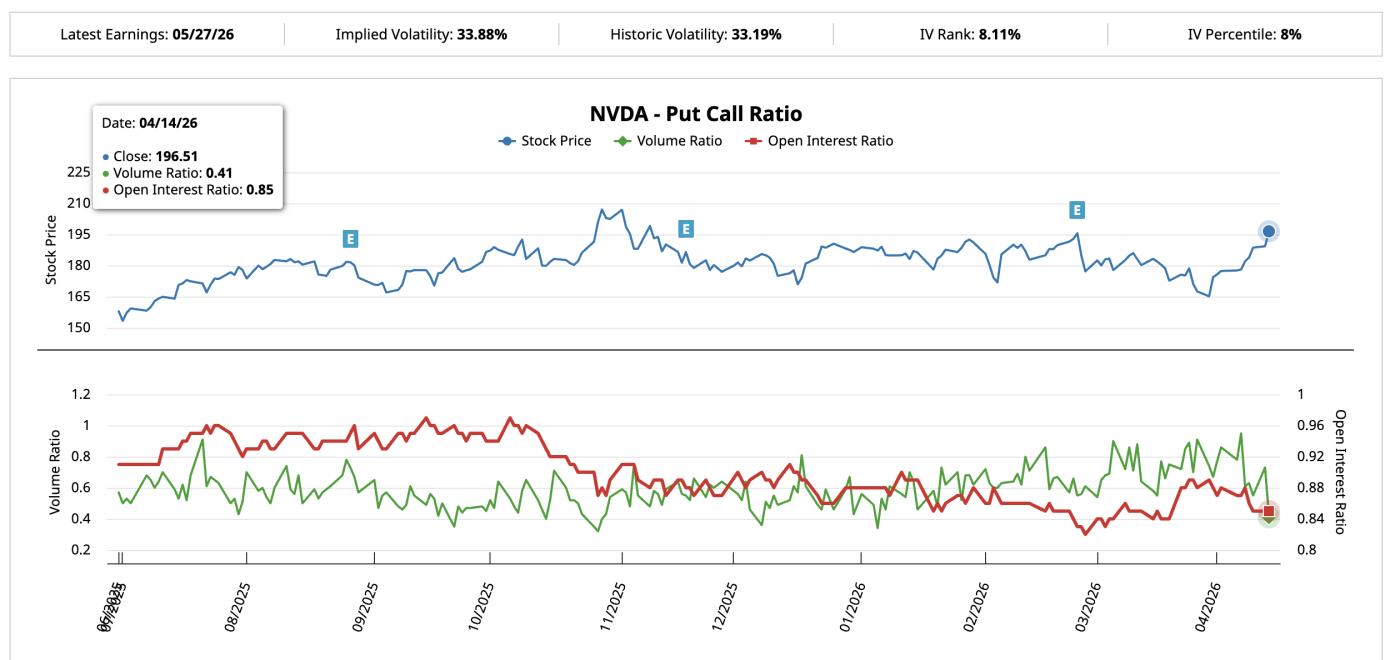 Put Call Ratio: Barchart
The sector tailwind and cautious options positioning both support the breakout. However, without NVDA closing the performance gap with SOXX, the rally risks being a passenger’s ride.
Nvidia Stock Price Levels That Decide If the Breakout Holds
The daily price chart maps where Nvidia stock price must deliver. NVDA has broken above $193.88, the 0.618 Fibonacci level. That zone was rejected earlier in 2026 and has been reclaimed until now.
Holding above $193.88 keeps the breakout intact. The next target sits at $201.92, the 0.786 Fibonacci, just 2.84% above the current price. That level also aligns with the psychological $200 mark. Beyond $200, $212.17 comes into focus, matching the October high.
Yet with NVDA lagging the sector by 24 points, conviction at higher prices depends on closing that gap. If SOXX stalls and NVDA keeps climbing, leadership shifts. If SOXX keeps rising while NVDA flatlines, however, the sector-driven lift fades.
Nvidia stock price support sits at $188.23, the 0.5 Fibonacci level. A loss of that exposes $182.58. However, the channel breakout only fully weakens below $164.28.
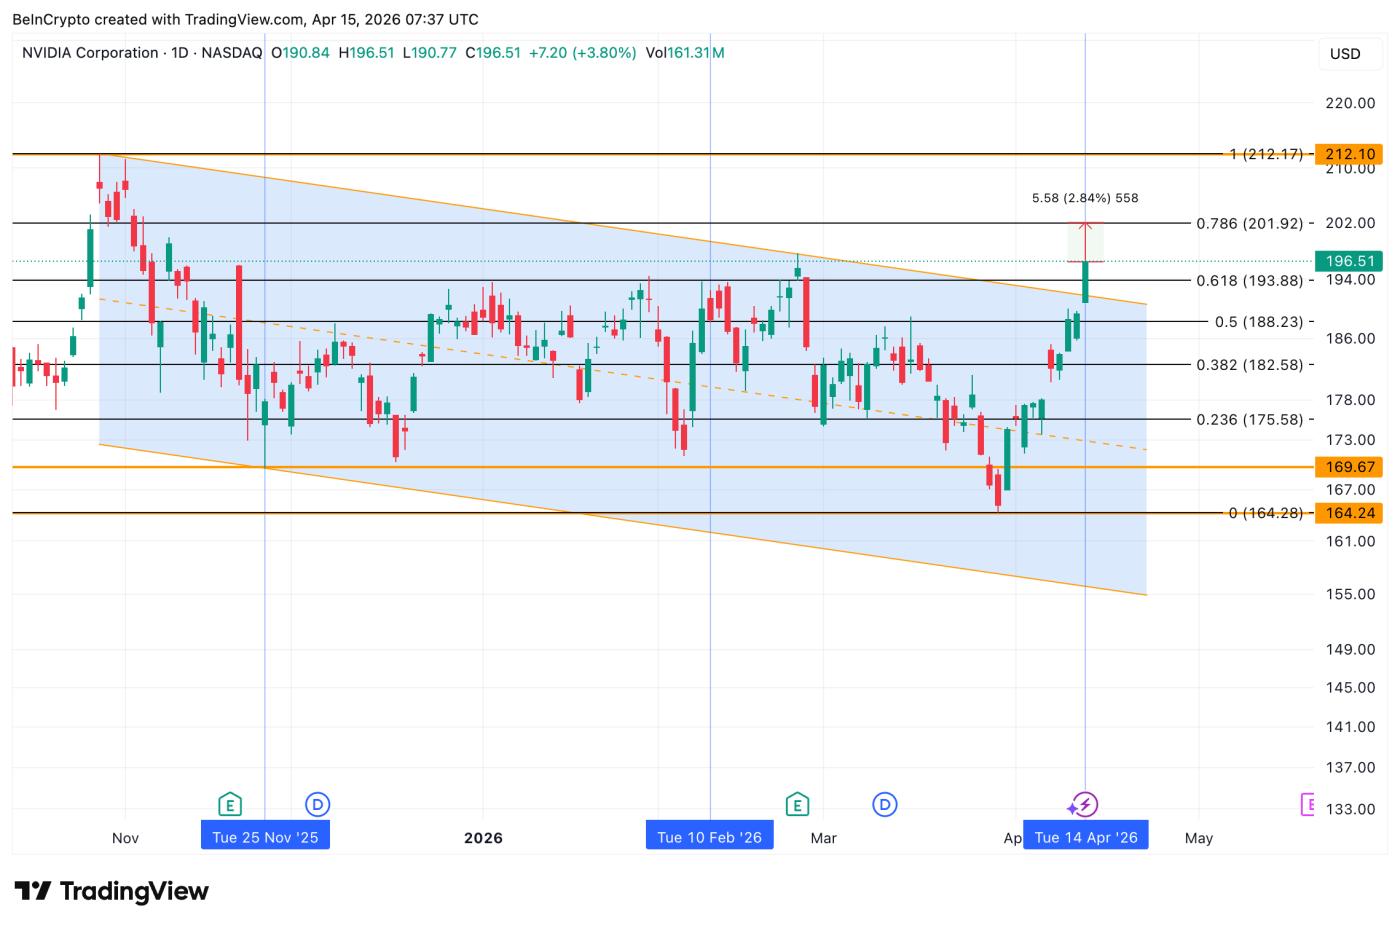 NVDA Price Analysis: TradingView
A daily close above $201.92 confirms the breakout has legs. A drop below $193.88 sends NVDA back into the range the chip sector spent six months pushing it out of.