In the past few days, the ENJ Token has consecutively created three extremely strong bullish candles on the daily chart. Currently, Enjin has increased by over 300% in April 2025, becoming one of the most explosive altcoins on the market right now. But will this upward trend be sustainable?
Enjin Coin, launched in 2017 by Enjin Pte. Ltd., was one of the first blockchain projects to bridge the gap between gaming and blockchain technology, providing developers with a toolkit to create and manage in-game Non-Fungible Token assets on the Ethereum platform.
After surviving one of the most brutal bear markets — losing almost all of its value and hitting a Dip of around $0.00042 in October 2025 — ENJ is making a spectacular comeback.
ENJ Price Analysis: A Showdown in the Golden Pocket
On the daily chart, the Fibonacci indicator is drawn from the April 2025 peak at $0.11839 to the October 2025 Dip at $0.00042 — a drop that nearly wiped out years of gains.
From that deep Dip , ENJ has recovered strongly and is currently testing the 0.618 Fibonacci level at $0.07332. This is the "golden pocket"—the most crucial resistance level on the larger timeframe.
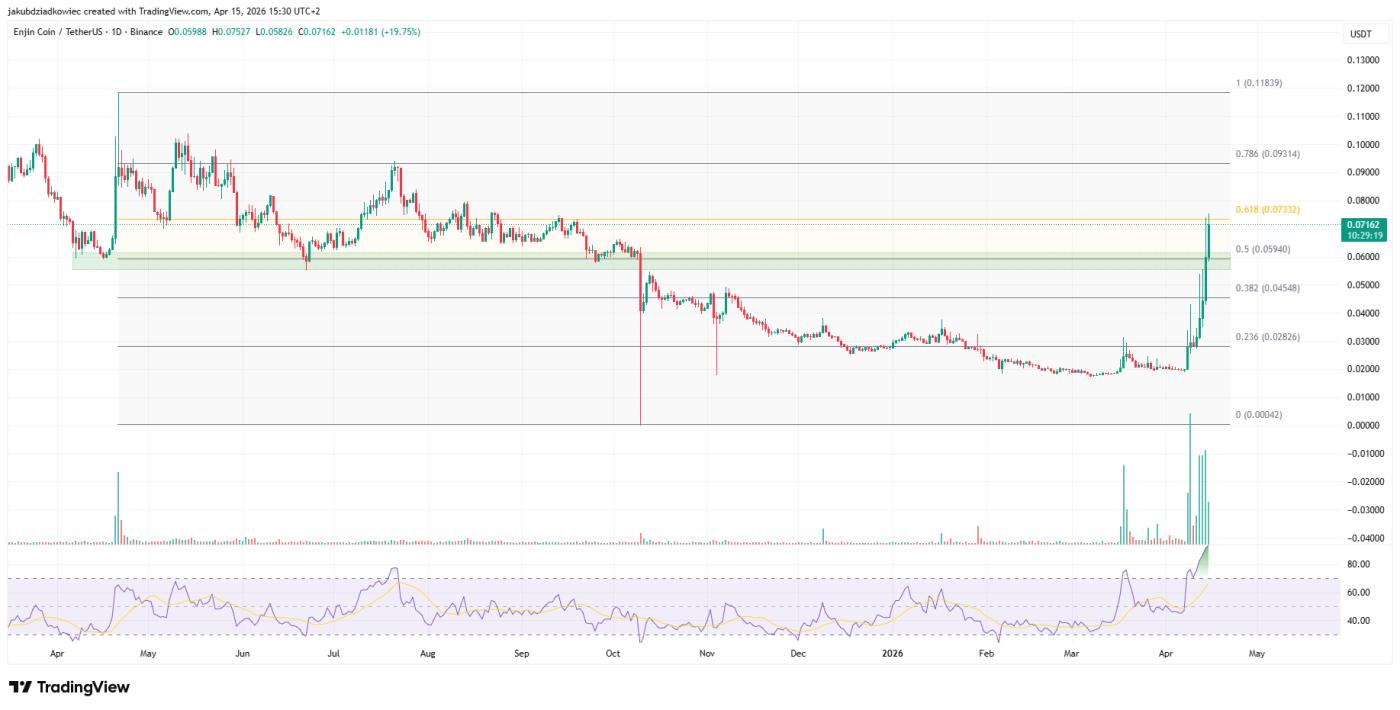 ENJ/ USDT daily chart / Source: Tradingview
This upward trend is truly impressive and is further confirmed by volume. Each bullish candlestick shows higher volume, reaching its highest level in over a year.
The RSI indicator also surged to 93.3 — one of the most overbought levels the Token has ever recorded.
Although an excessively high RSI often signals potential exhaustion, in the early stages of a true trend reversal, it actually indicates strong momentum building, rather than buyer exhaustion.
The crucial question now is whether ENJ can close each day above $0.07332, turning the golden pocket from resistance into new support.
The structure is strong, but warning signs have emerged.
Moving down to the 1-hour timeframe reveals a textbook bullish structure. Three consecutive new highs (blue circles) — around $0.043, $0.054, and $0.073 — have clearly formed. Each broken resistance zone quickly becomes new support (blue box).
This is a classic flip pattern, one of the surest signs of a sustained uptrend, rather than just a sudden surge followed by a sharp decline.
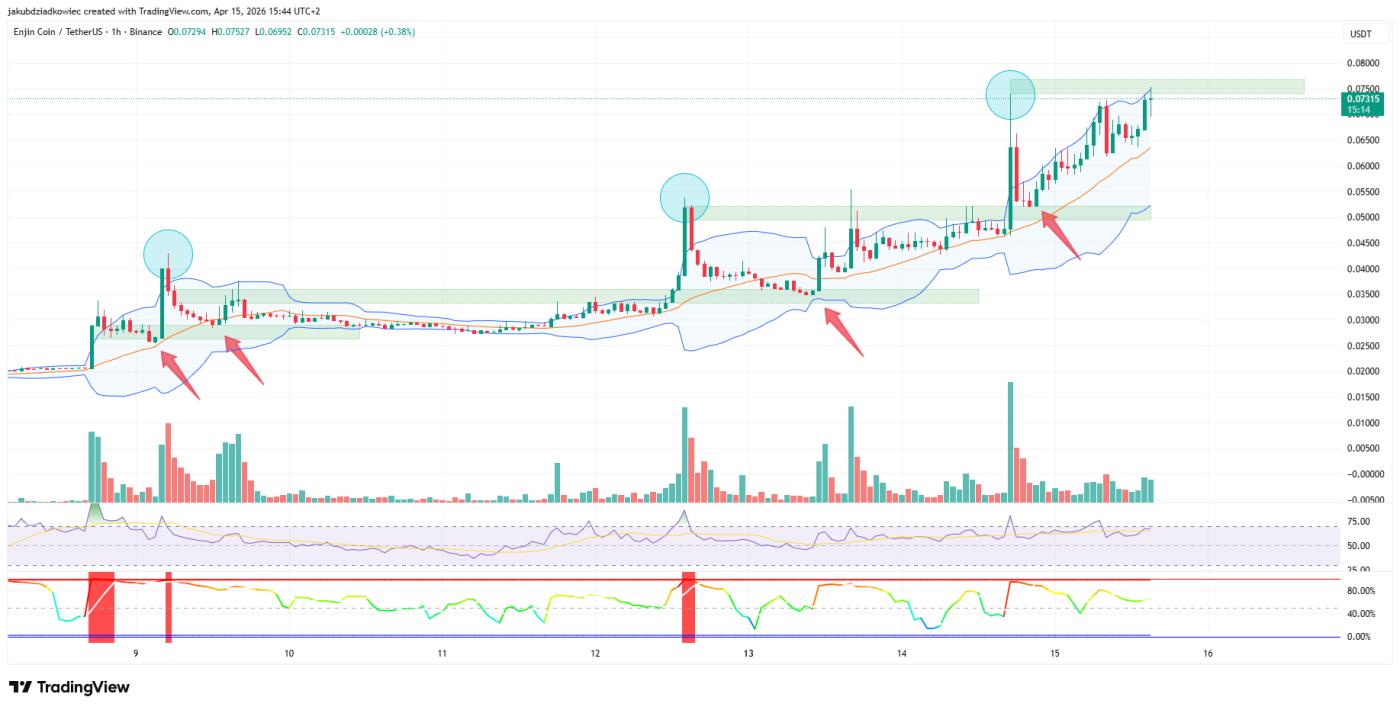 ENJ/ USDT 1-hour chart / Source: Tradingview
The Bollinger Bands (blue lines) are also telling an interesting story. After weeks of sideways movement within a narrow range, the bands suddenly widened sharply since April 14th, with the price closely following the upper band — a sign that the upward momentum is very strong.
However, there are two warning signs that investors should be aware of. The RSI on the 1-hour timeframe is starting to show a bearish divergence — the price is creating a new high, but the RSI is creating a slightly lower high.
In addition, the BBWP indicator is showing extreme volatility, implying that the current rally may be nearing its peak. However, these signals alone are not strong enough to conclude that immediate selling is advisable, but combined, retail investors should exercise more caution.
on-chain data: the upward trend is becoming increasingly solid.
The on-chain picture from Santiment is perhaps the most valuable point supporting this assessment. Although the price of ENJ has nearly doubled in the past few days, the amount of Token flowing into exchanges remains almost zero, reaching only 19,600 Token at the time of writing.
This is noteworthy. During the February 2026 correction, the amount of Token flowing into the exchange surged as retail investors panicked, hastily taking profits or cutting losses. Conversely, at the peak of this bull run, the inflow of money into the exchange was extremely quiet, indicating that current holder had no intention of selling.
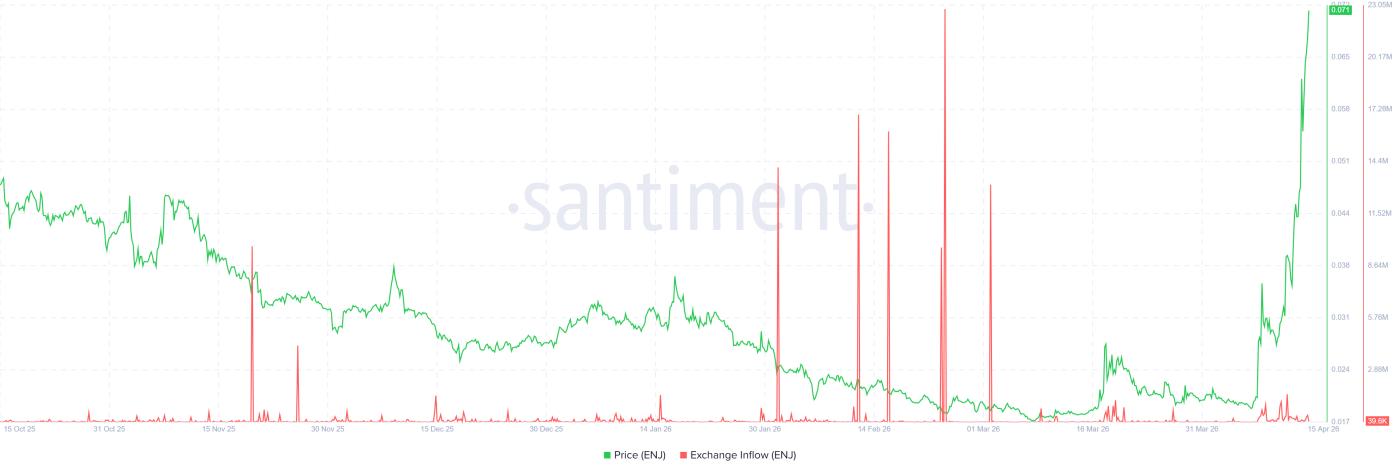 EnjinCoin flows into exchanges / Source: Santiment
The number of active addresses also shows a clear trend. After months of sluggish activity with only about 50–150 addresses per day, the number of active addresses on ENJ has exploded to 920 — the second highest level in the six-month data.
Notably, this wasn't due to a single day of "outage," but rather a trend spanning several days, confirming that a wave of new users is pouring into the Enjin ecosystem.
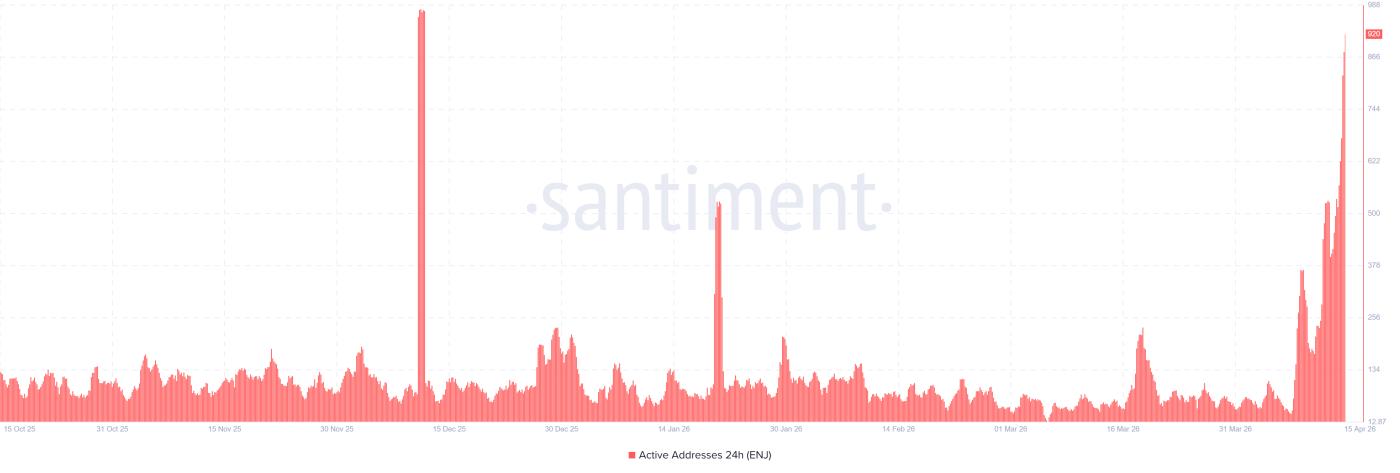 Number of active EnjinCoin addresses / Source: Santiment
EnjinCoin Price Prediction: Two Possible Scenarios
If EnjinCoin closes the day above the 0.618 Fibonacci level at $0.07332, it will be a confirmation breakout of the "golden pocket" and indicate a potential broader trend reversal. The next target would then be the 0.786 Fibonacci level at $0.09314, representing an increase of approximately 30% from the current price.
The increase in volume, the sharp rise in the number of active wallets, the near-zero Token inflow into the exchange, and the clear higher peak pattern on the 1H timeframe all support this scenario. However, if the closing price falls below $0.05940 – the 0.5 Fibonacci level – this scenario will no longer be valid.
Conversely, if EnjinCoin fails to hold above $0.07332 while the RSI is at a very high 93.3, a bearish divergence appears on the 1H timeframe, and the BBWP indicator is at an extreme level, a strong reversal is highly likely.
The first downside targets would be at $0.05940 (0.5 Fibonacci level), with increased selling pressure potentially pushing the price further down to $0.04548 (0.382 Fibonacci level). In this negative scenario, a neutralization signal would appear if EnjinCoin closes the day above $0.07500 and holds above that price level.