Oil stocks are currently trading more than $40 higher than JP Morgan's 2026 baseline valuation. This difference stems entirely from geopolitical risks related to tensions between the US and Iran.
Three stocks that announced their Q1 2026 earnings this week each have a different approach to this issue. One employs a diversified defensive strategy; another opts for high-growth speculative investing; and the last one is the most vulnerable if this growth narrows. May 2026 will be the time when these charts confirm the upcoming trend.
 Notable oil stocks in May 2026
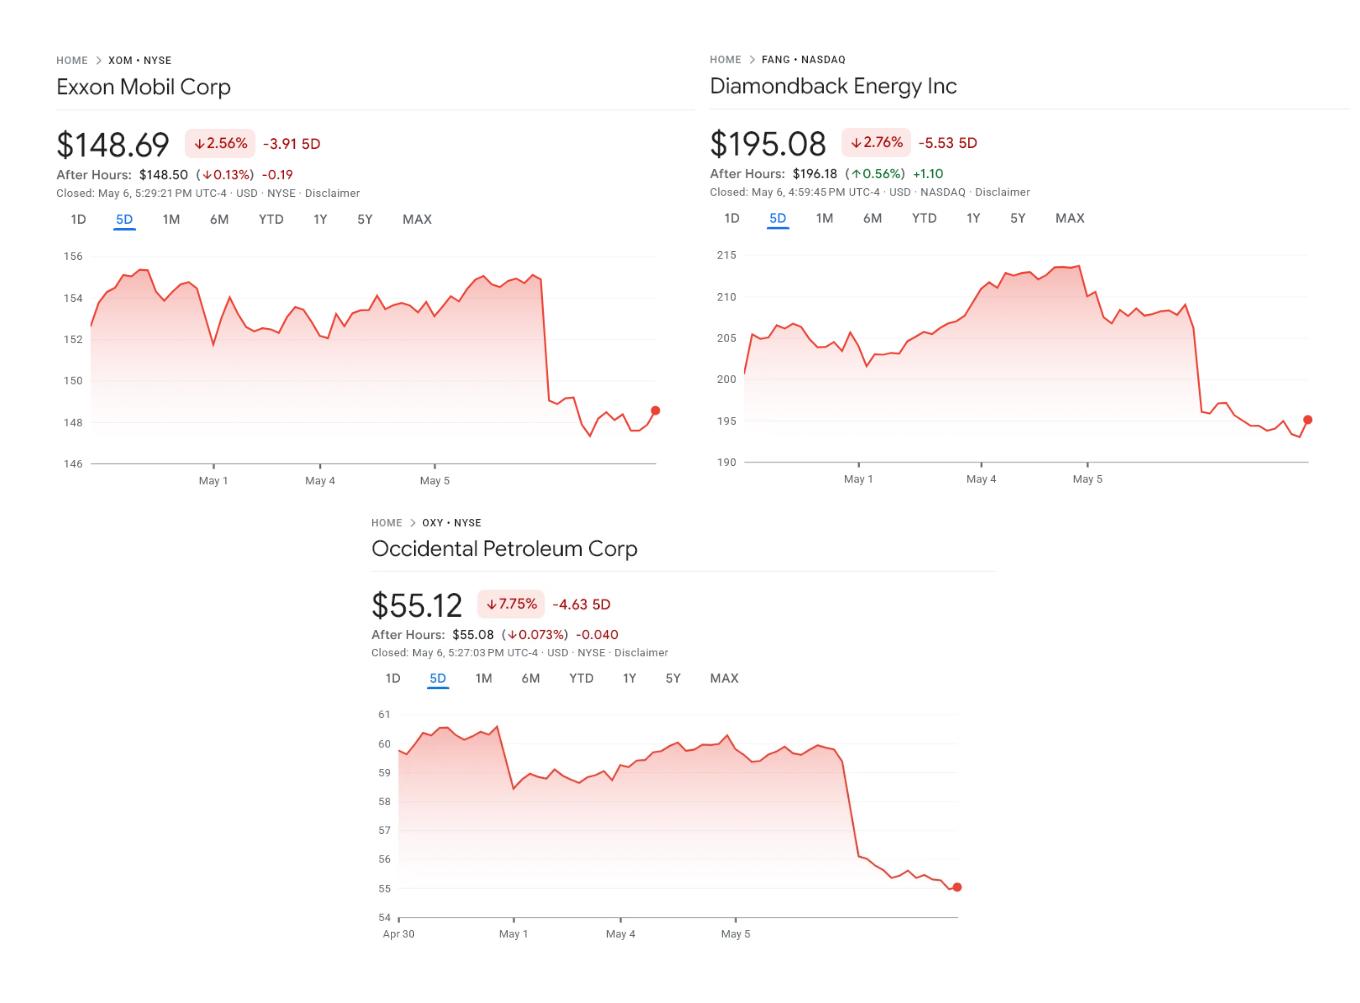
ExxonMobil (NYSE: XOM)
ExxonMobil is the most diversified oil stock on this list. The stock has fallen from a high of $176.48 to a low of $141.96 as US-Iran tensions eased, causing oil prices to lose some of their geopolitical "risk premium."
When tensions returned along with the Freedom Project, the stock recovered. Currently, XOM is trading at $154.88 within an ascending channel pattern that began on April 17th, bounded by two upward trend lines.
Want more analysis like this? Sign up for Editor Harsh Notariya's daily newsletter here .
However, the current pattern does not yet truly confirm an uptrend. This remains a continuing corrective pattern until XOM closes above the upper trendline. Price movements from April 17th to May 5th show a clear divergence in volume.
The stock has moved upwards within an uptrend channel, but volume has decreased during the same period. When the price rises but the volume decreases, it indicates that buyers are still hesitant and haven't really entered the market aggressively.
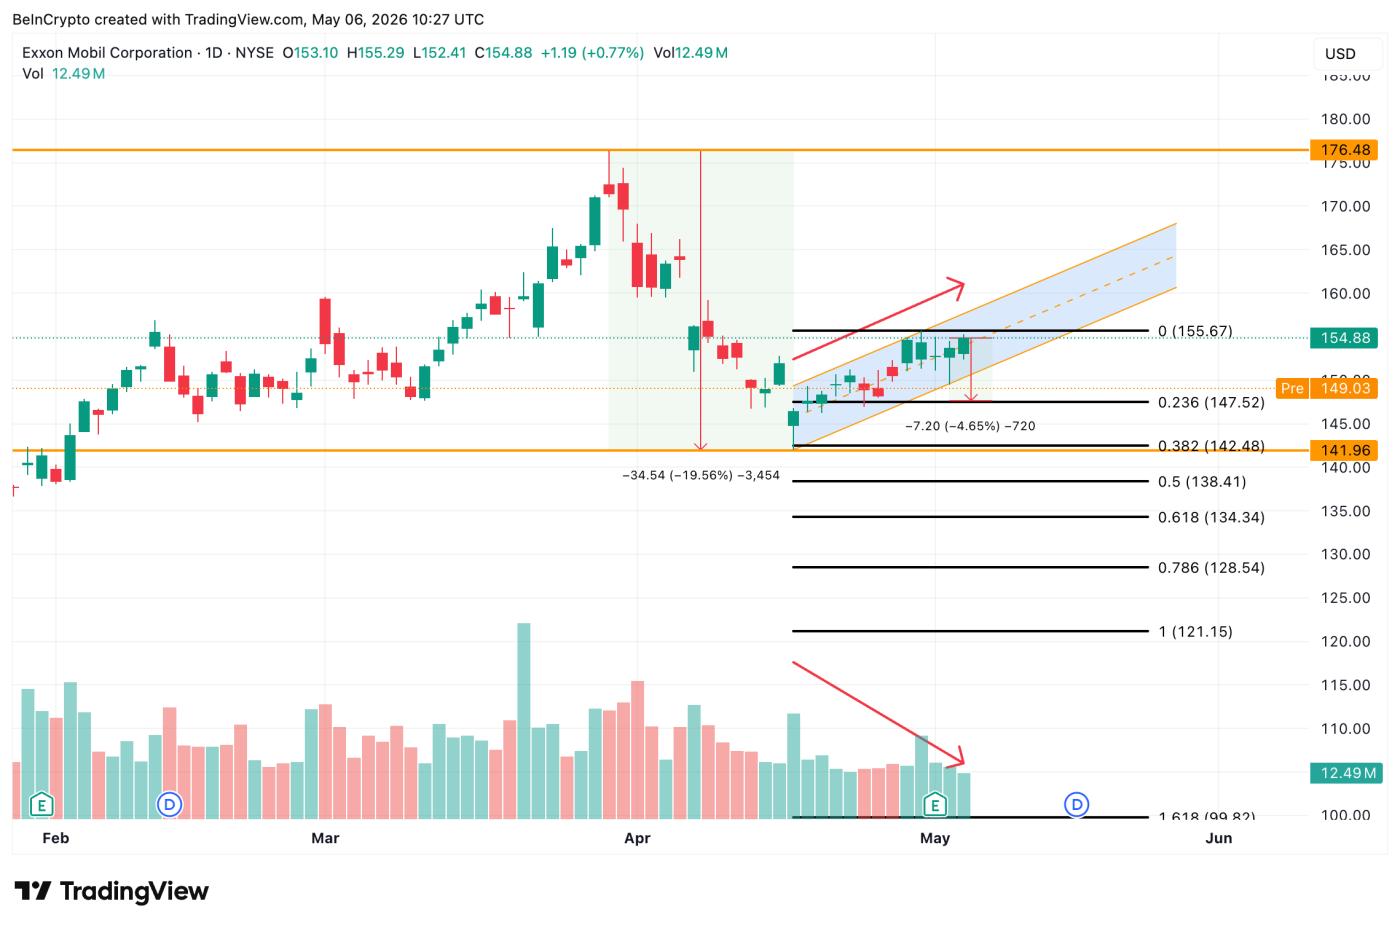 ExxonMobil stock price analysis: TradingView
The volume signals also align with the Q1 2026 fundamental results . While EPS exceeded forecasts by 15% and reached $1.16, ExxonMobil's free cash flow decreased from $5.6 billion in Q4 2025 to just $2.7 billion in Q1. This weakening cash conversion capacity mirrors the hesitation on the price chart.
The most important level to watch right now is $155.67. If the stock closes above the upper trendline, it could continue towards this area. Conversely, a break below $147.52 would confirm a pattern breakdown, with the next support levels at $142.48 (Fibonacci 0.382), $138.41 (Fibonacci 0.5), and $134.34 (Fibonacci 0.618) if the corrective trend extends.
In May 2026, XOM's recovery channel will depend on geopolitical pricing – a factor that fueled the recent correction – and the recovery wave from the Freedom Project.
Diamondback Energy (NASDAQ: FANG)
While XOM remains hesitant, FANG is an oil stock considered to have "strong growth - high beta". The chart shows two consecutive bullish flag patterns.
The first upward move lasted from January 7th to March 27th and confirmed a breakout on April 21st. A smaller upward move began on April 17th and is currently consolidating. If it breaks above the current flag trendline and surpasses the $214.58 mark, this pattern could potentially offer a 26% upside.
Financially, the deciding factor lies in this price level. FANG announced its Q1 2026 results with EPS exceeding forecasts by 13%, reaching $4.23, and raised its oil production target to over 520 MBO/day.
However, the full-year Capital expenditure plan was also revised upwards from $3.75 billion to $3.90 billion. The increased spending amid signs of weakening oil prices is the reason for the less-than-optimistic market reaction to the report. The stock fell 3.51% on May 6, 2026, to $206.18.
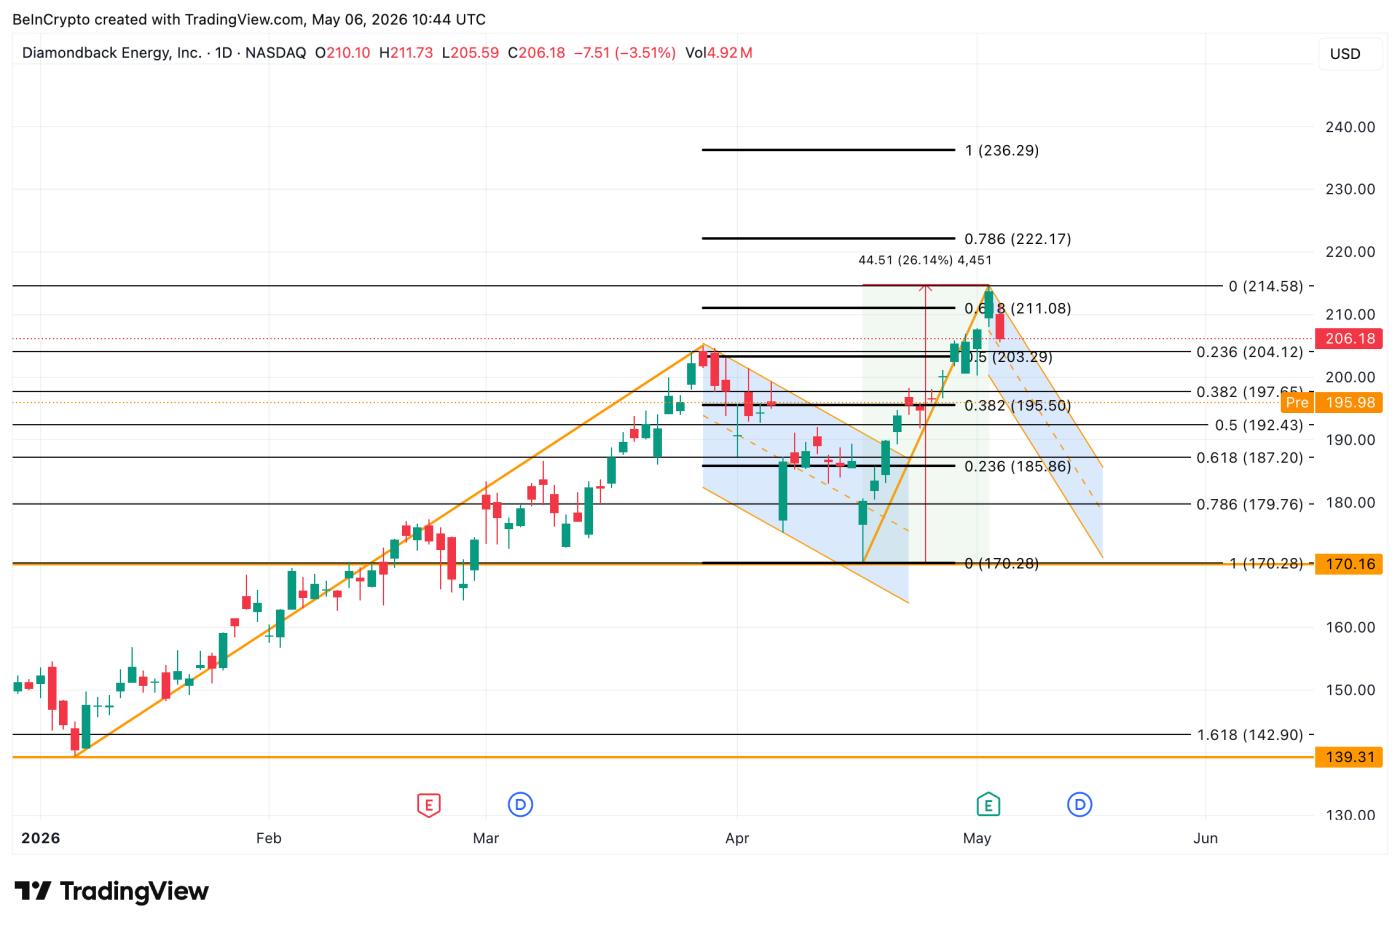 Diamondback Energy stock price analysis: TradingView
There are two technical scenarios on the chart, each corresponding to a different upward move, and both converge in the 211-214 USD range.
If the closing price of the day surpasses $214.58, the next targets will be $222.17 and $236.29. A break below the $203-204 support zone would signal significant weakness; a break below $192.43 would extend the correction, and a breach of $187.20 would negate the latest bullish pattern.
In May 2026, the FANG chart will show whether the larger spending plan for 2026 will "bear fruit" as oil prices fall. If it surpasses $214, it signals the expectation of success; if it falls below $187, it confirms market caution regarding the plan for heavy spending during a period of weak oil prices.
Occidental Petroleum (NYSE: OXY)
While XOM and FANG both have the potential to benefit from geopolitical risk premiums, OXY is the stock most negatively impacted if these premiums disappear. JP Morgan forecasts an average Brent crude oil price of around $60 per barrel by 2026 due to global oversupply.
A bearish scenario emerged in OXY's Q1 2026 report . Earnings per share (EPS) reached $1.06, higher than the forecast of $0.65, but free cash flow (FCF) was negative $112 million. This cash shortage occurred while the Medium oil price was $69.91 per barrel, with geopolitical factors still supporting prices. If oil prices fall to around $60, OXY will incur even greater losses.
A bearish Vai and shoulders Vai has appeared on the OXY chart since February 27th. The head formed at $67.48, the right Vai is forming around $60.79, and the neckline is near $51.20. If this pattern is broken, the price could fall further by 22.75% to $40.13.
The Project Freedom initiative, along with renewed tensions in Iran, has helped stabilize oil prices around the right Vai .
As commercial cargo ships pass through the Strait of Hormuz under US military escort, Project Freedom signals that US-Iran tensions persist and keeps oil prices high enough to support revenue for OXY. Currently, OXY is trading at $59.34.
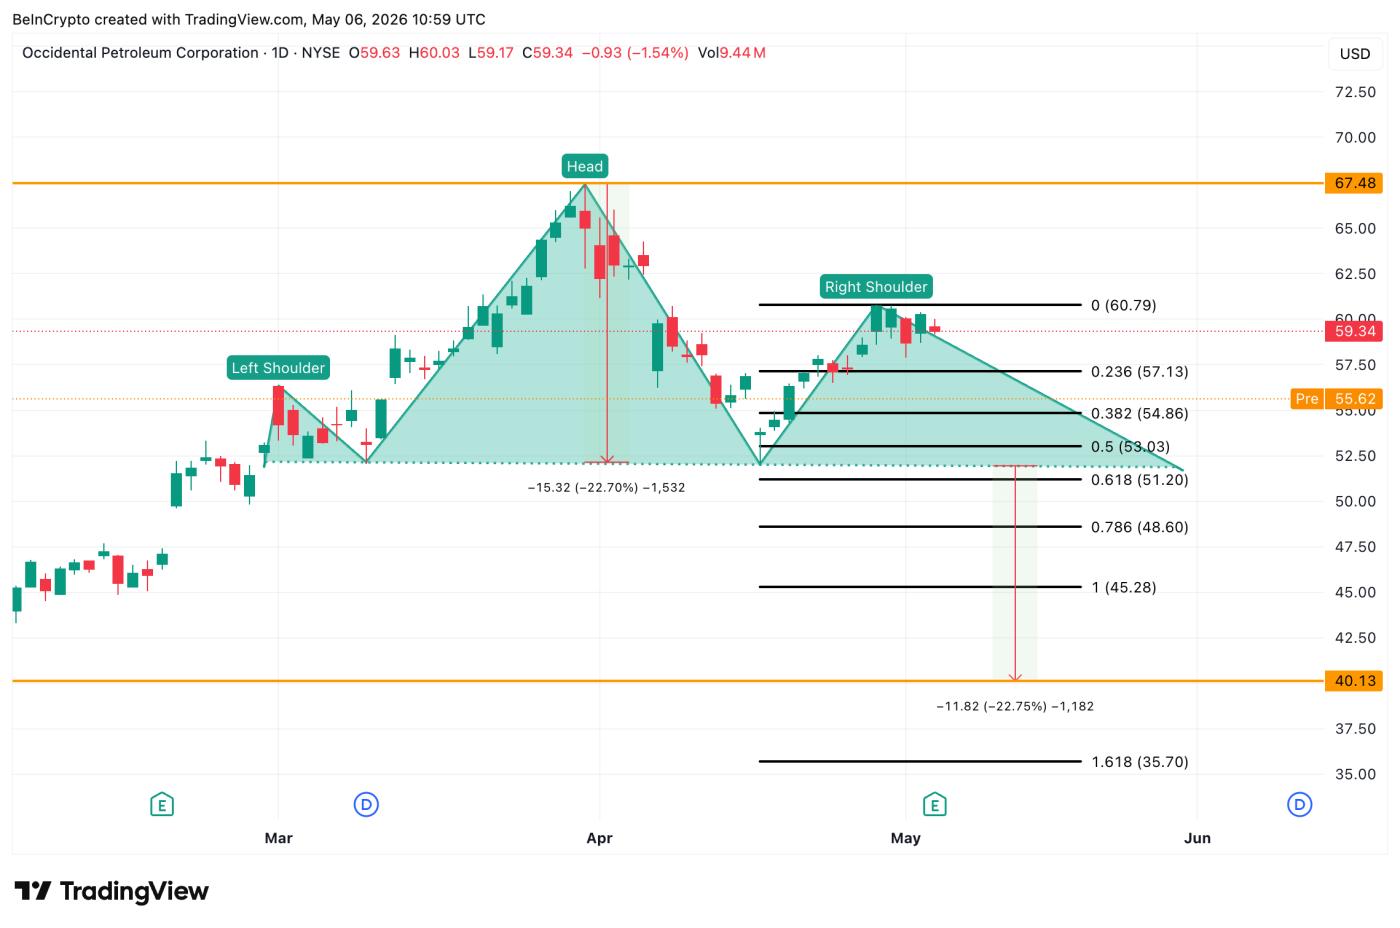 Stock price analysis of Occidental Petroleum: TradingView
If the closing price/day rises above $60.79, it could pave the way to conquering the $67.48 mark and indicate renewed pressure from the Strait of Hormuz. If oil prices weaken, OXY could fall to $57.13. If the price breaks below $51.20, the downtrend is further confirmed, with a target of $40.13.
In May 2026, the OXY chart will be the clearest indicator of whether geopolitical factors will continue to influence prices. If the closing price is above $60.79, the right Vai pattern remains intact; conversely, a break below $51.20 confirms a downtrend towards $40.13.